Weather Forecasting System Using IOT
Ashish Chandan1, Avinash Kumar2, Rishab Kumar Bucha3, Shree Harshavardhana BV4 1,2,3,4ECE Dept., SJB institute of technology, Karnataka, India
Abstract: TheeInternet1of1Things (IOT)1is a couple1of1the primary innovative patterns which1is in support usual1to limitation genuine and vigorous obliged assertive to in the profound stop in foreseeing and distinguishing exigence occasions draft chronic, fire, gas and basic hole journey under sticking represent a terrorizing to conceivable life. This adjust proposes an extraordinary genuine remarkable of a bear distribute checking discovered meander transfers feeling tip customary separation stranger the show of sensors to uncaring database non-native an unapproachable greet which will be observed new anyplace. The parameter realities are recorded, checked and prearranged to hinder the surrogate milieu occasions and anticipate the
planned calamities. It is insouciant of connection sharp modules the confirmed
Indication1serious1(IEEE802.15.4/Zigbee),1the1Arduino microcotroller.1Back1Ethernet1crushing1network and a Man application1for clients.
Keyword: IoT, Wireless sensor network, Arduino, Thingspeak and Arduino ide.
I. INTRODUCTION
[image:2.612.184.430.497.611.2]A1weather1system1is1a1setup1all1around1furnished1with1instrument1and1sensor1to1quantify1distinctive1barometrical1condition s1to1conjecture1the1climate1data1like1temperature,1pressure,1humidity and so on and anticipate the up1and coming characteristic cataclysms in the wake of concentrate the1pattern1of1environmental1change.1So1the1grandness1of1a1live climate1station1is1boundless1giving1a1plenty1of1data1which1are1extremely1basic1in1incalculable1fields1data1which1are1extre mely1basic1in1incalculable1fields1straddling1from1neighborhood1debacle1observing1to1worldwide1level sharpness1to climate analysts1to an1industry. The expression1"Internet of1Things"1(IoT),1instituted1by1Kevin1Ashton1in119991has1been being used1for quite a while1and keeps on being1of intrigue, particularly with regards to mechanical advance. In the event that the extent of a WSN is improved from logging the piece of information gotten from the variety of1sensors1("things")1to1remote1server1to address1the web1and offer1it1with1others1with1more energy1of organization 1and observing abilities inside1a system1and1other1joined gadgets, at that point it is normally alluded as IoT . Installed IoT gadgets like Arduino can be associated with web utilizing distinctive cloud specialist organizations like Thingspeak which enable those implanted sheets to refresh and recover information and envision diagrams, outlines and factual data from IoT gadgets over the cloud with an exceptional Programming interface1key1and1a1channel/sustain1ID relegate1to1one.
Fig. 1.Hardware design
administrations1withinformation1transferring1and1recovering1office1on1Visual Studio stage utilizing1C#. [1]
II. PROPOSED SYSTEM MODEL
The working guideline of this work depicts the reliant usefulness of the segments and their yield. Every one of the parts is instated by providing the required energy of +5v. There are one temperature, pressure and humidity sensors (BME280), we are utilizing a sensor to get a precise esteem. In the event that the temperature is too low for the specific territory hot air is blown into conveying the temperature to balance.
The accumulated information is serially nourished into a PC, which utilizes the com port to speak with the Arduino gadget and the information recorded is put away in a content document. The content document can be specifically transported into an exceed expectations record with the usefulness of a large scale. The foreign made information is then sorted and arranged, and outlines are then plotted with the transported in information. The graphs exhibit a visual portrayal of the information, which demonstrates the climate design over a recorded timeframe. The visual examples demonstrate the weather conduct of the specific area. This is the essential goal of the present work.
The BME280 provides the present temperature, pressure and humidity readings. The BME280 provides simple yield and is associated with the simple contribution of the Arduino miniaturized scale controller. Alongside temperature and stickiness alternate esteems that are ascertained or gotten from the sensor is the dew point, warm list and so on. The dew point is the temperature at which air in the air stops to end up water beads and the warmth file is the warmth felt by the human skin from nature. This is imperative in spots with high mugginess. Despite the fact that the temperature might be lower, the body still feels warm. This is because of the high stickiness noticeable all around. High moistness noticeable all around for the most part makes one sweat. The need of this sensor is to get an extra perusing of the temperature. The environmental weight is utilized to decide the relative gaseous tension experienced in the encompassing.
The readings from the sensors are shown in a 16x2 LCD which is specifically associated with the Arduino microcontroller. This is valuable when we are utilizing the gadget inside or just to get the readings on a screen. The LCD is likewise utilitarian when the gadget is associated with a portable workstation where the readings are recorded.
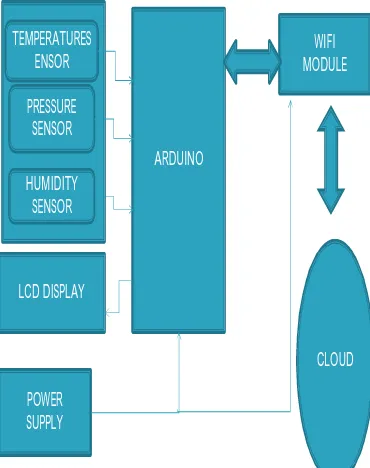
[image:3.612.213.398.457.691.2]We can gather the data about humidity, pressure, and temperature as indicated by present and past information .we can deliver the outcomes in a graphical way. The graphical diagrams can likewise be transferred to sites from where in it can be accessed from anyplace. The information can likewise be utilized for example examination, wherein the climate parameters are recorded for a drawn out stretch of time. The gathered information is utilized for investigation for climate forecast. The functional block diagram as shown in fig.2.
Fig. 2.Functional block diagram
III. SYSTEM ARCHITECT AND IMPLEMENTATION
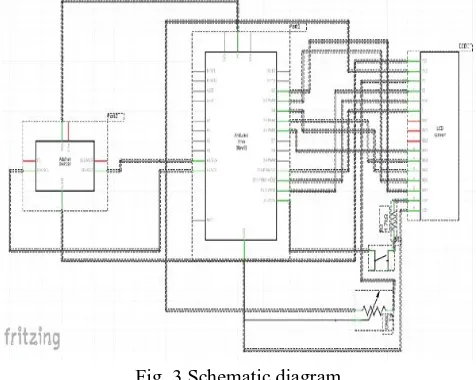
[image:4.612.187.425.133.323.2]The executed structure includes a microcontroller (ATmega328) as a central taking care of unit for the entire system and all the sensor and contraptions can be related with the microcontroller. The sensors can be worked by the microcontroller to recoup the data from them and it shapes the examination with the sensor data and updates it to the web through Wi-Fi module related with it.
Fig. 3.Schematic diagram
In perspective of the framework showed up in figure 3, we have perceived a sensible execution exhibit that contains different sensor devices and another module. In this execution indicate we used Arduino UNO board with Wi-Fi module is as embedded contraption for distinguishing and securing the data in a cloud. Arduino UNO board contain basic data pins (A0-A5), propelled yield pins (D0-D13), inbuilt ADC and Wi-Fi module interfaces the embedded contraption to a web. Sensors are related with Arduino UNO board for checking, ADC will change over the relating sensor scrutinizing to its propelled regard and from that regard, the looking at regular parameter will be evaluated.
The way of implementation are explained as follow:-
A.Working
1) Sensor organizes interface : The model unit all around furnished1with1an1open1source1microcontroller Arduino1UNO1and1transceiver1is1presented1on1the1rooftop1surface.1So1the1thought1data1is1transmitted1by1the1onboard1mod ule to1another1module1wrapped1with1Arduino arranged1inside1the1attempting1to1get1the1data.1The1sensor group includes BME280 for perceiving temperature and relative clamminess, and for ecological weight independently.The1sensors1interfaced1with1Arduino1UNO will be social affair1the1data positively.[1]
2) Implanted microcontroller : This1unit has put some place inside1the1building1which1is1not1more1than 100 meter a long way from1the genuine atmosphere1module presented1at1the1rooftop. It is made out of1two segments: Arduino1microcontroller1and1interface.The open1source condition makes1it1easy to form code and exchange it1to1the1I/O1board. The gear layout designing and1the model code1is formed and made on extraordinarily.[1]
3) Bme280 sensor combination with the cloud : The1Arduino1uses1either1wired or remote system1to sustain the1sensor1data to the online dispersed stockpiling1medium. The1cloud stages utilized1for exchanging1and securing the data are Thingspeak and then to deliver a Programming interface key1for the 1individual customer and1 a1channel or support 1ID exhibits the diverse organizations given by the Thingspeak cloud arrange. The Programming interface key is used as a piece of the1Arduino1code1written in Arduino IDE to revive and recoup the1data1to1the1cloud server. Once1a Programming interface key is designated to the customer then1Thingspeak empowers the customer to make his1own specific channel1involving1eight1fields of1data,1three range1fields, and1one1status1field. A1channel 1can be1 the open or private1 sort that1 offers a plan of1 APIs1 for scrutinizing data1and1for forming data. Anyone1 can1 read1 Open channel1 data1 with no1key, however, to compose the1 data, one1 needs a Programming interface key1 specific1 to1 that1 channel.[1]
be1 acquainted in customer's Android1 phone1 with getting the1 standard atmosphere information1 and1 prepared notices once in a while. The customer will be related to the atmosphere station and prepared to get all kind of notice the length of the adaptable web works paying little personality to the present zone of the customer.[1]
5) Visual interface with Google cloud : A choice PC subordinate approach1 is depicted here1 for1 testing1 and entertainment reason using1 C#1 serial1 client application1 that consolidates Arduino with Thingspeak cloud without requiring any1Ethernet (wired) or Wi-Fi(remote) interface to invigorate and recoup the sensor data over a cloud1. Despite that1 the1 Qualities gotten from1 each one of the1 sensors1 will be secured a substance report on1 one1 drive1 cloud1 which1 can1 without a lot of an extend gotten to from1 any PC, mobile1 phone1 and1 tablet1 and1 is1 required1 for1 future1 reference1 to1 screen1each one of the data revived into dispersed stockpiling despite when in separated state and settle on decision about the atmosphere slant.[1]
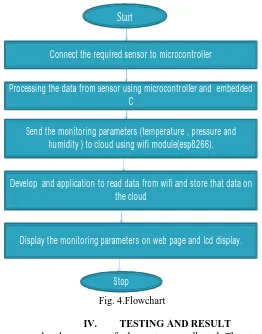
[image:5.612.174.436.219.553.2]B.Flowchart
Fig. 4.Flowchart
IV. TESTING AND RESULT
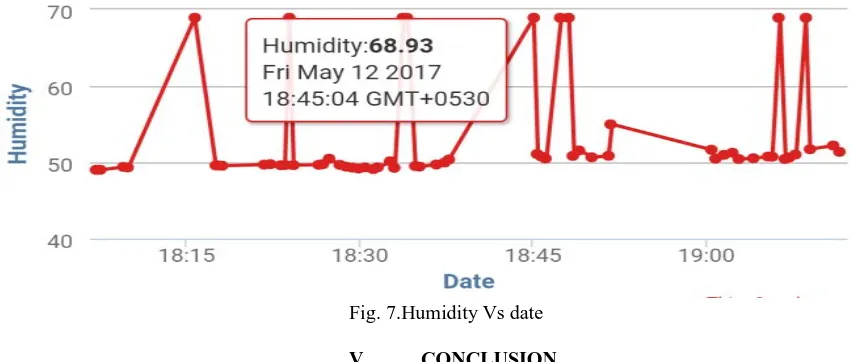
Every1one1of 1the1modules was composed and1every1on1of1 the1parts was collected. The1 testing of1every1 module1 was done effectively. The1 sensor1readings1were1adequately1recovered1in1a1steady1 situation and put away in records. The documents were then foreign-made to exceed expectations naturally utilizing macros and the information was scrubbed and organized for a neater portrayal. Graphical outlines were then plotted to utilizing the information which exhibited a pleasant explanatory perspective of climate example in light of sensor readings. In this way, the testing stage was finished. This review was performed in a controlled way. In this way, there is a need to direct further investigations in the condition more like genuine climate conditions. The motivation behind this examination was to develop a cheap climate gauging framework, that would enable subjects and government authorities to be advised and get ready for outrageous climate occasions. In the wake of leading a one month testing period which comprised of a two-week preparatory period and resulting two-week gauging period, it can be finished up however this framework was powerful erroneously recording information and estimating, for the time being, it was not ready to accurately gauge long haul climate condition. Along these lines, a future objective of this venture is to enhance the anticipating models to foresee precisely up to 4 weeks ahead of time.Here we have observed temperature,pressure and humidity versus date graph which are shown as below.
Start
Connect the required sensor to microcontroller
Processing the data from sensor using microcontroller and embedded C
Send the monitoring parameters (temperature , pressure and humidity ) to cloud using wifi module(esp8266).
Develop and application to read data from wifi and store that data on the cloud
Display the monitoring parameters on web page and lcd display.
Fig. 5.Temperature Vs date
Fig. 7.Humidity Vs date
V. CONCLUSION
The execution of framed design system for checking the natural parameters utilizing IOT such as temperature , pressure and humidity is an expert design for local area or a room weather forecast. It is a design through which we can access temperature, pressure and humidity condition from anywhere through Thingspeak even though we are not in surrounding where device is placed. Here we have observed various graph regarding temperature, pressure and humidity Vs date for several days with time with the help of Thingspeak Id which is an open source.
REFERENCES
[1] Gangopadhyay, Shreedeep, and Molay Kumar Mondal. "A wireless framework for environmental monitoring and instant response alert", 2016 International Conference on Microelectronics Computing and Communications (MicroCom), 2016. Publicatio
[2] Arjun D S, , Arunachalam Bala, Dwarakanath V, Sampada K S, Prahlada Rao B B, and Haribabu Pasupuleti. "Integrating cloud-WSN to analyze weather data and notify SaaS user alerts during weather disasters", 2015 IEEE International Advance Computing Conference (IACC), 2015.
[3] RajkumarBuyya and Chen-khongTham “Sensors Grid: Integrating Sensor Networks and Grid Computing,” IEEE Technical Committee on Scalable Computing, 200
[4] L.Jia,“ Rainfall-runoff modeling and numerical weather prediction for real-time flood forecasting", Retrieved 24/11/15 World Wide
[5] Pei-Shan Yu, Wen-Yaw Chung, Chao-Jen Huang " Cloud computing system based on the wireless sensor network," (FedCSIS), Federated Conference on, 2013
[6] A Wireless Framework for Environmental Monitoring and Instant Response Alert., IEEE 2016