©IJRASET: All Rights are Reserved
1396
Low Pass Fir Filter Design and Performance
Analysis Using Blackman & Bartlett Window
Techniques
Manju Rajput1, Tripti Kurrey2, Pranay Kumar Rahi3 1,2B.E, Scholar, 3Assistant Professor
1, 2, 3 Department of Electrical and Electronics Engineering.Institute of Technology, Korba, Chhattisgarh india. Abstract: DSP is the main branch of electronics. It is also used the representation by sequence of number or symbol and the processing of these signals. Dsp have many more applications which are useful in our life. In this Paper low pass FIR Filter has been designed and simulated using Bartlett and Blackman Window Techniques. We represent the Role and key features of Low pass FIR filter. The digital filter are widely used in field of communication engineering and also for the purpose of
commutation. Here we determined the coefficient of FIR filter by using MATLAB simulation . By the comparative analysis of both the window technique we conclude that, the Blackman window technique posses the better magnitude and phase response as when compared with Bartlett window technique.
Key Words: DSP, Digital Filter, FIR filter, Low Pass Filter, Blackman Window, Bartlett Window Techniques, MATLAB.
I. INTRODUCTION
Signals play a major role in our life. In general, a signal can be function of time, distance, position, temperature, pressure, etc, and it represents some variable of interest associated with a system. For example, in an electrical system the associated signals are electric current and voltage. Examples of signals that we encounter in our daily life are speech, music, pictures and video signals. A signal can be represented in a number of ways. Most of the signals that we come across are generated naturally. Mathematically, a signal can be represented in terms of basic function in the domain of the original independent variable or it can be represented in terms of basic functions in a transform domain. Similarly, the information contained in the signal can also be extracted either in the original domain or in the transform domain [1].
Digital filtering is one of the most powerful tools of DSP. Digital filters are capable of performing those specifications which are extremely difficult to achieve with an analog implementation. In addition the characteristics of a digital filter can be easily changed under software control.
A. There are two major types of digital filters are 1) Infinite Impulse response (IIR) filters
2) Finite Impulse response (FIR) filters.
Infinite Impulse Response (IIR) digital filter has the problems of phase non-linearity. Therefore it is a low order. The window method is simple and efficient way to design an FIR filters. In the Window Design Method the unit impulse response of ideal filter is obtained by applying Inverse Fourier Transform to the ideal frequency characteristics of digital filter. Then this unit sample response must be truncated at some point, this process is equivalent to multiplying it by a finite length window function .The frequency response can also be modified by choosing different window functions [2].
A digital filter is a system which passes some desired signals more than others to reduce or enhance certain aspects of that signal. It can be used to pass the signals according to the specified signals according to the specified frequency pass-band and reject the other frequency than the pass-band specification.
B. The basic filter types can be divided into four categories 1) Low-pas
2) High-pass
3) Band-pass
A. The FIR filter design process using window functions can be computed as 1) Define filter specification
2) Specify a window function as reported by the filter specifications
3) Compute the coetaneous of the window function to be used
4) Compute the coetaneous the ideal filter according to the filter order
5) Compute FIR filter coetaneous in accordance the obtained window function and the coefficients of the ideal filter
6) If the resulting filter has a very wide or a very narrow transition region, it is mandatory to change the filter order by decreasing or increasing it according to needs, and after this process the steps 3, 4 and 5 are iterated as many times as needed .
B. In this paper used windows Techniques are 1) Blackman Window Technique
2) Bartlett Window Technique.
a) Blackman Window: In common delegation, the unqualified term Blackman window refers to α = 0.16, as this most closely
approximates the "exact Blackman”, with
W (n) = a0-a1cos +a2cos ... (2)
Where;
a0=
a1=
a2= [1]
(b) bartlett window: In Bartlett window technique the pass band and stop band ripples are occurs & we get sampling frequency by
the help of this window technique. we can calculate the order of filter and find the filter coefficient [4].
[image:3.612.179.419.494.701.2]III. DESIGN SIMULATION
©IJRASET: All Rights are Reserved
[image:4.612.184.426.469.684.2]1398
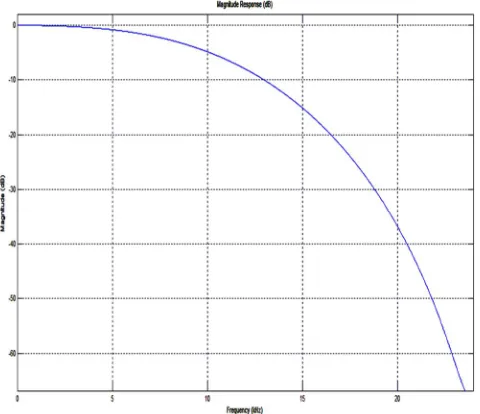
Fig 1.3 Magnitude Response of Bartlett Window Technique.
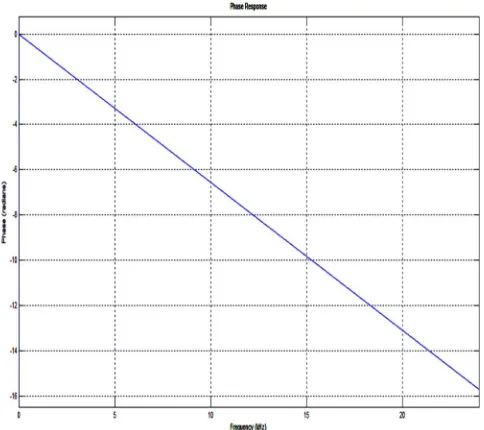
Fig1.5 Phase Response of Blackman Window Technique.
Fig 1.8 Filter Coefficients for Blackman Window Technique.
[image:5.612.187.426.535.695.2]Fig 1.9 Filter Coefficients for Bartlett Window Technique.
©IJRASET: All Rights are Reserved
[image:6.612.180.432.81.195.2]1400
Fig 1.12 Time Domain & Frequency Domain of Bartlett window.
[image:6.612.197.413.241.389.2]IV. COMPARITIVE ANALYSIS
Fig 1.13 Magnitude Comparison of Blackman & Bartlett Window Technique.
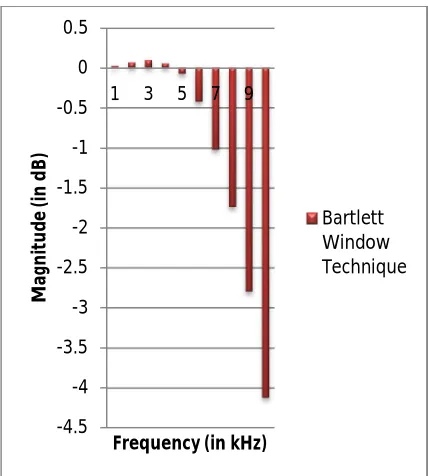
[image:6.612.196.415.431.690.2]Chart 1.1 Magnitude and Frequency plot of Blackman Window Technique.
Chart 1.2 Magnitude and Frequency plot of Bartlett Window Technique.
[image:7.612.199.413.273.511.2]V. RESULT
Table 1.2 Simulation results from MATLAB.
Window technique Relative side lobe attenuation Main lobe width (-3dB) Leakage factor Blackman
window -64dB 0.3593 0% Bartlett
window -25.8dB 0.2812 0.29%
-6 -5 -4 -3 -2 -1 0
1 3 5 7 9
M ag n it u d e (i n d B )
Frequency (in kHz)
Blackman Window Technique -4.5 -4 -3.5 -3 -2.5 -2 -1.5 -1 -0.5 0 0.5
1 3 5 7 9
M a gn it u d e (i n d B )
Frequency (in kHz)
©IJRASET: All Rights are Reserved
1402
Table 1.3 Magnitude and Frequency results of Rectangular Blackman and Hanning Window Technique. Frequency
(kHz)
Magnitude (dB)
Blackman window Bartlett window 1 -0.0234 0.0188 2 -0.1063 0.0654 3 -0.2735 0.0932 4 -0.5060 0.0533 5 -0.8103 -0.0763 6 -1.3184 -0.4255 7 -1.9568 -1.0229 8 -2.6574 -1.7402 9 -3.6132 -2.7952 10 -4.8653 -4.1222
From MATLAB simulation result of Blackman and Bartlett window techquenic at sampling frequency (fs) 48000Hz and cut off
frequency (f c) 10800Hz.
VI. CONCLUSION
In this research paper Low pass FIR filter has been designed using MATLAB Bartlett and Blackman window technique. It concludes by comparative values of both magnitude and phase response of the filter using both the techniques at same frequency i.e.
fC=10800Hz and fS=48000Hz.
In Blackman windowing technique the unwanted signals are not present after the cut-off frequency, but this technique also cuts the wanted signals.
In Bartlett window shows lesser magnitude response as compared to Blackman window technique and having no ripples in stop band region.
Therefore we conclude that, the Blackman window technique posses the better magnitude and phase response as when compared with Bartlett window technique.
REFRENCES
[1] Sumit Chakravorty, Pooja Pandey, Sashwat Vohra, Mukesh Chandra, Pranay Kumar Rahi “High Pass FIR filter design and performance analysis using
rectangular and blackman technique” IJISET vol. No. 3, issue No.8, August 2016, ISSN (online) 2348 – 7968.
[2] Sumit Chakravorty, Pooja Pandey, Durgesh Sahu, Pranay Kumar Rahi “Magnitude and Phase Response of Low pass FIR filter using R
[3] actangular and Blackman window Techniques” IJISET vol. No. 3, issue No. 8, August 2016, ISSN (online) 2348 – 7968.Er. Sandeep Kaur, Er. Sangeet Pal
Kaur “Design of FIR filter using hanning window, hamming wundow and Modified hamming window” IJARCET vol. No. 4, issue 5, May 2015, ISSN 2278 -1323
[4] https://en.wikipedia.org/wiki/Window_function
[5] S. Salivahanan & C. Gnanapriya “Digital Signal Processing” 2nd edition Mc. Graw Hill publications
[6] Math works, “Users Guide Filter Design Toolbox 4”, March-2011
[7] Alan V. Oppenheim and Ronald W. Schafer “Digital Signal Processing” Eastern Economy Edition
[8] Sumit Chakravorty, Pooja Pandey, Pranay Kumar Rahi “Magnitude and Phase Response of Low Pass Fir Filter Using Rectangular, Blackman, Hanning &
Bartlett Window Techniques” IJRASET Volume 5 Issue IV, April 2017, ISSN: 2321-9653.
AUTHORS
Manju Rajput pursuing Bachelor of Engineering in Electrical & Electronics Engineering in 4th semester from
Institute of Technology, Korba, affiliated from Swami Vivekanand Technical University, Chhattisgarh, India
Institute of Technology, Korba, affiliated from Swami Vivekanand Technical University, Chhattisgarh, India.