EEG Signal Classification and Drowsiness
Detection in Driver
S Gulnaz1, B. S. Anjan Kumar2, Dr. H. N. Suresh3
1 MTech, Department of Electronics and Instrumentation, Bangalore Institute of Technology, V.V.Puram, Bangalore 560004, Karnataka, INDIA
2 Assistant Professor, Department of Electronics and Instrumentation, Bangalore Institute of Technology, V.V.Puram, Bangalore 560004, Karnataka, INDIA
3 Professor and PG Co-ordinator, Department of Electronics and Instrumentation, Bangalore Institute of Technology, V.V.Puram, Bangalore 560004, Karnataka, INDIA
Abstract: traffic accidents are increasing due to driver’s consumption of alcohol or due to drowsiness. Breathalyzers are used for the purpose of alcohol detection, these device measure the amount of alcohol rather than loss of function caused by alcohol. In this paper people were tested and determined whether they were alcoholic or not with the help of eeg data. Based on the features extracted from wavelet transform, we can classify using svm the given eeg signal contains the alcoholic content or not. Along with the alcoholic detection the condition of the driver was also monitored. I.e., the driver fatigue monitoring system using image processing algorithms such as viola-jones detection, clahe, haar wavelet. We can recognize the fatigue condition and drowsiness condition by processing on the captured images of driver’s face. Depending on the eye’s position or yawning of the driver we can predict that he is in drowsy state or not.
Keywords: svm,viola-jones detection algorithm ,clahe,haar wavelet transform
I. INTRODUCTION
The excessive consumption of alcoholic beverages is an important social and medical problem. This problem causes adverse social and economic effects on the individual drinker, the drinker’s immediate environment and society as a whole. Indeed, other people rather than the drinker can be affected for example, by related traffic accidents or violence. Depending on the amount used alcohol can reduce coordination, slow reflexes and lead to over confidence. Alcohol also depresses parts of the central nervous system it slows down some of brain functions. Nowadays, testing for alcohol consumption is done using a breathalyzer test. Ethyl alcohol can also be measured in blood sample, urine, or in saliva.
In reality, the signals received from human brain contain information about the person’s current status. The signals received from drunk people change in a certain range of frequency. Thus, alcohol’s impact on human behavior can be detected much more clearly than using only breathalyzers. the measurements of the EEG signals can be made much easier and therefore much more accurate results can be obtained.
Drowsiness is transition state between awaking and sleep during which a decrease of vigilance is generally observed. Drowsy driver detection system is one of the potential applications of intelligent vehicle systems. These image-processing based methods detect eye-activity changes or Yawning and can achieve a satisfactory recognition rate.
drivers EEG signal is detected first, if EEG detection results driver is in alcoholic state then warning is given which could help to prevent many accidents and consequently save money and reduce personal suffering. if EEG detection results driver is not in alcoholic state then driver’s drowsiness detection is monitored .
©IJRASET: All Rights are Reserved
1509
II. EEGSIGNALCLASSIFICATION
Through the measurement of EEG signals we can predict the condition of the person such that whether he intake any alcoholic drinks or not. This is done based on the extracted features from the EEG signals. The steps for EEG signal classification are,
Input EEG signal Wavelet decomposition
Vector of reconstructed coefficients Feature extraction
Classification using SVM
A. Wavelet Analysis
The signal Analysis and Image Analysis are comes under wavelet analysis. Since we are considering EEG signal as the main source. The proposed process comes under signal Analysis. The Multi-level 1D wavelet decomposition is performed using a wavelet family named Daubechies-8(db8). The output decomposition structure contains the wavelet decomposition vector C and the bookkeeping vector L.
Syntax:
[C,L] = wavedec(X,N,'wname')
It returns the wavelet decomposition of the input EEG signal X at level 8. The detail and approximate coefficients are extracted from the wavelet decomposition structure.
D = detcoef(C,L,N) computes the detail coefficients of 1-D signal
A=appcoef(C,L,’wname’,N) computes the approximation coefficients of 1-D signal. Where,
X is the input signal
N is the number of decomposition levels wname is the wavelet family name C-waveet decomposition vector L-bookkeeping vector
D-detail coefficients
A-approximation coefficients
B. Feature Extraction Using Wavelet
[image:3.612.199.392.522.697.2]We extracted the features such as Gamma, Beta, Alpha, Theta and Delta from the wavelet output. we reconstruct the coefficients of a one-dimensional signal from the wavelet decomposition structure and either a specified wavelet name.
Syntax:
X = wrcoef('type',C,L,'wname',N) C-wavelet decomposition vector L-bookkeeping vector
‘wname’-wavelet family name
N is the number of decomposition levels X-vector of reconstructed coefficients ‘type’-d(detail)
‘type’-a(approximation)
The Fast Fourier Transform (FFT) is applied to the detail coefficient after subtracting the mean or best-fit line from the time-series object. It is usually done for FFT processing.Then the output graph is displayed between frequency in X-axis and FFT applied feature output such as Gamma, Beta, Alpha, Theta and Delta in Y-Axis.
C. Classification Using Svm Algorithm
Among the five features, Gamma and Alpha are selected as the best features. These feature values of all the EEG signals are given as the trained input. There are totally 2 Groups we are going to classify, Normal or Alcoholic person. The feature values of the selected test image are considered as the testing feature. These all three are the input to SVM classifier. SVM classifier will train the values and classify that the given EEG signal belongs to Normal Person or Alcoholic person.
III. DROWSINESS DETECTION
The drowsiness condition of the driver is detected and classified based upon the condition of the driver. The drowsiness is identified when the eyes of the driver becomes close state for more than five seconds and also if he is in yawning mode. We are giving the different images of driver as the input. Based on the extracted features, we can classify that the driver is in normal state or drowsy state. The steps are as follows,
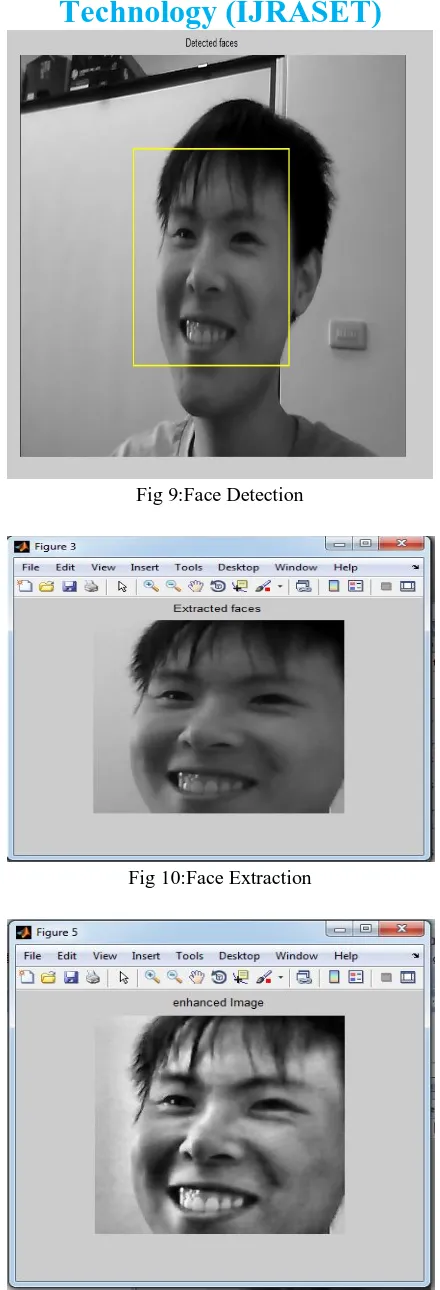
A. Face Detection
The Face image of the driver is detected using viola-jones detection algorithm. The non-face area is not detected. Then we can extract the detected face area separately.
B. Rgb To Gray Conversion
The face image was in RGB format. The input image was converted into different channels i.e., Red band, Green band and Blue band separately. If it was in 3-channel format (24 bits/pixel) we can convert the RGB image into grayscale image using RGB to gray conversion. Image Resizing process also done if needed.
C. Image Enhancement Using Clahe
The images are noisy with rotational and translational variations. To remove these variations, it is subjected to preprocessing steps. This process is called as Image enhancement. The image is enhanced by using Contrast Limited Adaptive Histogram Equalization (CLAHE) for better visualization.
Contrast Limited Adaptive Histogram Equalization (CLAHE) is used to expand the pixel value distribution of an image so as to increase the contrast information. The histogram after the histogram equalization occupies all the range from 0 to 255 and the visualization effect is enhanced.
D. Haar Wavelet Transform (Dwt)
©IJRASET: All Rights are Reserved
1511
[image:5.612.199.413.102.376.2]horizontal, vertical and diagonal coefficients. Hence reduces the converging time of tracking algorithm as shown in figure3.1. Two dimensional wavelet decomposing is shown in figure 3.2.
Fig 2: Wavelet Decomposition
Fig 3: Wavelet Decomposing stage E. Shape Feature Extraction
The shape properties of regions of the image are measured. Many features such as Area, Major Axis length, Minor Axis length, Eccentricity etc are extracted. Among them, the Area is selected as the best feature and it is extracted.
F. Classification
Based on the extracted feature values, the driver state is classified as Normal state or drowsy state. If the eyes of the driver are closed for more than a few seconds or if he is yawning, then it is classified as drowsy state.
IV. EXPERIMENTAL RESULTS AND DISCUSSION
The drivers EEG signal is detected first, if EEG detection results driver is in alcoholic state then warning is given which could help to prevent many accidents and consequently save money and reduce personal suffering. if EEG detection results driver is not in alcoholic state then driver’s drowsiness detection is monitored.
[image:5.612.199.418.575.712.2]The Input EEG signal is given ,its frequency measurement gives gamma and alpha frequencies which is trained using SVM to calssify whether the given EEG belongs to alcoholic or non alcoholic person.
Fig 5: Frequency Measurements
Fig 6: EEG signal of a Abnormal person
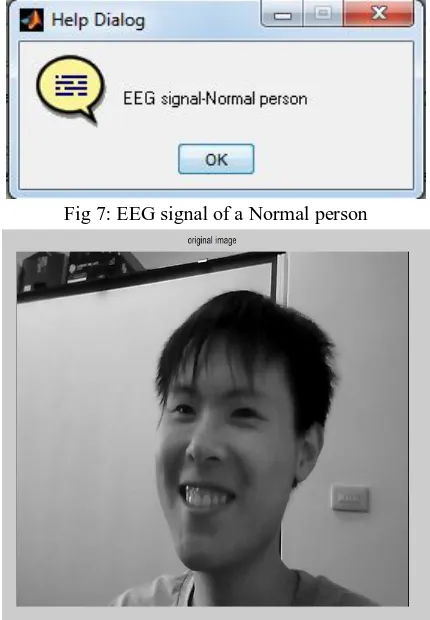
[image:6.612.190.412.70.334.2]The above EEG belongs to a alcoholic person .So we warn the Driver.Now,we choose EEG of a non alcoholic person so that drowsiness detection can be done.We give Driver’s Face as input and by using image processing algorithm we classify whether the driver is in Drowsy state or not
Fig 7: EEG signal of a Normal person
[image:6.612.198.413.394.704.2]©IJRASET: All Rights are Reserved
[image:7.612.196.416.62.707.2]1513
Fig 9:Face Detection
Fig 10:Face Extraction
Fig 12:Haar Image
Fig 13:Driver is in Active mode
Based on the input images selected,the classification results Driver is in active or sleepy or in yawning mode.if the driver is in Sleepy and Yawning mode warning is given to avoid accidents.
Fig 14:Driver is in Sleepy mode
V. CONCLUSION
©IJRASET: All Rights are Reserved
1515
VI. FUTURE WORK
A real-time wireless EEG-based brain–computer interface (BCI) system for drowsiness detection. The proposed BCI system consists of a wireless physiological Signal-acquisition module and an embedded signal-processing module. Here, the wireless physiological signal-acquisition module is used to collect EEG signals and transmit them to the embedded signal-processing module wirelessly. The embedded signal processing supports various peripheral interfaces, is used to real-time detect drowsiness and trigger a warning tone to prevent traffic accidents when drowsy state occurs.
VII. ACKNOWLEDGMENTS
Any achievement, be it scholastic or otherwise does not depend solely on the individual efforts but on the guidance, encouragement and co-operation of intellectuals, elders and friends. A number of personalities, in their own capacities have helped me to work on watermarking . I would like to take this opportunity to thank them all. I would like to thank my PARENTS for their constant moral support throughout. I also extend my sense of gratitude and sincere thanks to all the faculty members of Electronics and Instrumentation Engineering, Bangalore Institute of Technology, for their constant encouragement and support.
REFERENCES
[1] M. Akin, M. Kurt, N. Sezgin, and M. Bayram, “Estimating vigilance level by using EEG and EMG signals,” Neural Comput. Appl., vol. 17, pp. 227–236, 2008 [2] W. Dement and M. Carskadon, “Current perspectives on daytime sleepiness: The issues,” Sleep, vol. 5, no. S2, pp. S56–S66, 1982
[3] P. Forsman, B. Vila, R. Short, C. Mott, and H. van Dongen, “Efficient driver drowsiness detection at moderate levels of drowsiness,” Accid. Anal. Prevent., vol. 50, pp. 341–350, 2013
[4] E.Hitchcock and G. Matthews, “Multidimensional assessment of fatigue: A review and recommendations,” in Proc. Int. Conf. Fatigue Manage. Transp. Oper., Seattle, WA, USA, Sep. 2005
[5] L.Hartley, T.Horberry, N.Mabbott, and G. Krueger, “Review of fatigue detection and prediction technologies,” Nat. Road Transp. Commiss., Melbourne, Vic., Australia, Tech. Rep., 2000
[6] S. Hu and G. Zheng, “Driver drowsiness detection with eyelid related parameters by support vector machine,” Exp. Syst. Appl., vol. 36, pp. 7651–7658, 2009 [7] S. Kee, S. Tamrin, and Y. Goh, “Driving fatigue and performance among occupational drivers in simulated prolonged driving,” Global J. Health Sci., vol. 2, no.
1, pp. 167–177, 2010.
[8] S. Kar, M. Bhagat, and A. Routary, “EEG signal analysis for the assessment and quantification of drivers fatigue,” Transp. Res. F, Traffic Psychol. Behav., vol. 13, no. 5, pp. 297–306, 2010.
[9] A. Kokonozi, E. Michail, I. Chouvarda, and N. Maglaveras, “A study of heart rate and brain system complexity and their interaction in sleepdeprived subjects,” in Proc. Conf. Comput. Cardiol., 2008, pp. 969–971
[10] M. Kurt, N. Sezgin,M. Akin, G. Kirbas, and M. Bayram, “The ANN-based computingof drowsy level,”Exp. Syst. Appl., vol. 36, pp. 2534–2542, 2009. [11] Y. Liang, M. Reyes, and J. Lee, “Real-time detection of driver cognitive distraction using support vector machine,” IEEE Trans. Intell. Transp. Syst., vol. 8, no.
2, pp. 340–350, Jun. 200
[12] C. Liu, S. Hosking, and M. Lenne, “Predicting driver drowsiness using vehicle measures: Recent insights and future challenges,” J. Safety Res., vol. 40, no. 4, pp. 239–245, Aug. 2009
[13] S. Lal and A. Craig, “A critical review of the psychophysiology of driver fatigue,” Biol. Psychol., vol. 55, no. 3, pp. 173–194, 2001
[14] J. May and C. Baldwin, “Driver fatigue: The importance of identifying causal factors of fatigue when considering detection and countermeasure technologies,” Transp. Res. F, Traffic Psychol. Behav., vol. 12, no. 3, pp. 218–224, 2009
[15] M. Patel, S. Lal, D. Kavanagh, and P. Rossiter, “Applying neural network analysis on heart rate variability data to assess driver fatigue,” Exp. Syst. Appl., vol. 38, pp. 7235–7242, 2011
[16] M.-H. Sigari, M.-R. Pourshahabi, M. Soryani, and M. Fathy, “A review on driver face monitoring systems for fatigue and distraction detection,” Int. J. Adv. Sci. Technol., vol. 64, pp. 73–100, 2014
[17] J. Wang, S. Zhu, and Y. Gong, “Driving safety monitoring using semisupervised learning on time series data,” IEEE Trans. Intell. Transp. Syst., vol. 11, no. 3, pp. 728–737, Sep. 2010