Technology (IJRASET)
©IJRASET: All Rights are Reserved
960
Study of Solar Photovoltaic Systems to Improve
Energy Efficiency for Chennai Flats
S. Binil Sundar1, Vinayak Dave2
1,2
Asst Professor (SG), Civil Engineering Department
Saveetha School of Engineering, Saveetha University, Chennai, India
Abstract--Energy plays an important role in our daily life as well as in the national security of a country. It also runs as the wheel of economy of the country. The recent increase in energy prices, population and industrialization are the most significant threats to energy security. The energy demand is increasing day by day with population growth indicating poor utilization of energy. But Tamilnadu is blessed by plenty of renewable energy possibilities which can be used to eliminate energy scarcity problem and to get a sustainable economic growth. This research focuses mainly on solar energy as a sustainable and renewable choice of technology for the Chennai apartments. Since Chennai has better potential in solar power. In this research different types of apartments were taken into consideration in Chennai for analysis of power consumption and based upon the requirements, various solar PV are compared to support and generate power. A detailed analysis on cost management, payback assessment and carbon footprints have been done based on the data’s collected from various Project officers, electrical consultant engineer’s and Project manager of different organizations in Chennai. The results show that up to 60% of electricity bill can be saved by using solar panels in apartments. Among various solar panels, mono crystalline solar panel is found to be effective. Though the cost of solar panels are more it can generate better income when the plant is located on suitable site and fast term on payback time.
Keywords: Carbon savings, Cost management, Energy security, Payback period, Renewable Energy Technology, Solar Energy
I. INTRODUCTION
A. Background
Energy is critical, directly or indirectly, in the entire process of evolution, growth and survival of all living beings and it plays a vital role in the socio-economic development and human welfare of a country. India faces a significant challenge in providing access to adequate, affordable and clean sources of energy, the demand and supply imbalance in energy sources is pervasive requiring serious efforts by GOI to augment energy supplies. India imports about 80% of its oil and India was the world’s fifth largest net importer of oil. There is a threat of these increasing further, creating serious problems for India’s future energy security. There is also a significant risk of lesser thermal capacity being installed on account of lack of indigenous coal in the coming years because of both production and logistic constraints, and increased dependence on imported coal. Significant accretion of gas reserves and production in recent years is likely to mitigate power needs only to a limited extent. Difficulties of large hydro are increasing and nuclear power is also beset with problems. The country thus faces possible severe energy supply constraints.
B. Geography, Location and Climate of Tamil Nadu State
Tamil Nadu is located in the Northern hemisphere in the hot zone between 80 and 13' N latitude and between 780 and 800 E longitude. It is bounded on the east by the Bay of Bengal, in the south by the Indian Ocean, in the west by the states of Kerala and Karnataka and in the north by Karnataka and Andhra Pradesh.. The Western Ghats and the Eastern Ghats meet in the Nilgiris of Tamil Nadu. Rich varieties of flora and fauna are available in the geographical area of Tamil Nadu.. The climate is basically tropical. The state experiences south west and north east monsoon. Average annual rainfall is 925 mm. Chennai is very close to the equator, there is small fluctuation in seasonal temperature. The temperature rises to 40'C during the summer months but the average temperature in the winters revolves around 24'C. In Chennai monsoon rains from June to September.
C. Types of Solar Panel
Technology (IJRASET)
©IJRASET: All Rights are Reserved
961
Fig 1.1 Mono crystalline Fig 1.2 Poly crystalline
Fig 1.3 Thin film
D. Aim
The aim of the research is to develop solar energy as a sustainable and renewable choice of technology for Chennai apartments.
E. Objectives
To obtain continuous power supply for apartment. To determine the payback period of solar energy.
To reduce the level of carbon emission and carbon foot print To support demand and supply gap for apartments in power shortage
F. Need and Scope of the Project
The project will show the way to meet the power demand by utilizing power from solar PV. Project will bring cost efficiency for apartment owners. Carbon emission will be reduced.
II. LITERATURE REVIEW
A. Literature
Qiankun Wang and Qian Huang (2011) describes that the purpose of thiswork is to integrate the application of solar system and geothermal energy is to complement each other perfectly and to fully utilize renewable resources for low-carbon and energy saving ideas. In this paper, the application of the composite energy system in the engineering design of a project in Wuhan which belongs to hot summer and cold winter area will be evaluated in such aspects, including technical feasibility, system efficiency, economic and environmental impacts, in order to provide technical and practical experience for the design and application of integrated energy systems in the future.
Technology (IJRASET)
©IJRASET: All Rights are Reserved
962
years and 47% if the rest of operational energies, i.e. domestic hot water and appliances, is considered. Transport consumes 34- 51 % of the total life cycle energy consumption while the embodied energy of buildings was found to be of the same order of magnitude as their operational energy. Current energy assessment of buildings therefore often only analyses a small fraction of the total life cycle energy use. We should widen its scope to account for so-called indirect energy consumption. This paper shows that a more holistic approach to the assessment of the energy demand associated with buildings is necessary if significant improvements in their energy efficiency are to be achieved.
III. RESEARCH METHODOLOGY
A. Research Method
Detailed research done in collection of data’s and analysis are made, aim to identified and finding the potentials and development in solar energy for housing sector of Chennai. It constitutes of collections of solar energy report from various government and private sectors. In this research data have been collected based on the followings methods:
Sampling and Data collection
Seasonal variations and measures solar energy tech Cost management
Payback assessment Carbon emission
1) Seasonal Variations And Measures: In this study two different seasons are taken into account, summer and winter. For this two seasons power consumption details will be collect for different housing sectors and then suitable measures will be taken.
2) Solar Technology: Solar technologies are broadly characterized as either passive solar or active solar depending on the way they capture, convert and distribute solar energy. Active solar techniques include the use of photovoltaic panels and solar thermal collectors to harness the energy. In this study photovoltaic panels are taken for assessment.
3) Cost Management: Cost management is the process of planning and controlling the budget of a business. Cost management is a form of management accounting that allows a business to predict impending expenditures to help reduce the chance of going over budget. In this study cost detail for different solar panels are going to be analyzed.
4) Payback Assessment: The length of time required to recover the cost of investment. In this study payback period for different solar panel are going to be calculated.
5) Carbon Emission: A carbon footprint is the measure of the environmental impact of a particular individual or organization's lifestyle or operation, measured in units of carbon dioxide. In this study carbon saving will be calculated.
B. Approaches to Analysis
First, the data collected from the various respondents was analyzed for various questions such as the type of Renewable technologies used by builder for constructing Renewable units, the most suitable Solar technology, the level of success of technologies, the effectiveness of technologies in achieving less carbon emission, the barriers in adopting these technologies, the success of these technologies for housing sector, and the growth rate of these technologies in the past ten years. Next analyzed the data collected from the State electricity board such as the requirement of power for various utilities in the home during summer and winter.
C. Research Questions
The questions were designed based on objectives and the literature review. The questions were drafted carefully and reviewed with the author’s tutor. The questionnaire is presented in Appendix 1.
IV. RESEARCH ANALYSIS
A. Background of Study Area
Medavakkam is one among the southern suburbs of Chennai. It is a residential locality close to the Chennai Airport. It is located at 12.917158°N - 80.19287°E
Technology (IJRASET)
©IJRASET: All Rights are Reserved
963
Vanagaram is a residential neighborhood in the outskirts of Chennai, India. It is in North-East of Chennai and the fastest developing parts of the city. It is located at 13°3′12″N - 80°9′40″E
B. Sampling Data Using SPSS
SPSS (Statistical Product and Service Solutions) Statistics is a software package used for statistical analysis. SPSS provides facilities for analyzing and displaying information using a variety of techniques. This document uses version 20 of SPSS for Windows 7. Here are a few things that will be included in “The basics of Statistics” section.
Mean, variance, Standard deviation, descriptive statistics One sample Statistics Produce bar charts
Paired sample correlations
C. SPSS Window Process
The SPSS window can be viewed in two different windows. They are data view and variable view.
1) Variable View: Variable View contains descriptions of the attributes of each variable in the data file. In Variable View: Rows are variables.
Columns are variable attributes.
All of these attributes are saved when you save the data file.
D. Graph
The data may be broken down further with tables, which shown the joint distribution of two variables values as graphs.
1) Pie Chart Results
18%
32% Solar power
Hydroelectric
wind 27%
[image:5.612.107.467.383.670.2]Biomass 23%
Fig 4.1 Factors relating to Renewable Energy
Technology (IJRASET)
©IJRASET: All Rights are Reserved
964
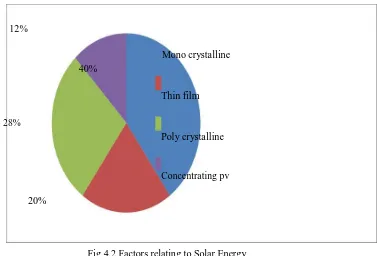
12%
Mono crystalline
28%
40%
Thin film
Poly crystalline
20%
[image:6.612.139.516.80.336.2]Concentrating pv
Fig 4.2 Factors relating to Solar Energy
The pie chart is drawn to find the main key factors in this set of questionnaire and using this main key factors analyze is done.
Table 4.1 power consumption detail for independent house (Vanagaram, Chennai)
S.No House Month EB Units Cost / unit Cost
Average per
season
April 720 5.75 3105 Summer
1 H 1
May 760 5.75 3335 1480
November 540 5.75 2070 Winter
December 520 5.75 1955 1060
Technology (IJRASET)
©IJRASET: All Rights are Reserved
965
P
o
we
r
(KW
)
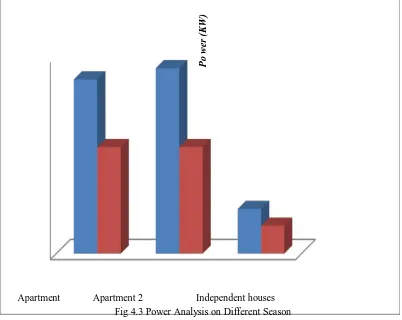
Apartment Apartment 2 Independent houses Fig 4.3 Power Analysis on Different Season
Figure (4.3) shows the power analysis detail for different seasons. In that figure we can find out that in summer season usage of power is more when compare to winter. Tables (4.1) and figure (4.3) show the requirement of power for various types of houses during summer and winter. Among various types of houses the requirement of power during summer for Apartment no.2 is 6.6 KW which is higher than all other types of houses. Similarly during winter season the requirement of power for that Apartment is 3.8 KW which is higher than other types. The analysis on requirement of power for house helps both the consumer who are the owners of the house and the builders who develop the renewable unit. This information helps the builders to design and develop a suitable Renewable unit with a capacity more than that of the requirement of power for the houses. Similarly it helps the consumers to decide the type of solar unit to buy and install in their house.
E. Comparison Of Cost For Different Types Of Solar Panels For Various Houses
[image:7.612.103.505.80.400.2]1) Annual Climate Graph Of Chennai:
[image:7.612.171.482.569.707.2]Technology (IJRASET)
©IJRASET: All Rights are Reserved
966
Figure (4.4) shows the gradual increase of temperature. The highest temperature i s occurs in April and May , which is the months where we can reach the maximum level of output in solar panels. During this period we can save lots of energy.
F. Payback Assessment Of Various Houses
[image:8.612.92.525.205.482.2]The payback period represents the time it takes the investment to be paid back. The payback period method is commonly used by companies to evaluate investments: the goal is to choose a project that will recover the investment in the shortest time. When the payback period is shorter than the cutoff period, the investment can be accepted. When the payback period is longer than the cutoff period, the investment cannot be accepted in accordance with the payback period method.
Table 4.2 Payback Assessments for Thin Film Solar Panel
Plant Total Power Annual Capital Payback Type of
Output Plant Consumed Savings Cost (In Period Required Output By Each Cost Lakhs) (In Houses
(Kw) (Kw) House Years) Each Year
H1 6.3 4600 6.2 26,450 6,20,000 24
H2
6.7 5760 6.6 33,120
6,40,000 20
H3
1.5 820 1.4 4,715
1,20,000 26
Tables (4.2) show the assessment of various houses are done with reference to the payback period (Appendix 2), which can be interpreted with different analysis on required output on solar panel, average power consumptions in kW, annual savings; capital cost varies with increase in power required and according to the available space.
G. Result Of Solar Panel Payback
Mono crystalline solar panel: a 6KW mono crystalline solar panel, in an exposed, sun shade area, recent monitoring of a range of small domestic solar systems has shown that a well sited 6 kW could generate around 8,000 kWh per year which is equivalent to around 5.0 tonnes of carbon dioxide a year. A system this size could generate income and savings of around 45,000 a year when eligible for the feed in tariff. A modern solar panel can be incorporated with aerospace technologies with sophisticated, yet simple, designs that allow them to operate reliably for up to a decade or longer without maintenance. These systems can operate for extended periods without attention; it typically require inspection only every two years during their 30 to 40 year design life. The solar energy technologies are very competitive with other renewable energy technologies that are suitable for homes, farms, and small businesses.
H. Carbon Footprint
A carbon footprint is the measure of the environmental impact of a particular individual or organization's lifestyle or operation, measured in units of carbon dioxide.
Technology (IJRASET)
[image:9.612.95.515.104.360.2]©IJRASET: All Rights are Reserved
967
table contains electricity generated from solar panel detail and amount of carbon emission saved. Table 4.3 Carbon Emission Analyze for Mono Crystalline Solar Panel
Type Of H1 H2 H3
Houses
Power 6.3 6.7 1.5 Required In
Each System
Electricity 7200 9000 1600 Generated
From Solar Panel
Carbon 6.048 7.560 1.344 Emission
(Tones)
V. PAYBACK PERIOD AND COST MANAGEMENT
The solar energy has been analyzed in this report with various key facts in terms of Life time energy, carbon and cost savings for which they are described as follows from the pay back calculation shown in (Appendix 2). Payback period is the length of time required to recover the cost of an investment. The payback period of a given investment or project is an important determinant of whether to undertake the position or project, as longer payback periods are typically not desirable for investment.
Table 5.1 Payback Periods and Cost Management for Mono Crystalline Solar Panel
Types Electricity Carbon Electricity Typical Cost Life Of
Generated Saving Saved @ cost & effectiveness time house
from solar (Tones) 5.75/kWh installatio of solar Of panel per Per year
n(lakhs)
panel (years)
solar
year
Panel (years) H1 7200 5.29240,365 7,65,000 19 40
[image:9.612.47.543.481.719.2]Technology (IJRASET)
©IJRASET: All Rights are Reserved
968
[image:10.612.50.541.146.431.2]H3 1600 1.2608,165 1,60,000 20 40
Table 5.2 Payback Periods and Cost Management for Poly Crystalline Solar Panel
Types Electricity Carbon Electricity Typical Cost Life Of
Generated Saving Saved @ cost & effectiveness time house
from solar (Tones) 5.75/kWh installatio of solar Of panel per Per year
n (lakhs)
panel (years)
solar
year
Panel (years) H1 5400 4.536 31050 660000 22 40
H2 7200 6.048 41400 680000 17 40
H
[image:10.612.68.538.477.719.2]3 1080 0.907 6210 140000 23 40
Table 5.3 Payback Period and Cost Management for Thin Film Solar Panel
Types Electricity Carbon Electricity Typical Cost Life Of
Generated Saving Saved @ cost & effectiveness time house
from solar (Tones) 5.75/kWh installatio of solar Of panel per Per year
n (lakhs)
panel (years)
solar
year
Panel
(years)
H1
4600 3.864 26450 640000 24 40
H2
Technology (IJRASET)
©IJRASET: All Rights are Reserved
969
H3
820 0.689 4715 120000 26 40
VI. CONCLUSIONS
Among various renewable energy resources, solar energy is found to be more promising and defective. By using solar panels in our homes we can nearly save 60% of the total electricity bill.
By analyzing various solar panels, mono crystalline type of solar panel found to be more efficient. The seasonal variations may give different output for different houses based on the solar panel capacity.
Though the cost of solar panel is more compare to other renewable technologies, but it can generate better income when the plant is located on suitable site and fast term on payback time.
REFERENCES
[1] Andre Stephana, Robert H. Crawford and Kristel de Myttenaere, ‘towards a more holistic approach to reducing the energy demand of dwellings’, Procedia Engineering 21, pp 1033–1041 (2011)
[2] Danny H.W. Li , Liu Yang , Joseph C. Lam, ‘Zero energy buildings and sustainable development implications: A review’, , Energy 54,pp 1-10 (2013) [3] Lavinia Chiara Tagliabuea, Mario Maistrello, Claudio Del Pero, ‘Solar heating and air-conditioning by GSHP coupled to PV system for a cost effective high
energy performance building’, Energy Procedia 30, pp 683 – 692 (2012
[4] Olawale Saheed Ismail, Olusegun Olufemi Ajide, Fredrick Akingbesote,’Performance Assessment of Installed Solar PV System: A Case Study of Oke-Agunla in Nigeria’, Procedia Engineering 4,pp 453-458 (2012)
[5] Pradhan Arjyadhara, Ali S.M and Jena Chitralekha, ‘Analysis of Solar PV cell Performance with Changing Irradiance and Temperature’, International Journal Of Engineering And Computer Science, Volume 2,pp 214-220 (2013)
[6] Pranpreya Sriwannawit and Staffan Laestadius, ‘Diffusion of photovoltaic systems for rural electrification in Thailand’, IJEE 4, pp 49-58 (2013)
[7] Pavlovic T. M, Milosavljevic D.D, Lj. Mirjanic D, Radonjic L.S, Pantic, L.S, Pirs D, ‘Analyses of pv systems of 1 kw electricity generation in Bosnia’, (Renewable energy sources), II-2 (2011)
[8] Poullikkas A, ‘Technology and market future prospects of photovoltaic systems’. International Journal of Energy and Environment 1(4), pp 617-634.(2011) [9] Qiankun Wang and Qian Huang, ’Research on integrated solar and geothermal engineering design in hot summer and cold winter’,Procedia Engineering 21,
pp 648-655,(2011)