R E S E A R C H
Open Access
Mapping human pluripotent stem cell
differentiation pathways using high
throughput single-cell RNA-sequencing
Xiaoping Han
1,2,8†, Haide Chen
1,3,5*†, Daosheng Huang
1,8, Huidong Chen
4,6, Lijiang Fei
1,8, Chen Cheng
7,
He Huang
2,8, Guo-Cheng Yuan
4*and Guoji Guo
1,2,3,8*Abstract
Background:Human pluripotent stem cells (hPSCs) provide powerful models for studying cellular differentiations and unlimited sources of cells for regenerative medicine. However, a comprehensive single-cell level differentiation roadmap for hPSCs has not been achieved.
Results:We use high throughput single-cell RNA-sequencing (scRNA-seq), based on optimized microfluidic circuits, to profile early differentiation lineages in the human embryoid body system. We present a cellular-state landscape for hPSC early differentiation that covers multiple cellular lineages, including neural, muscle, endothelial, stromal, liver, and epithelial cells. Through pseudotime analysis, we construct the developmental trajectories of these progenitor cells and reveal the gene expression dynamics in the process of cell differentiation. We further reprogram primed H9 cells into naïve-like H9 cells to study the cellular-state transition process. We find that genes related to hemogenic endothelium development are enriched in naïve-like H9. Functionally, naïve-like H9 show higher potency for differentiation into hematopoietic lineages than primed cells.
Conclusions:Our single-cell analysis reveals the cellular-state landscape of hPSC early differentiation, offering new insights that can be harnessed for optimization of differentiation protocols.
Keywords:Single-cell RNA-sequencing, Primed human pluripotent stem cell, Embryoid body, Naïve human pluripotent stem cell
Background
Thomson et al. derived human pluripotent stem cells (hPSCs) from human blastocysts for the first time in 1998 [1]. hPSCs have the capacity of self-renewal and multilineage differentiation both in vitro and in vivo. These features of hPSCs have provided remarkable promise in developmental biology and regenerative medicine [2]. hPSCs can be used to generate diverse cell-types from all three germ layers using different differentiation protocols [3–7]. However, most
existing protocols suffer from low efficiency and functional deficiency.
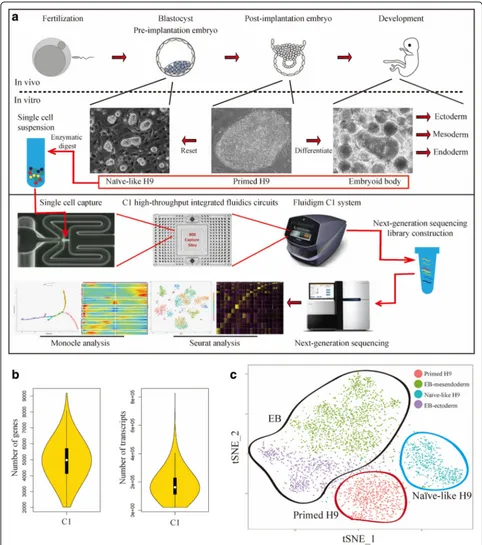
In vivo, fertilized mammalian eggs undergo multiple cleavage divisions and form blastocysts (Fig. 1a). The pre-implantation mouse epiblasts obtained from blasto-cysts have the ground-state naïve pluripotency that can be recapitulated in vitro in the form of embryonic stem cells (ESCs) [8, 9]. Soon after implantation, epiblasts become primed for lineage specification. In vitro, the counterparts of primed epiblasts are termed epiblast stem cells (EpiSCs), which are functionally and morpho-logically distinct from ESCs. These two states of pluripo-tent stem cells (i.e. ESCs and EpiSCs) are interchangeable under specific conditions [9]. The study of this cellular-state transition process will contribute to the understand-ing of early development from pre-implantation epiblasts to post-implantation epiblasts. Conventional hPSCs are
* Correspondence:[email protected];[email protected];
[email protected] †Equal contributors 1
Center for Stem Cell and Regenerative Medicine, Zhejiang University School of Medicine, Hangzhou 310058, China
4Department of Biostatistics and Computational Biology, Dana-Farber Cancer
Institute, Harvard Chan School of Public Health, Boston, MA 02115, USA Full list of author information is available at the end of the article
considered as the primed state with the molecular and functional identity of post-implantation lineage-primed epiblasts. Several groups have established the naïve hPSCs,
which share several molecular features and functional characteristics with naïve mPSCs and pre-implantation epiblasts [10–16]. Following lineage specification, primed
[image:2.595.56.538.87.632.2]epiblasts develop into embryonic ectoderm and primitive streak, which further develop into embryonic mesoderm and endoderm. These three embryonic germ layers de-velop into all embryonic tissues. Under proper in vitro culture conditions, hPSCs can undergo spontaneous dif-ferentiation and form a three-dimensional (3D) structure called embryoid body (EB), which contains cells from all three germ layers [17,18]. The EB differentiation system is a widely used model to study the early differentiation of various lineage-specific progenitors, including cardiac muscle [19], blood [20], liver [21], and neuron [22], etc. hPSCs (both primed and naïve) and EBs are powerful models to simulate early developmental process in vitro, from pre-implantation epiblasts to lineage-committed progenitors.
hPSC differentiation is a complex process. Flow cy-tometry and immunostaining have been used to define cell types in hPSC differentiation cultures. However, these methods are limited by the number of fluorescent probes that can be used at the same time; the heterogen-eity of the hPSC differentiation process cannot be fully resolved. Single-cell RNA-sequencing (scRNA-seq), first released in 2009 [23], has provided a promising alterna-tive. During the past few years, the technology has been vastly improved by the development of numerous in-novative approaches [24, 25], including C1 (SMARTer) [26], SMART-seq2 [27], CEL-seq [28], Drop-seq [29], InDrop [30], 10X Genomics [31], etc. To date, single-cell technology has been used to study cellular heterogeneity in a wide range of systems [24], including the hierarchy of tumor cells [32,33], tissue and organs [34–37], devel-oping embryos [38, 39] and in vitro differentiation sys-tems [40–42].
We use the upgraded Fluidigm C1 system with opti-mized high-throughput integrated fluidics circuits (HT IFCs) to construct the early differentiation trajectories of various lineage-specific progenitors derived from hPSCs and to reveal the interaction between these pre-cursor cells in EB differentiation system. We find key TFs and signaling pathways that direct the differenti-ation process. We show that liver may be involved in regulating the differentiation of other tissue cells through cell–cell interactions. We also use the C1 scRNA-seq platform to study the primed-to-naïve tran-sition process and to reveal the differences in gene expression profiles between Primed and Naïve-like H9. Combined with the analysis of EB differentiation, genes related to hemogenic endothelium development and MAPK-ERK1/2 signaling pathway are enriched in Naïve-like H9 but not in Primed H9. Functionally, Naïve-Naïve-like H9 show the differentiation bias to endothelial-hematopoietic lineages. Taken together, we construct a comprehensive single-cell level differentiation roadmap for hPSCs and offer new insights into early embryonic lineages that can
guide the establishment and optimization of more sophis-ticated differentiation system.
Results
scRNA-seq analysis of hPSCs and EBs
In order to systematically map hPSCs early differenti-ation pathways, Naïve-like H9, Primed H9, and EBs were prepared as single-cell samples for sequencing using Fluidigm C1 system with HT IFCs (Fig.1a). This system can be used to analyze up to 800 cells at a time and detect an average of 5000 genes per cell. A major advan-tage of this technology is the balance of throughput and resolution. After sequencing and data processing, we got high-quality transcriptomic data from 4822 single cells, including 2636 EB samples (683 day 4 EBs and 1953 day 8 EBs), 1491 Naïve-like H9 samples, and 695 Primed H9 samples. The scRNA-seq data had high read depth, which can map to 5000 genes for most of the single-cell samples (Fig. 1b and Additional file 1: Figure S1a); and Naïve-like H9 datasets show weak batch effect of Fluidigm C1 system (Additional file1: Figure S1b). The random dif-ferentiation of EBs causes the batch effect (Additional file 1: Figure S1c). We used Seurat to perform principal component analysis (PCA) and t-distributed stochastic neighbor embedding (t-SNE) analysis [43]. Seurat divided our samples into four main clusters, including two EB clusters (EB-ectodetm and EB-mesendoderm), one Primed H9 cluster, and one Naïve-like H9 cluster (Fig.1c). hPSCs (i.e. Naïve-like and Primed H9) have relative homogeneity. EB cells show significant heterogeneity, which indicated well spontaneous differentiation of hPSCs and provided a variety of samples for Monocle pseudotime analysis [44]. To reveal the gene expression dynamics and key regula-tors of hPSC early differentiation, we used Seurat and Monocle to analyze these data.
Mapping cellular landscape for early embryonic lineages
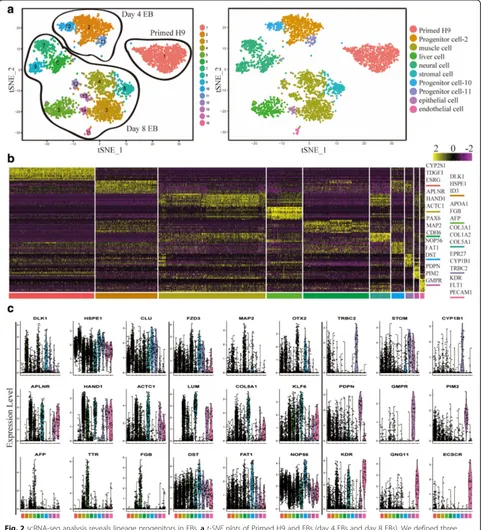
(Fig. 2aand b). Clusters 3, 4, 12, and 13 are associated with high expression of muscle progenitor cell markers such as HAND1, APLNR, and ACTC1 [45], and there-fore these clusters are annotated as muscle cells (Fig. 2).
Cluster 8 is annotated as stromal cells for the expression of LUM, KLF6, and COL5A1 [46]. Though muscle cell and stromal cell clusters exhibit shared gene expression profiles, collagen genes (e.g.COL3A1,COL5A1,COL5A2,
[image:4.595.58.539.89.619.2]COL1A1, andCOL1A2) are enriched in stromal cell clus-ter (Fig.2band c) [46]. Cluster 15 is annotated as endo-thelial cells for the high expression ofKDR,GNG11, and
ECSCR(Fig.2bandc) [47]. Clusters 6, 7, and 9 are anno-tated as neural cells for the high expression of OTX2,
PTN, andFZD3 (Fig.2band c), which are important for the development of neural system [48–50]. Cluster 14 is annotated as epithelial cells for the high expression of
PDPN,TFAP2C, andDMD[36,51]. Cluster 5 is annotated as liver cells for the high expression ofAFP,TTR, andFGB [52–54]. We also found specific surface markers to separ-ate these progenitor cells from EBs, such as CD34 and PROCR (CD201), which can enrich endothelial cells from EBs (Additional file1: Figure S2a and S2b). As a further validation, we found that genes specifically expressed in each cell type were enriched for the expected Gene Ontol-ogy (GO) terms (Additional file1: Figure S2c) [55]. For ex-ample, genes that are specifically expressed in muscle cell cluster are significantly enriched for skeletal system devel-opment (p =7.06E-07); specific genes of neural cell cluster are significantly enriched for positive regulation of neuro-blast proliferation (p = 1.86E-04) and neuronal stem cell population maintenance (p = 2.17E-04); specific genes of liver cell cluster are significantly enriched for very-low-density lipoprotein particle (p =4.29E-08) and lipoprotein metabolic process (p = 5.15E-08); specific genes of endo-thelial cell cluster are significantly enriched for angiogen-esis (p = 1.90E-12), positive regulation of endothelial cell proliferation (p =4.40E-05), and hemopoiesis (p =0.0045). These analyses strongly indicate that our cell-type assign-ments are accurate.
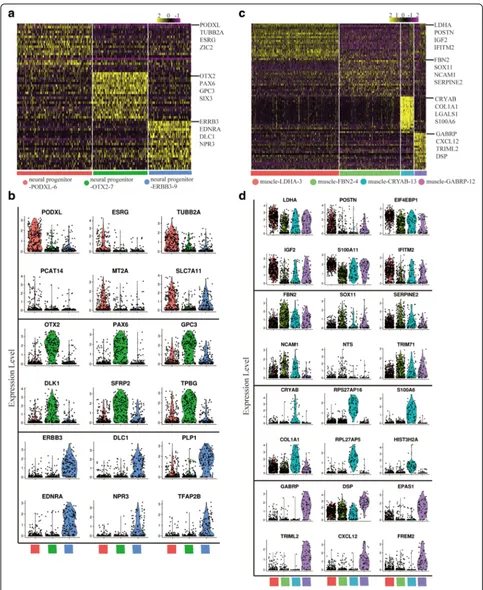
Both cluster neural cell and muscle cell consist of several sub-clusters. According to the specific gene ex-pression pattern, neural cell cluster was further divided into three subsets, including neural progenitor-PODXL-6, neural progenitor-OTX2–7, and neural progenitor-ERBB3– 9 (Fig.3aandband Additional file1: Figure S3a–d). Sub-clusters of neural cells are different types of cells. Neural progenitor-PODXL-6 may be related with cerebral cortex development, because of the enriched expression of
PODXL[56],DRAXIN[57,58], andTUBB2A[59]. Neural progenitor-OTX2–7 is enriched forRAX,SIX3, andOTX2, which are highly expressed in retinal-pigmented epithelium (RPE) [60]. Genes related with forebrain development are enriched in neural progenitor-OTX2–7 (Additional file 1: Figure S4a). RPE is derived from forebrain [61], so neural progenitor-OTX2–7 may be related with the RPE develop-ment. Neural progenitor-ERBB3–9 exhibits specific expres-sion of known neural crest (NC) cell markers (ERBB3,
SOX9, andEDNRA) [62–64]. So neural progenitor-ERBB3– 9 may be related with the NC cell development (Additional file1: Figure S4a).
Cluster muscle cell consists of four sub-clusters, includ-ing muscle-LDHA-3, muscle-FBN2–4,
muscle-CRYAB-13, and muscle-GABRP-12. These sub-clusters have spe-cific gene expression pattern and gene expression distribu-tion (Fig. 3c and dand Additional file 1: Figure S3e–h). Muscle-LDHA-3 is enriched for LDHA, POSTN, and
IGF2 [65]; muscle-FBN2–4 is enriched for FBN2,
NCAM1, and SERPINE2 [66]; muscle-CRYAB-13 is enriched for CRYAB, COL1A1, and LGALS1 [67, 68]; muscle-GABRP-12 is enriched for GABRP, CXCL12, and
TRIML2 [69]. Combined with the differentiation trajec-tory, we think these muscle sub-clusters were divided for both different cell types and different differentiation stages (Additional file 1: Figure S4c). Skeletal muscle cell differ-entiation related genes are enriched in muscle-FBN2–4 and muscle-CRYAB-13; angiogenesis related genes are enriched in muscle-GABRP-12; glycolytic process and insulin receptor signaling pathway related genes are enriched in muscle-LDHA-3 (Additional file 1: Figure S4b). The sub-clusters analysis indicated the diversity of differentiation direction in neural and muscle cell clusters.
Construction of hPSC early differentiation trajectory
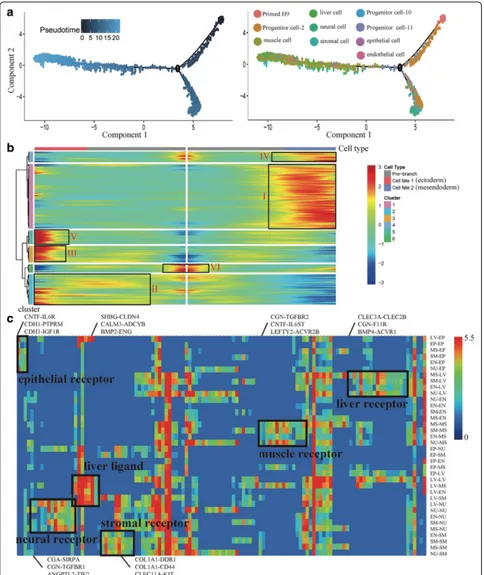
We used Monocle [44] to order single cells through EB differentiation and construct the whole lineage differen-tiation trajectory with a tree-like structure (Fig. 4a). We found two branches following EB differentiation, includ-ing an ectoderm branch and a mesendoderm (mesoderm and endoderm) branch. The ectoderm branch only con-sists of cells from neural cell cluster. The mesendoderm branch consists of cells from the muscle cell, endothelial cell, stromal cell, liver cell, and epithelial cell clusters. This differentiation trend is similar to the development in vivo that primed epiblasts develop into embryonic ectoderm and primitive streak (embryonic mesoderm and endoderm). It indicates that the differentiation tra-jectory of whole EBs can simulate the development in vivo. We used a specific heatmap to show the gene ex-pression dynamics of these two branches (Fig. 4b and Additional file1: Figure S5a). From pre-branch (Primed H9) to cell fate 1 (ectoderm), we found some gene clus-ters with specific expression pattern, including II (cluster 2), III (cluster 3), and V (cluster 5). We defined the genes cluster VI (cluster 6) and I (cluster 1), which are highly expressed in Primed H9 and cell fate 2 (mesendo-derm), respectively. We performed GO enrichment ana-lysis to reveal the different functions of these gene clusters (Additional file 1: Figure S5b). Nervous system development related GO terms are significantly enriched in cluster II, III, and V. In neural differentiation, cells get neural characteristics at the early stage of differentiation. Cluster I is related with kidney development, heart de-velopment, skeletal system dede-velopment, angiogenesis, and lung cell differentiation.
and paracrine signaling system, which can establish various interactions among different cell types [70]. Based on the expression of ligands or complementary receptors on every cell, we calculated the number of interactions among differ-ent cell types and showed potdiffer-ential cell-cell interactions in a network (Additional file1: Figure S6) [71]. These ligand-receptor pairings suggest extensive crosstalk among six types of progenitor cells (Fig. 4c). The one-to-many and many-to-one relationships exist between receptors and ligands. For example, liver cell receptorCLEC2Bcan bind ligandCLEC3Afrom muscle cells, stromal cells, endothelial cells, and neural cells; liver ligandSHBGcan bind to recep-torCLDN4on all types of cells, which indicate the import-ant roles of liver cells in the differentiation of other cell types. These ligand-receptor pairings may reveal the cell– cell interactions during the development in vivo.
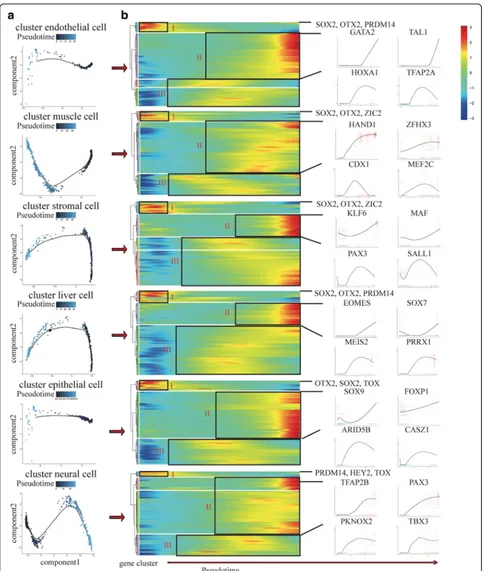
The whole lineage differentiation trajectory cannot re-veal the single-cell gene expression dynamics of each progenitor cell, so we constructed differentiation trajec-tory for each cell type with day 8 EBs (Fig. 5a). Tran-scription factors (TFs) play a key role in the regulation of development and differentiation. Based on the dy-namics of their expression patterns, the TFs associated with each differentiation trajectory were divided into three clusters (I, II, III) (Fig.5b). Cluster I TFs are highly expressed at the initial stage of differentiation. Primed H9, the common starting point of differentiation, highly express cluster I TFs (e.g. SOX2, PRDM14, and ZIC2) [72]. Cluster II TFs are highly expressed at the terminal stage of differentiation, so these TFs indicate the charac-teristics of each progenitor cell, including cluster endo-thelial cell (e.g. GATA2 and TAL1) [73], cluster muscle cell (e.g. HAND1and ZFHX3) [74], cluster stromal cell (e.g.KLF6andMAF) [75], cluster liver cell (e.g. EOMES and SOX7) [76], cluster epithelial cell (e.g. SOX9 and
FOXP1) [77], and cluster neural cell (e.g. PAX3 and
TFAP2B) [78]. Cluster I and II TFs indicate that the start points and end points of our differentiation trajectories are correct. Cluster III TFs are highly expressed at the middle stage of differentiation, including cluster endo-thelial cell (e.g. HOXA1 and TFAP2A), cluster muscle cell (e.g. CDX1 and MEF2C), cluster stromal cell (e.g.
PAX3 and SALL1), cluster liver cell (e.g. MEIS2 and
PRRX1), cluster epithelial cell (e.g.ARID5Band CASZ1), and cluster neural cell (e.g. PKNOX2and TBX3). These TFs are the candidate genes to control the differentiation of each progenitor cell. We also performed Kyoto Encyclopedia of Genes and Genomes (KEGG) enrich-ment analysis to reveal the major differential signaling pathways involved in the differentiation, including clus-ter endothelial cell (e.g. MAPK and Hippo), clusclus-ter muscle cell (e.g. Prolactin and Estrogen), cluster stromal cell (e.g. Wnt and Hippo), cluster liver cell (e.g. Prolactin and cGMP-PKG), cluster epithelial cell (e.g. Hippo and
AMPK), and cluster neural cell (e.g. Hippo and cGMP-PKG) (Additional file1: Figure S7). These differentiation trajectories show us the key TFs and signaling pathways that related to the differentiation process and may pro-vide epro-vidences for the optimization of the differentiation system in vitro.
Construction of naïve hPSC reset trajectory
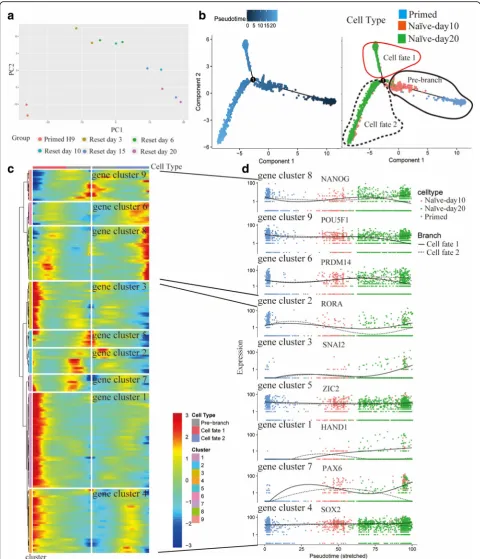
We reset Primed H9 into Naïve-like H9 by RSeT, a com-mercial medium based on NHSM formula [10]. Through bulk RNA-seq, we found the state of Naïve-like H9 was stable after 15–20 days domestication in RSeT media (Fig. 6a). We confirmed the naïve state via morphology, immunofluorescence of surface markers and pluripotent transcription factors, quantitative PCR (qPCR) of naïve and primed genes [79,80], and flow cytometry of surface markers [81] (Additional file1: Figure S8).
We performed pseudotime analysis to study cell state transition process (from day 0 to day 20) using scRNA-seq data (Fig.6b). Day 10 RSeT samples are at the inter-mediate state followed Primed H9. Day 20 RSeT samples are divided into two branches (cell fate 1 and cell fate 2). The RSeT culture process causes the heterogeneity of the Naïve-like H9. The expression pattern shows that only cell fate 2 branch directs to the naïve state with high expression of pluripotent TFs (e.g. POU5F1,
NANOG, and PRDM14) (Fig. 6c and d). Cell fate 1 branch directs to a differentiation state with gradual downregulation of pluripotent TFs (e.g. POU5F1 and
NANOG) and upregulation of lineage specifier genes (e. g. HAND1, SNAI2, and PAX6). Though these lineage specifier genes are upregulated at the middle stage in both branches, they are downregulated at the terminal stage of cell fate 2. The differential expression dynamics of lineage specifier genes may help us to understand the reset process.
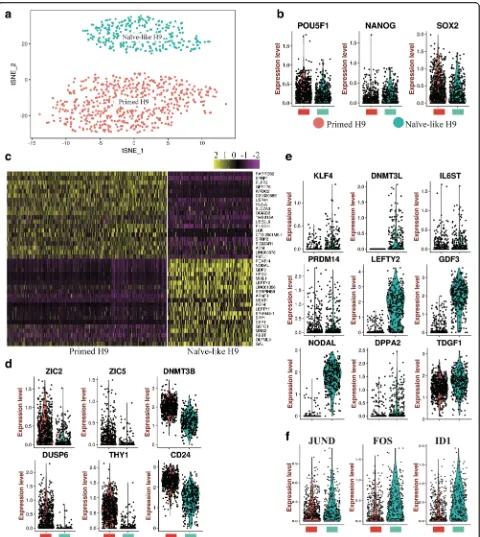
We extracted cell fate 2 branch as Naïve-like H9 to compare gene expression pattern between Naïve-like and Primed H9 at single-cell level (Fig. 7a). Though ex-pression distributions of pluripotent TFs (e.g. POU5F1,
NANOG, and SOX2) are similar (Fig. 7band Additional file 1: Figure S9a), there are significant differences in gene expression signatures between Naïve-like and Primed H9 (Fig. 7c). Primed genes (e.g. ZIC2, ZIC5,
DNMT3B, DUSP6, THY1, and CD24) are enriched in Primed H9 (Fig. 7d). NODAL, LEFTY2, GDF3, KLF4,
Fig. 5Differentiation trajectories of progenitor cells derived from hPSC.aDifferentiation trajectories of progenitor cells constructed by Monocle.
[image:9.595.57.540.85.656.2]file 1: Figure S9b). The surface markers of Primed H9 include CUZD1, KCNQ2, CLDN10, PODXL, etc.; the surface markers of Naïve-like H9 include CNTNAP2,
FZD5, etc.
We performed GO enrichment analysis and estab-lished GO term diagram of Naïve-like and Primed H9 (Additional file 1: Figure S9c). Primed H9 have high expression of major histocompatibility complex I related
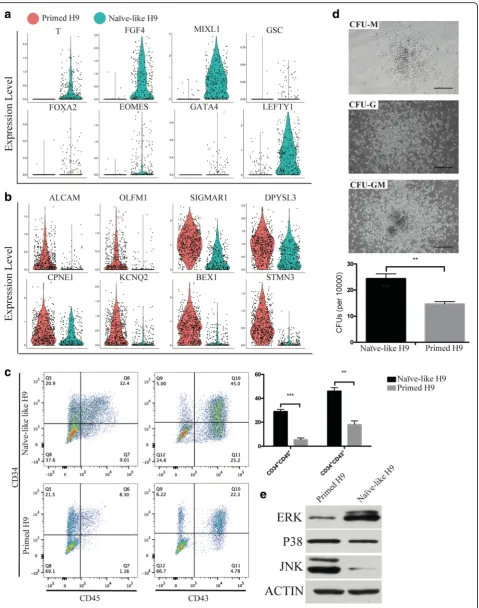
[image:11.595.59.539.86.623.2]genes as previously reported [72]. And genes related with nervous system (ectoderm) development are also enriched in Primed H9. In Naïve-like H9, genes related with gastrulation and endoderm development and MAPK signaling pathway are enriched. GO term diagram of Naïve-like H1 also shows MAPK signaling pathway enrichment (Additional file1: Figure S10 g). Interestingly, MAPK signaling pathway is also enriched in the differenti-ation trajectory of endothelial cell cluster, which derives from mesendoderm (Additional file 1: Figure S7). We checked the expression distribution of germ layer genes in both H9 and H1. Genes related with mesendoderm development (T,FGF4,MIXL,LEFTY1,EOMES, etc. [40]) are highly expressed in Naïve-like hPSCs (Fig. 8a and Additional file1: Figure S10e); genes related with nervous development (ALCAM[82],OLFM1[83],SIGMAR1[84], etc.) are highly expressed in Primed hPSCs (Fig. 8b and Additional file1: Figure S10d). We suspected that Naïve-like hPSCs have the differentiation bias to tissue cells re-lated with endothelial-hematopoietic lineages [85,86]. We used hematopoietic differentiation system to compare the differentiation ability between Naïve-like and Primed H9. The percentage of CD34+CD45+ cells and CD34+CD43+ cells are higher in Naïve-like H9, which generates more colony-forming units (CFUs) than Primed H9 as well (Fig. 8c and d). It suggests that Naïve-like H9 has better potency for hematopoietic differentiation. We checked the protein level of MAPK (p38, JNK, and ERK1/2) through western blot, and only the ERK1/2 is highly detected in Naïve-like H9 (Fig.8e), which is consistent with the single cell transcriptome analysis. The high expression of FOS (the substrates of MAPK-ERK1/2) [87] and ID1 (the downstream target of MAPK-ERK1/2) are also detected in Naïve-like H9 (Fig.7f) [88], which do not affect the pluri-potency of Naïve-like H9 (Fig.7band Additional file1: Fig-ure S8). FOS can induce the expression of hematopoietic genes [89]. Furthermore,ID1is a helix-loop-helix inhibitor and may promote the hematopoietic differentiation [90] like the helix-loop-helix inhibitor TAL1 does [91].
Discussion
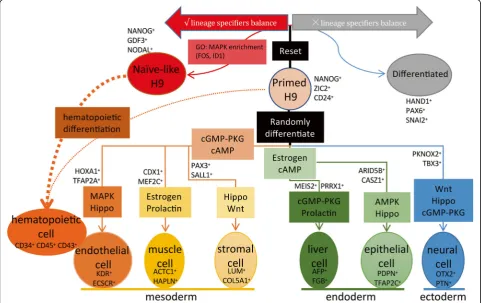
In this study, we performed the analysis of scRNA-seq data from a total of 4822 single cells generated from EBs and hPSCs (Fig. 9). Through constructing the early dif-ferentiation trajectories of various progenitors identified in EBs, we revealed the key TFs and signaling pathways that direct the differentiation of distinct cell types. Moreover, we constructed the cell–cell interaction net-work of these cell types and indicated the key roles of liver cells in the differentiation of other cell types. We further reprogramed Primed H9 into Naïve-like H9 to study the cellular-state transition process. We found that genes related with MAPK-ERK1/2 signaling pathway are enriched in endothelial-hematopoietic development and
Naïve-like H9. Functionally, Naïve-like H9 show higher potency for differentiation into the hematopoietic line-ages. These results provide valuable information for the optimization of differentiation protocols.
The scRNA-seq platform we used is Fluidigm C1 sys-tem with the HT IFCs [26]. The old version of IFCs can only capture 96 cells at most [40, 92], so cell sorting or other enrichment strategies are usually performed before scRNA-seq for the recovery of rare cell types. However, HT IFCs can efficiently analyze thousands of single cells without prior enrichment from heterogeneous systems such as EB differentiation (Fig.2a).
In contrast to monolayer differentiation, EB differenti-ation system provides 3D structure to establish complex cell adhesions and paracrine signaling, which promote the differentiation and morphogenesis similar to the na-tive tissue development [70]. The interactions between different cell types are important for the development and differentiation. Liver is the essential site for the early hematopoietic development in the embryo stage [85]. Cardiomyocytes and endothelial cell were reported im-portant for the differentiation of liver in EB differenti-ation [21]. We used the random EB differentidifferenti-ation system to generate various tissue cells of three germ lin-eages for our hPSC early differentiation trajectory con-struction (Fig. 9). We found complex interactions among different cell types (Fig.4cand Additional file 1: Figure S6). Interestingly, liver cells build specific interac-tions with other cell types using specific ligands and re-ceptors in EBs. The functions of these interactions should be verified in further studies. It may indicate the important role of liver cells in the differentiation of other cell types.
Differentiation bias of different hPSCs might be har-nessed for better lineage differentiation protocols. Here, we found better potency of hematopoietic differentiation in Naïve-like H9. MAPK-ERK1/2 related genes are highly expressed in Naïve-like H9 but not in Primed H9 (Fig. 7f and Fig. 8e and Additional file 1: Figure S9c). We therefore suspect that MAPK-ERK1/2 contributes to the hematopoietic differentiation bias of Naïve-like H9 (Fig. 9). Though LIF is the key cytokine to keep the “naïve” state of hPSCs [10], it can also activate the MAPK-ERK1/2 signaling pathway [94], which is involved in the differentiation of hPSCs towards endothelial lineages (Additional file1: Figure S7), and hematopoietic development [87]. The commercial naïve medium RSeT contain the MAPK-ERK1/2 inhibitor (such as PD0325901 [10]). The inhibitor may lead to perturbation of MAPK-ERK1/2 pathway. When the inhibitor is removed and
differentiation media are added, hemogenic fate is en-hanced for Naïve-like hPSC culture.
Conclusion
In this study, we used scRNA-seq to map the early differentiation of hPSCs. We identified various lineage-specific progenitor cells and constructed the differenti-ation trajectories by pseudotime analysis. The gene expression dynamics offer new insights into molecular pathways of early embryonic lineages that can be har-nessed for optimization of differentiation protocols.
Methods
Cell culture and differentiation
H9 and H1 human ES cells were maintained in mTeSR™1 media (STEMCELL Technologies) on tissue culture plates coated with Matrigel (BD Bioscience) routinely [95]. H9
(See figure on previous page.)
Fig. 8Hematopoietic differentiation bias of Naïve-like H9.a,bViolin plotsshow the expression level distributions of mesendoderm genes (T, FGF4,MIXL,GSC,FOXA2,EOMES,GATA4, andLEFTY1) (a) and neural genes (ALCAM,OLFM1,SIGMAR1, DPYSL3,CPNE1,KCNQ2,BEX1, andSTMN3) (b).
cFlow cytometry analysis of hematopoietic progenitors derived from hPSCs. Significant difference was assessed by the t-test. ***p< 0.001, **p< 0.01, *p< 0.05.dThe morphology and number of hematopoietic CFUs. Scale bars = 100μm.eWestern blot analysis of MAPK (ERK1/2, JNK, and P38) in naïve and primed H9
[image:14.595.57.540.392.695.2]and H1 were reset into a naïve-like state by RSeT™media (STEMCELL Technologies) following the instruction [81, 96]. We generated EBs by clone suspension. EBs were dif-ferentiated in DMEM/F12 (GIBCO) supplemented with 20% FBS (GIBCO), 50 U/mL penicillin/streptomycin (GIBCO), 2 mM L-Glutamine (GIBCO), 1 × non-essential amino acids, and 100 μM ß-mercaptoethanol (Sigma). In brief, H9 was digested using 0.5 mg/mL Dispase (Invitro-gen) for 30 min. Then cell clumps suspended in differenti-ation media were seeded into an Ultra-Low attachment 6 well plate (Corning). After four days or eight days of cul-ture, EBs were harvested and digested into single-cell sus-pension in 3 × 10⁵cells/mL using TrypLE (GIBCO). We did not use cell sorting or other enrichment strategies before single-cell capture. The hematopoietic differentiation of hPSCs was performed using STEMdiff Hematopoietic Kit (STEMCELL Technologies) following the instructions. At day 12, cells were analyzed with flow cytometry. CD34+ cells were enriched with EasySep™CD34 positive selection kit (StemCell Technologies) for CFU assays.
Colony-forming unit (CFU) assays
CFU assays were performed with MethoCult™ H4034 Optimum methylcellulose-based media (StemCell Tech-nologies) following manufacturer’s instructions. In brief, 3 mL MethoCult™ media with 1 × 10⁴/mL CD34+ cells and penicillin-streptomycin were added into each 35 mm low adherent plastic dish. Colonies were counted and identified after 10–14 days of incubation.
Flow cytometry analysis of cell phenotype
Cells suspended in 100 μL of PBS were incubated with antibodies at 4 °C for 30 min. The samples were mea-sured on BD Fortessa and analyzed by FlowJo software (Tree Star). Antibodies used in our study were listed: anti-Human CD34 (BioLegend, Pacific Blue, clone 581), anti-human CD34 (BioLegend, PE, clone 581), anti-human CD201 (BioLegend, APC, clone RCR-401), anti-Human CD43 (BioLegend, APC, clone 10G7), anti-Human CD45 (BioLegend, FITC, clone HI30), anti-Human CD90 (BD Pharmingen, APC, clone 5E10), and CD24 (BioLegend, PE, clone ML5).
Immunofluorescence staining and confocal image analysis
Cells were seeded into glass-bottom culture dishes (NEST, 35/15 mm) coated with Matrigel. Cultured cells were fixed in 4% paraformaldehyde at room temperature for 30 min. Then permeabilized treatment was per-formed at room temperature for 30 min with PBS + 0.2% TritonX-100. Cells were blocked with PBS + 1% BSA + 4% FBS + 0.4% TritonX-100 at room temperature for 1 h. Then cells were incubated with primary antibodies, diluted in PBS + 0.2% BSA + 0.1% TritonX-100, at 4 °C
overnight. Cells were incubated with AlexaFluor second-ary antibodies (Invitrogen) for 1 h at room temperature. Then cells were incubated with DAPI for 5 min at room temperature. After the second round of fixation, cells were ready for imaging. Olympus IX81-FV1000 was used to collect immunofluorescence images and FV10-ASW 2.1 Viewer was used to process images. The primary antibodies used in our study were listed in Additional file2: Table S1.
Western blot analysis
Whole-cell protein were isolated from Primed H9 and Naïve-like H9. Protein samples were incubated with the fol-lowing primary antibodies in 5%BSA: anti-ERK (Servicebio, Wuhan, China, GB13003–1), anti-JNK (Epitomics, 3496-s), anti-P38 (ABCAM, ab31828), and anti-β-actin (Servicebio, Wuhan, China, GB13001–1). Secondary antibodies were HRP-linked goat anti-mouse, goat anti-rabbit (Servicebio, Wuhan, China, GB23303). Blots were developed using ECL (Servicebio, Wuhan, China, G2014). The primary anti-bodies used in our study were listed in Additional file 2: Table S1.
Reverse transcription (RT) and qPCR analysis
Total RNA prepared with EasyPure RNA Kit (Transgen) was reverse transcribed into complementary DNA (cDNA) by TransScript All-in-One First-Strand cDNA Synthesis SuperMix for qPCR kit (Transgen). The di-luted cDNA was used as temples in qPCR (ChamQ SYBR qPCR Master Mix-Q311 (Vazyme)). The qPCR platform we used was LightCycler 480 (Roche) and data were analyzed by the ΔΔCt method. The primers used in our study were listed in Additional file 3: Table S2, including the reference gene (ACTB).
Single-cell capture and scRNA-seq library preparation
Bulk RNA-seq library construction
We used mRNA Capture Beads (VAHTS mRNA-seq v2 Library Prep Kit for Illumina, Vazyme) to extract mRNA from total RNA. PrimeScript™ Double Strand cDNA Synthesis Kit (TaKaRa) was used to synthesize double-stranded cDNA from purified polyadenylated mRNA templates. We used TruePrep DNA Library Prep Kit V2 for Illumina (TaKaRa) to prepare cDNA libraries for Illu-mina sequencing.
Sequencing data analysis
The sequenced reads were mapped against the reference GRCh38 using STAR v2.5.2a [97]. scRNA-seq expression data, quantified by counts via featureCounts v1.5.1 [98], were analyzed with Seurat v2.0.1 (PCA, Cluster, t-SNE and cluster) [43]. In brief, the Seurat object was gener-ated from digital gene expression matrices. The param-eter of “Filtercells” is nGene (2000 to 8800) and transcripts (-Inf to 6e + 05). In the standard pre-processing workflow of Seurat, we selected 8706 variable genes for following PCA. Then we performed cell cluster and t-SNE. Fifteen principal components were used in cell cluster with the resolution parameter set at 1.5. Marker genes of each cell cluster were outputted for GO and KEGG analysis, which were used to define the cell types. Cell clusters were annotated with the information of cell types and germ layers. Digital gene expression matrices with annotations from Seurat were analyzed by Monocle v2.3.6 (pseudotime analysis) [44]. TFs from AnimalTFDB [99] and surface genes [100] were used to filter the gene lists. The cell–cell interactions were con-structed by igraph v1.12 as previously reported [71]. The count of cell–cell interactions was based on the ligands-receptors pairings [101]. We used DAVID [55] to per-form GO and KEGG analysis. GO terms were visualized by REVIGO [102] and Cytoscape [103]. Bulk RNA-seq data, quantified by FPKM via RSEM v0.4.6 [104], were analyzed with DEseq2 v1.14.1 [105].
Additional files
Additional file 1:Figure S1.Quality control of the dataset.Figure S2.
Surface marker analysis and GO enrichment analysis of lineage progenitors.Figure S3.FeaturePlot of specific genes from neural and muscle sub-clusters.Figure S4.Differentiation trajectories and GO ana-lysis of neural and muscle sub-clusters.Figure S5.GO analysis and expression dynamics of gene clusters I–VI.Figure S6.Network of potential cell–cell interactions in EBs.Figure S7.Signaling pathways involved in differentiation of various progenitor cells.Figure S8.The identification of Naïve-like H9.Figure S9.Surface marker analysis and GO analysis of Primed and Naïve-like H9.Figure S10.The identification and GO analysis of Primed and Naïve-like H1 (Additional file11: Table S10, Additional file12: Table S11, Additional file13: Table S12, Additional file
14: Table S13, Additional file15: Table S14). (DOCX 19207 kb)
Additional file 2:Table S1.Immunofluorescence antibody. (XLSX 33 kb) Additional file 3:Table S2.qPCR primer. (XLSX 47 kb)
Additional file 4:Table S3.List of genes used in Fig.2bfor heatmap. (XLSX 468 kb)
Additional file 5:Table S4.List of genes used in Fig.3aandcfor heatmap. (XLSX 99 kb)
Additional file 6:Table S5.List of genes used in Fig.4bfor heatmap. (XLSX 38 kb)
Additional file 7:Table S6.List of ligand-receptor pairs and cell–cell pairs used in Fig.4cfor heatmap. (XLSX 12 kb)
Additional file 8:Table S7.List of genes used in Fig.5bfor heatmaps. (XLSX 43 kb)
Additional file 9:Table S8.List of genes used in Fig.6cfor heatmap. (XLSX 12 kb)
Additional file 10:Table S9.List of genes used in Fig.7cfor heatmap. (XLSX 44 kb)
Additional file 11:Table S10.List of GO terms used in Additional file1: Figure S2. (XLSX 64 kb)
Additional file 12:Table S11.List of GO terms used in Additional file1: Figure S4. (XLSX 73 kb)
Additional file 13:Table S12.List of GO terms used in Additional file1: Figure S5. (XLSX 56 kb)
Additional file 14:Table S13.List of signaling pathways used in Additional file1: Figure S7a. (XLSX 20 kb)
Additional file 15:Table S14.List of GO terms used in Additional file1: Figure S9. (XLSX 22 kb)
Acknowledgements
We thank Junfeng Ji at Zhejiang University School of Medicine for his assistance in this study. We thank Mengmeng Jiang for critical reading of this manuscript. We thank Huiyu Sun and Yang Xu for their assistance in RNA-seq data analysis. We thank G-BIO, Annoroad, VeritasGenetics, and Novogene for deep sequencing experiments, LongGene for supplying Gradi-ent Thermal Cycler and Vazyme for supplying customized enzymes for the study.
Funding
This work was supported by grants from National Natural Science Foundation of China (31722027, 81770188, and 31701290), Fundamental Research Funds for the Central Universities (2016XZZX002–04), Zhejiang Provincial Natural Science Foundation of China (R17H080001), National Key Program on Stem Cell and Translational Research (2017YFA0103401) and 973 Program (2015CB964900).
Availability of data and materials
The RNA-seq data used in our study have been deposited in NCBI’s Gene Expression Omnibus and are accessible through GEO accession number GSE107552 [106].
Authors’contributions
XH and HC designed and conducted experiments, including EB and hematopoietic differentiation. HH provided the guide to hematopoietic differentiation. HC, DH, HC, LF, and CC analyzed data and performed statistical analysis. GG and GY designed and supervised the study and wrote the manuscript. All authors read and approved the final manuscript.
Ethics approval and consent to participate
Not applicable.
Consent for publication
Not applicable.
Competing interests
The authors declare that they have no competing interests.
Publisher’s Note
Author details
1Center for Stem Cell and Regenerative Medicine, Zhejiang University School
of Medicine, Hangzhou 310058, China.2Institute of Hematology, The 1st
Affiliated Hospital, Zhejiang University School of Medicine, Hangzhou 310003, China.3Dr. Li Dak Sum & Yip Yio Chin Center for Stem Cell and Regenerative
Medicine, Zhejiang Provincial Key Lab for Tissue Engineering and Regenerative Medicine, Hangzhou 310058, China.4Department of
Biostatistics and Computational Biology, Dana-Farber Cancer Institute, Harvard Chan School of Public Health, Boston, MA 02115, USA.5College of
Animal Science, Zhejiang University, Hangzhou 310058, China.6Department
of Computer Science and Technology, Tongji University, Shanghai 201804, China.7College of Life Sciences, Zhejiang University, Hangzhou 310058, China.8Stem Cell Institute, Zhejiang University, Hangzhou 310058, China.
Received: 29 November 2017 Accepted: 21 March 2018
References
1. Thomson JA, Itskovitz-Eldor J, Shapiro SS, Waknitz MA, Swiergiel JJ, Marshall VS, et al. Embryonic stem cell lines derived from human blastocysts. Science. 1998;282:1145–7.
2. Tabar V, Studer L. Pluripotent stem cells in regenerative medicine: challenges and recent progress. Nat Rev Genet. 2014;15:82–92.https://doi.org/10.1038/nrg3563
3. Vodyanik MA, Bork JA, Thomson JA, Slukvin II. Human embryonic stem cell-derived CD34+ cells: efficient production in the coculture with OP9 stromal cells and analysis of lymphohematopoietic potential. Blood. 2005;105:617– 26.https://doi.org/10.1182/blood-2004-04-1649
4. Doulatov S, Vo LT, Chou SS, Kim PG, Arora N, Li H, et al. Induction of multipotential hematopoietic progenitors from human pluripotent stem cells via respecification of lineage-restricted precursors. Cell Stem Cell. 2013; 13:459–470.https://doi.org/10.1016/j.stem.2013.09.002.
5. Kroon E, Martinson LA, Kadoya K, Bang AG, Kelly OG, Eliazer S, et al. Pancreatic endoderm derived from human embryonic stem cells generates glucose-responsive insulin-secreting cells in vivo. Nat Biotechnol. 2008;26: 443–452.https://doi.org/10.1038/nbt1393.
6. Chambers SM, Fasano CA, Papapetrou EP, Tomishima M, Sadelain M, Studer L. Highly efficient neural conversion of human ES and iPS cells by dual inhibition of SMAD signaling. Nat Biotechnol. 2009;27:275–80.https://doi. org/10.1038/nbt.1529
7. Kriks S, Shim JW, Piao J, Ganat YM, Wakeman DR, Xie Z, et al. Dopamine neurons derived from human ES cells efficiently engraft in animal models of Parkinson’s disease. Nature. 2011;480:547–551.https://doi.org/10.1038/ nature10648.
8. Nichols J, Smith A. Pluripotency in the embryo and in culture. Cold Spring Harb Perspect Biol. 2012;4:a008128.https://doi.org/10.1101/cshperspect.a008128
9. Nichols J, Smith A. Naive and primed pluripotent states. Cell Stem Cell. 2009;4:487–92.https://doi.org/10.1016/j.stem.2009.05.015
10. Gafni O, Weinberger L, Mansour AA, Manor YS, Chomsky E, Ben-Yosef D, et al. Derivation of novel human ground state naive pluripotent stem cells. Nature. 2013;504:282–286.https://doi.org/10.1038/nature12745.
11. Theunissen TW, Friedli M, He Y, Planet E, O’Neil RC, Markoulaki S, et al. Molecular Criteria for Defining the Naive Human Pluripotent State. Cell Stem Cell. 2016;19:502–515.https://doi.org/10.1016/j.stem.2016.06.011. 12. Theunissen TW, Powell BE, Wang H, Mitalipova M, Faddah DA, Reddy J,
et al. Systematic identification of culture conditions for induction and maintenance of naive human pluripotency. Cell Stem Cell. 2014;15:471–487.
https://doi.org/10.1016/j.stem.2014.07.002.
13. Ware CB, Nelson AM, Mecham B, Hesson J, Zhou W, Jonlin EC, et al. Derivation of naive human embryonic stem cells. Proc Natl Acad Sci U S A. 2014;111:4484–4489.https://doi.org/10.1073/pnas.1319738111.
14. Yang Y, Liu B, Xu J, Wang J, Wu J, Shi C, et al. Derivation of pluripotent stem cells with in vivo embryonic and extraembryonic potency. Cell. 2017;169: 243–257.e225.https://doi.org/10.1016/j.cell.2017.02.005.
15. Zimmerlin L, Park TS, Huo JS, Verma K, Pather SR, Talbot CC Jr, et al. Tankyrase inhibition promotes a stable human naive pluripotent state with improved functionality. Development. 2016;143:4368–4380.https://doi.org/ 10.1242/dev.138982.
16. Liu X, Nefzger CM, Rossello FJ, Chen J, Knaupp AS, Firas J, et al. Comprehensive characterization of distinct states of human naive pluripotency generated by reprogramming. Nat Methods. 2017;14(11):1055– 1106.https://doi.org/10.1038/nmeth.4436.
17. Itskovitz-Eldor J, Schuldiner M, Karsenti D, Eden A, Yanuka O, Amit M, et al. Differentiation of human embryonic stem cells into embryoid bodies compromising the three embryonic germ layers. Mol Med. 2000;6:88–95. 18. Boxman J, Sagy N, Achanta S, Vadigepalli R, Nachman I. Integrated live
imaging and molecular profiling of embryoid bodies reveals a synchronized progression of early differentiation. Sci Rep. 2016;6:31623.https://doi.org/10. 1038/srep31623
19. Magli A, Schnettler E, Swanson SA, Borges L, Hoffman K, Stewart R, et al. Pax3 and Tbx5 specify whether PDGFRalpha+ cells assume skeletal or cardiac muscle fate in differentiating embryonic stem cells. Stem Cells. 2014; 32:2072–2083.https://doi.org/10.1002/stem.1713.
20. Fehling HJ, Lacaud G, Kubo A, Kennedy M, Robertson S, Keller G, et al. Tracking mesoderm induction and its specification to the hemangioblast during embryonic stem cell differentiation. Development. 2003;130:4217–27. 21. Ogawa S, Tagawa Y, Kamiyoshi A, Suzuki A, Nakayama J, Hashikura Y, et al.
Crucial roles of mesodermal cell lineages in a murine embryonic stem cell-derived in vitro liver organogenesis system. Stem Cells. 2005;23:903–13.
https://doi.org/10.1634/stemcells.2004-0295
22. Lee MS, Jun DH, Hwang CI, Park SS, Kang JJ, Park HS, et al. Selection of neural differentiation-specific genes by comparing profiles of random differentiation. Stem Cells. 2006;24:1946–1955.https://doi.org/10.1634/ stemcells.2005-0325.
23. Tang F, Barbacioru C, Wang Y, Nordman E, Lee C, Xu N, et al. mRNA-Seq whole-transcriptome analysis of a single cell. Nat Methods. 2009;6:377–382.
https://doi.org/10.1038/nmeth.1315.
24. Haque A, Engel J, Teichmann SA, Lonnberg T. A practical guide to single-cell RNA-sequencing for biomedical research and clinical applications. Genome Med. 2017;9:75.https://doi.org/10.1186/s13073-017-0467-4
25. Kolodziejczyk AA, Kim JK, Svensson V, Marioni JC, Teichmann SA. The technology and biology of single-cell RNA sequencing. Mol Cell. 2015;58: 610–20.https://doi.org/10.1016/j.molcel.2015.04.005
26. Pollen AA, Nowakowski TJ, Shuga J, Wang X, Leyrat AA, Lui JH, et al. Low-coverage single-cell mRNA sequencing reveals cellular heterogeneity and activated signaling pathways in developing cerebral cortex. Nat Biotechnol. 2014;32:1053–1058.https://doi.org/10.1038/nbt.2967.
27. Picelli S, Bjorklund AK, Faridani OR, Sagasser S, Winberg G, Sandberg R. Smart-seq2 for sensitive full-length transcriptome profiling in single cells. Nat Methods. 2013;10:1096–8.https://doi.org/10.1038/nmeth.2639
28. Hashimshony T, Wagner F, Sher N, Yanai I. CEL-Seq: single-cell RNA-Seq by multiplexed linear amplification. Cell Rep. 2012;2:666–73.https://doi.org/10. 1016/j.celrep.2012.08.003
29. Macosko EZ, Basu A, Satija R, Nemesh J, Shekhar K, Goldman M, et al. Highly parallel genome-wide expression profiling of individual cells using nanoliter droplets. Cell. 2015;161:1202–1214.https://doi.org/10. 1016/j.cell.2015.05.002.
30. Klein AM, Mazutis L, Akartuna I, Tallapragada N, Veres A, Li V, et al. Droplet barcoding for single-cell transcriptomics applied to embryonic stem cells. Cell. 2015;161:1187–1201.https://doi.org/10.1016/j.cell.2015.04.044. 31. Zheng GX, Terry JM, Belgrader P, Ryvkin P, Bent ZW, Wilson R, et al.
Massively parallel digital transcriptional profiling of single cells. Nat Commun. 2017;8:14049.https://doi.org/10.1038/ncomms14049. 32. Ramskold D, Luo S, Wang YC, Li R, Deng Q, Faridani OR, et al. Full-length
mRNA-Seq from single-cell levels of RNA and individual circulating tumor cells. Nat Biotechnol. 2012;30:777–782.https://doi.org/10.1038/nbt.2282. 33. Chung W, Eum HH, Lee HO, Lee KM, Lee HB, Kim KT, et al. Single-cell RNA-seq
enables comprehensive tumour and immune cell profiling in primary breast cancer. Nat Commun. 2017;8:15081.https://doi.org/10.1038/ncomms15081. 34. Papalexi E, Satija R. Single-cell RNA sequencing to explore immune cell
heterogeneity. Nat Rev Immunol. 2018;18:35–45.https://doi.org/10.1038/nri. 2017.76
35. Bjorklund AK, Forkel M, Picelli S, Konya V, Theorell J, Friberg D, et al. The heterogeneity of human CD127(+) innate lymphoid cells revealed by single-cell RNA sequencing. Nat Immunol. 2016;17:451–460.https://doi.org/10. 1038/ni.3368.
36. Treutlein B, Brownfield DG, Wu AR, Neff NF, Mantalas GL, Espinoza FH, et al. Reconstructing lineage hierarchies of the distal lung epithelium using single-cell RNA-seq. Nature. 2014;509:371–375.https://doi.org/10.1038/ nature13173.
38. Petropoulos S, Edsgard D, Reinius B, Deng Q, Panula SP, Codeluppi S, et al. Single-cell RNA-seq reveals lineage and X chromosome dynamics in human preimplantation embryos. Cell. 2016;165:1012–1026.https://doi.org/10.1016/ j.cell.2016.03.023.
39. Blakeley P, Fogarty NM, del Valle I, Wamaitha SE, Hu TX, Elder K, et al. Defining the three cell lineages of the human blastocyst by single-cell RNA-seq. Development. 2015;142:3151–3165.https://doi.org/10.1242/dev.123547. 40. Chu LF, Leng N, Zhang J, Hou Z, Mamott D, Vereide DT, et al. Single-cell
RNA-seq reveals novel regulators of human embryonic stem cell differentiation to definitive endoderm. Genome Biol. 2016;17:173.https:// doi.org/10.1186/s13059-016-1033-x.
41. Semrau S, Goldmann JE, Soumillon M, Mikkelsen TS, Jaenisch R, van Oudenaarden A. Dynamics of lineage commitment revealed by single-cell transcriptomics of differentiating embryonic stem cells. Nat Commun. 2017; 8:1096.https://doi.org/10.1038/s41467-017-01076-4
42. Han X, Yu H, Huang D, Xu Y, Saadatpour A, Li X, et al. A molecular roadmap for induced multi-lineage trans-differentiation of fibroblasts by chemical combinations. Cell Res. 2017;27:842.https://doi.org/10.1038/cr.2017.77. 43. Satija R, Farrell JA, Gennert D, Schier AF, Regev A. Spatial reconstruction of
single-cell gene expression data. Nat Biotechnol. 2015;33:495–502.https:// doi.org/10.1038/nbt.3192
44. Trapnell C, Cacchiarelli D, Grimsby J, Pokharel P, Li S, Morse M, et al. The dynamics and regulators of cell fate decisions are revealed by
pseudotemporal ordering of single cells. Nat Biotechnol. 2014;32:381–386.
https://doi.org/10.1038/nbt.2859.
45. Boutilier JK, Taylor RL, Ram R, McNamara E, Nguyen Q, Goullee H, et al. Variable cardiac alpha-actin (Actc1) expression in early adult skeletal muscle correlates with promoter methylation. Biochim Biophys Acta. 2017;1860: 1025–1036.https://doi.org/10.1016/j.bbagrm.2017.08.004.
46. Despars G, Periasamy P, Tan J, Abbey J, O’Neill TJ, O’Neill HC. Gene signature of stromal cells which support dendritic cell development. Stem Cells Dev. 2008;17:917–27.https://doi.org/10.1089/scd.2007.0170
47. Kilari S, Remadevi I, Zhao B, Pan J, Miao R, Ramchandran R, et al. Endothelial cell-specific chemotaxis receptor (ECSCR) enhances vascular endothelial growth factor (VEGF) receptor-2/kinase insert domain receptor (KDR) activation and promotes proteolysis of internalized KDR. J Biol Chem. 2013; 288:10265–10274.https://doi.org/10.1074/jbc.M112.413542.
48. Kimura C, Takeda N, Suzuki M, Oshimura M, Aizawa S, Matsuo I. Cis-acting elements conserved between mouse and pufferfish Otx2 genes govern the expression in mesencephalic neural crest cells.
Development. 1997;124:3929–41.
49. Silos-Santiago I, Yeh HJ, Gurrieri MA, Guillerman RP, Li YS, Wolf J, et al. Localization of pleiotrophin and its mRNA in subpopulations of neurons and their corresponding axonal tracts suggests important roles in neural-glial interactions during development and in maturity. J Neurobiol. 1996;31:283–296.
50. Qu Y, Huang Y, Feng J, Alvarez-Bolado G, Grove EA, Yang Y, et al. Genetic evidence that Celsr3 and Celsr2, together with Fzd3, regulate forebrain wiring in a Vangl-independent manner. Proc Natl Acad Sci U S A. 2014;111: E2996–E3004.https://doi.org/10.1073/pnas.1402105111.
51. Cyr AR, Kulak MV, Park JM, Bogachek MV, Spanheimer PM, Woodfield GW, et al. TFAP2C governs the luminal epithelial phenotype in mammary development and carcinogenesis. Oncogene. 2015;34:436–444.https://doi. org/10.1038/onc.2013.569.
52. Mirkovitch J, Darnell JE Jr. Rapid in vivo footprinting technique identifies proteins bound to the TTR gene in the mouse liver. Genes Dev. 1991;5:83–93. 53. Lee CS, Friedman JR, Fulmer JT, Kaestner KH. The initiation of liver
development is dependent on Foxa transcription factors. Nature. 2005;435: 944–7.https://doi.org/10.1038/nature03649
54. Fish RJ, Vorjohann S, Bena F, Fort A, Neerman-Arbez M. Developmental expression and organisation of fibrinogen genes in the zebrafish. Thromb Haemost. 2012;107:158–66.https://doi.org/10.1160/TH11-04-0221
55. Huang da W, Sherman BT, Lempicki RA. Systematic and integrative analysis of large gene lists using DAVID bioinformatics resources. Nat Protoc. 2009;4: 44–57.https://doi.org/10.1038/nprot.2008.211
56. Vitureira N, McNagny K, Soriano E, Burgaya F. Pattern of expression of the podocalyxin gene in the mouse brain during development. Gene Expr Patterns. 2005;5:349–54.https://doi.org/10.1016/j.modgep.2004.10.002
57. Islam SM, Shinmyo Y, Okafuji T, Su Y, Naser IB, Ahmed G, et al. Draxin, a repulsive guidance protein for spinal cord and forebrain commissures. Science. 2009;323:388–393.https://doi.org/10.1126/science.1165187.
58. Shinmyo Y, Asrafuzzaman Riyadh M, Ahmed G, Bin Naser I, Hossain M, Takebayashi H, et al. Draxin from neocortical neurons controls the guidance of thalamocortical projections into the neocortex. Nat Commun. 2015;6: 10232.https://doi.org/10.1038/ncomms10232.
59. Cushion TD, Paciorkowski AR, Pilz DT, Mullins JG, Seltzer LE, Marion RW, et al. De novo mutations in the beta-tubulin gene TUBB2A cause simplified gyral patterning and infantile-onset epilepsy. Am J Hum Genet. 2014;94: 634–641.https://doi.org/10.1016/j.ajhg.2014.03.009.
60. Li P, Sun X, Ma Z, Liu Y, Jin Y, Ge R, et al. Transcriptional reactivation of OTX2, RX1 and SIX3 during reprogramming contributes to the generation of RPE cells from human iPSCs. Int J Biol Sci. 2016;12:505–517.https://doi. org/10.7150/ijbs.14212.
61. Murisier F, Guichard S, Beermann F. Distinct distal regulatory elements control tyrosinase expression in melanocytes and the retinal pigment epithelium. Dev Biol. 2007;303:838–47.https://doi.org/10.1016/j.ydbio.2006.11.038
62. Abe M, Ruest LB, Clouthier DE. Fate of cranial neural crest cells during craniofacial development in endothelin-A receptor-deficient mice. Int J Dev Biol. 2007;51:97–105.https://doi.org/10.1387/ijdb.062237ma
63. Prasad MK, Reed X, Gorkin DU, Cronin JC, McAdow AR, Chain K, et al. SOX10 directly modulates ERBB3 transcription via an intronic neural crest enhancer. BMC Dev Biol. 2011;11:40.https://doi.org/10.1186/1471-213X-11-40. 64. Simoes-Costa M, Bronner ME. Establishing neural crest identity: a gene
regulatory recipe. Development. 2015;142:242–57.https://doi.org/10.1242/ dev.105445
65. Alzhanov DT, McInerney SF, Rotwein P. Long range interactions regulate Igf2 gene transcription during skeletal muscle differentiation. J Biol Chem. 2010;285:38969–77.https://doi.org/10.1074/jbc.M110.160986
66. Chern SR, Li SH, Lu CH, Chen EI. Spatiotemporal expression of the serine protease inhibitor, SERPINE2, in the mouse placenta and uterus during the estrous cycle, pregnancy, and lactation. Reprod Biol Endocrinol. 2010;8:127.
https://doi.org/10.1186/1477-7827-8-127
67. Chan J, O’Donoghue K, Gavina M, Torrente Y, Kennea N, Mehmet H, et al. Galectin-1 induces skeletal muscle differentiation in human fetal mesenchymal stem cells and increases muscle regeneration. Stem Cells. 2006;24:1879–1891.https://doi.org/10.1634/stemcells.2005-0564. 68. Wojtowicz I, Jablonska J, Zmojdzian M, Taghli-Lamallem O, Renaud Y,
Junion G, et al. Drosophila small heat shock protein CryAB ensures structural integrity of developing muscles, and proper muscle and heart performance. Development. 2015;142:994–1005.https://doi.org/10.1242/ dev.115352.
69. Subramanian P, Karshovska E, Reinhard P, Megens RT, Zhou Z, Akhtar S, et a. Lysophosphatidic acid receptors LPA1 and LPA3 promote CXCL12-mediated smooth muscle progenitor cell recruitment in neointima formation. Circ Res. 2010;107:96–105.https://doi.org/10.1161/CIRCRESAHA.109.212647. 70. Murry CE, Keller G. Differentiation of embryonic stem cells to clinically
relevant populations: lessons from embryonic development. Cell. 2008;132: 661–80.https://doi.org/10.1016/j.cell.2008.02.008
71. Camp JG, Sekine K, Gerber T, Loeffler-Wirth H, Binder H, Gac M, et al. Multilineage communication regulates human liver bud development from pluripotency. Nature. 2017;546:533–538.https://doi.org/10.1038/nature22796. 72. Weinberger L, Ayyash M, Novershtern N, Hanna JH. Dynamic stem cell
states: naive to primed pluripotency in rodents and humans. Nat Rev Mol Cell Biol. 2016;17:155–69.https://doi.org/10.1038/nrm.2015.28
73. Zambidis ET, Peault B, Park TS, Bunz F, Civin CI. Hematopoietic differentiation of human embryonic stem cells progresses through sequential hematoendothelial, primitive, and definitive stages resembling human yolk sac development. Blood. 2005;106:860–70.https://doi.org/10. 1182/blood-2004-11-4522
74. Sun S, Zhang W, Chen X, Peng Y, Chen Q. A complex insertion/deletion polymorphism in the compositionally biased region of the ZFHX3 gene in patients with coronary heart disease in a Chinese population. Int J Clin Exp Med. 2015;8:7890–7.
75. Nakamura H, Edward DP, Sugar J, Yue BY. Expression of Sp1 and KLF6 in the developing human cornea. Mol Vis. 2007;13:1451–7.
76. Teo AK, Arnold SJ, Trotter MW, Brown S, Ang LT, Chng Z, et al. Pluripotency factors regulate definitive endoderm specification through eomesodermin. Genes Dev. 2011;25:238–250.https://doi.org/10.1101/gad.607311. 77. Bastide P, Darido C, Pannequin J, Kist R, Robine S, Marty-Double C, et al.
Sox9 regulates cell proliferation and is required for Paneth cell differentiation in the intestinal epithelium. J Cell Biol. 2007;178:635–648.
78. Mansouri A, Pla P, Larue L, Gruss P. Pax3 acts cell autonomously in the neural tube and somites by controlling cell surface properties. Development. 2001; 128:1995–2005.
79. Warrier S, Van der Jeught M, Duggal G, Tilleman L, Sutherland E, Taelman J, et al. Direct comparison of distinct naive pluripotent states in human embryonic stem cells. Nat Commun. 2017;8:15055.https://doi.org/10.1038/ ncomms15055.
80. Wang J, Singh M, Sun C, Besser D, Prigione A, Ivics Z, et al. Isolation and cultivation of naive-like human pluripotent stem cells based on HERVH expression. Nat Protoc. 2016;11:327–346.https://doi.org/10.1038/ nprot.2016.016.
81. Collier AJ, Panula SP, Schell JP, Chovanec P, Plaza Reyes A, Petropoulos S, et al. Comprehensive cell surface protein profiling identifies specific markers of human naive and primed pluripotent states. Cell Stem Cell. 2017;20(6): 874-890.e7.https://doi.org/10.1016/j.stem.2017.02.014.
82. Buhusi M, Demyanenko GP, Jannie KM, Dalal J, Darnell EP, Weiner JA, et al. ALCAM regulates mediolateral retinotopic mapping in the superior colliculus. J Neurosci. 2009;29:15630–41.https://doi.org/10.1523/JNEUROSCI. 2215-09.2009
83. Nakaya N, Sultana A, Lee HS, Tomarev SI. Olfactomedin 1 interacts with the Nogo A receptor complex to regulate axon growth. J Biol Chem. 2012;287: 37171–84.https://doi.org/10.1074/jbc.M112.389916
84. Gregianin E, Pallafacchina G, Zanin S, Crippa V, Rusmini P, Poletti A, et al. Loss-of-function mutations in the SIGMAR1 gene cause distal hereditary motor neuropathy by impairing ER-mitochondria tethering and Ca2+ signalling. Hum Mol Genet. 2016;25:3741–3753.https://doi.org/10.1093/ hmg/ddw220.
85. Ditadi A, Sturgeon CM, Keller G. A view of human haematopoietic development from the Petri dish. Nat Rev Mol Cell Biol. 2017;18:56–67.
https://doi.org/10.1038/nrm.2016.127
86. Zovein AC, Hofmann JJ, Lynch M, French WJ, Turlo KA, Yang Y, et al. Fate tracing reveals the endothelial origin of hematopoietic stem cells. Cell Stem Cell. 2008;3:625–636.https://doi.org/10.1016/j.stem.2008.09.018.
87. Geest CR, Coffer PJ. MAPK signaling pathways in the regulation of hematopoiesis. J Leukoc Biol. 2009;86:237–50.https://doi.org/10.1189/jlb.0209097
88. Fiori JL, Billings PC, de la Pena LS, Kaplan FS, Shore EM. Dysregulation of the BMP-p38 MAPK signaling pathway in cells from patients with fibrodysplasia ossificans progressiva (FOP). J Bone Miner Res. 2006;21:902–9.https://doi. org/10.1359/jbmr.060215
89. Lee SY, Yoon J, Lee MH, Jung SK, Kim DJ, Bode AM, et al. The role of heterodimeric AP-1 protein comprised of JunD and c-Fos proteins in hematopoiesis. J Biol Chem. 2012;287:31342–31348.https://doi.org/10.1074/ jbc.M112.387266.
90. Perry SS, Zhao Y, Nie L, Cochrane SW, Huang Z, Sun XH. Id1, but not Id3, directs long-term repopulating hematopoietic stem-cell maintenance. Blood. 2007;110:2351–60.https://doi.org/10.1182/blood-2007-01-069914
91. Begley CG, Green AR. The SCL gene: from case report to critical hematopoietic regulator. Blood. 1999;93:2760–70.
92. Guo G, Pinello L, Han X, Lai S, Shen L, Lin TW, et al. Serum-based culture conditions provoke gene expression variability in mouse embryonic stem cells as revealed by single-cell analysis. Cell Rep. 2016;14:956–965.https:// doi.org/10.1016/j.celrep.2015.12.089.
93. Shu J, Wu C, Wu Y, Li Z, Shao S, Zhao W, et al. Induction of pluripotency in mouse somatic cells with lineage specifiers. Cell. 2013;153:963–975.https:// doi.org/10.1016/j.cell.2013.05.001.
94. Niwa H, Ogawa K, Shimosato D, Adachi K. A parallel circuit of LIF signalling pathways maintains pluripotency of mouse ES cells. Nature. 2009;460:118– 22.https://doi.org/10.1038/nature08113
95. Ludwig T, A Thomson J. Defined, feeder-independent medium for human embryonic stem cell culture. Curr Protoc Stem Cell Biol. 2007;Chapter 1:Unit 1C 2.https://doi.org/10.1002/9780470151808.sc01c02s2.
96. Vallot C, Patrat C, Collier AJ, Huret C, Casanova M, Liyakat Ali TM, et al. XACT noncoding RNA competes with XIST in the control of X chromosome activity during human early development. Cell Stem Cell. 2017;20:102–111.
https://doi.org/10.1016/j.stem.2016.10.014.
97. Dobin A, Davis CA, Schlesinger F, Drenkow J, Zaleski C, Jha S, et al. STAR: ultrafast universal RNA-seq aligner. Bioinformatics. 2013;29:15–21.https://doi. org/10.1093/bioinformatics/bts635.
98. Liao Y, Smyth GK, Shi W. featureCounts: an efficient general purpose program for assigning sequence reads to genomic features. Bioinformatics. 2014;30:923–30.https://doi.org/10.1093/bioinformatics/btt656
99. Zhang HM, Liu T, Liu CJ, Song S, Zhang X, Liu W, et al. AnimalTFDB 2.0: a resource for expression, prediction and functional study of animal transcription factors. Nucleic Acids Res. 2015;43:D76–D81.https://doi.org/10. 1093/nar/gku887.
100. da Cunha JP, Galante PA, de Souza JE, de Souza RF, Carvalho PM, Ohara DT, et al. Bioinformatics construction of the human cell surfaceome. Proc Natl Acad Sci U S A. 2009;106:16752–16757.https://doi.org/10.1073/pnas. 0907939106.
101. Ramilowski JA, Goldberg T, Harshbarger J, Kloppmann E, Lizio M, Satagopam VP, et al. A draft network of ligand-receptor-mediated multicellular signalling in human. Nat Commun. 2015;6:7866.https://doi.org/ 10.1038/ncomms8866.
102. Supek F, Bosnjak M, Skunca N, Smuc T. REVIGO summarizes and visualizes long lists of gene ontology terms. PLoS One. 2011;6:e21800.https://doi.org/ 10.1371/journal.pone.0021800
103. Kohl M, Wiese S, Warscheid B. Cytoscape: software for visualization and analysis of biological networks. Methods Mol Biol. 2011;696:291–303.https:// doi.org/10.1007/978-1-60761-987-1_18
104. Li B, Dewey CN. RSEM: accurate transcript quantification from RNA-Seq data with or without a reference genome. BMC Bioinformatics. 2011;12:323.
https://doi.org/10.1186/1471-2105-12-323
105. Love MI, Huber W, Anders S. Moderated estimation of fold change and dispersion for RNA-seq data with DESeq2. Genome Biol. 2014;15:550.
https://doi.org/10.1186/s13059-014-0550-8
106. Han X, Chen H, Huang D. Mapping human pluripotent stem cell differentiation pathways via high throughput single-cell RNA-sequencing. Gene Expression Omnibus. 2018, GSE107552.https://www.ncbi.nlm.nih.gov/ geo/query/acc.cgi?acc=GSE107552. Accessed 6 Mar 2018.
• We accept pre-submission inquiries
• Our selector tool helps you to find the most relevant journal
• We provide round the clock customer support
• Convenient online submission
• Thorough peer review
• Inclusion in PubMed and all major indexing services
• Maximum visibility for your research
Submit your manuscript at www.biomedcentral.com/submit