comment
reviews
reports
deposited research
interactions
information
refereed research
Minireview
Metabolic control analysis: biological applications and insights
Mary C Wildermuth
Address: Department of Molecular Biology, Massachusetts General Hospital, 50 Blossom Street, Boston, MA 02114, USA. E-mail: wildermu@genetics.mgh.harvard.edu
Abstract
Metabolic control analysis provides a robust mathematical and theoretical framework for describing metabolic and signaling pathways and networks, and for quantifying the controls over these processes. Its application has already shed light on some of the principles underlying the regulation of metabolic pathways, and it is well suited to the analysis of the types of data emerging from genomic studies.
Published: 8 December 2000
GenomeBiology2000, 1(6):reviews1031.1–1031.5
The electronic version of this article is the complete one and can be found online at http://genomebiology.com/2000/1/6/reviews/1031 © GenomeBiology.com (Print ISSN 1465-6906; Online ISSN 1465-6914)
Modeling biological processes and systems
Mathematical modeling allows us to examine an event, process or system that we are unable to observe or under-stand directly because of its timing, magnitude, location or complexity. Models enable us to view a process or system at different organizational levels (for example, molecular or organismal) simultaneously, and to test responses of the system and its components to perturbations. Even incom-plete or limited models can pinpoint missing or incorrect pathways or components and can help ascertain the relative importance of pathways and components in different scenar-ios. Models can also elucidate underlying biological design principles, sometimes challenging existing scientific dogma. They do this by extending and integrating the effects of assumptions made at one organizational level to others, and by allowing the visualization of hypothetical scenarios. The term model is used broadly for the purposes of this article, and is defined as any mathematical or theoretical framework used to describe a component, process or system. This description can take many forms and make use of a variety of mathematical techniques (reviewed in [1]).To describe biological systems, which are naturally complex and integrated, properties at different organizational levels must be related to each other in a meaningful way. Thus, the properties of a system (systems properties) must reflect underlying molecular design principles, and equations detailing molecular components must take into account systems-level constraints and contexts. One such constraint is capacity, the maximum allowable flux. The system, as an
entity, is not just an assemblage of its individual parts but has emergent properties of the whole [2]. For a simple example, imagine a rubber ball that is cut into many small pieces. Much can be learned about the properties of the ball based on the individual cut pieces (for example, its elastic-ity), but we wouldnt know that the ball could roll.
2 GenomeBiology Vol 1 No 6 Wildermuth
be used to examine specific systems and to elucidate funda-mental underlying biological design principles, which are independent of a particular system.
Metabolic control analysis
TheoryMetabolic control analysis provides a robust mathematical and theoretical framework for describing metabolic and sig-naling pathways and networks, and for quantifying the con-trols over these processes. It can deal with systems of any complexity or architecture and does not require all system components to be known a priori, making it a valuable post-genomic tool. It was developed in the 1970s by Kacser and Burns [18] and Heinrich and Rapoport [19]. Since then, ded-icated researchers have expanded and advanced metabolic control analysis theory and applications, carefully defined
the associated terms, and developed analytical and educa-tional tools [20-25].
Metabolic control analysis uses equations based on the kinetics of enzymes (known as elasticity coefficients) to parameterize control coefficients (which describe the degree of control exerted by any given component on a par-ticular output) resulting in response coefficients. The response to a perturbation is quantified by the summation of the response coefficients affecting the output of interest, which depends on both the control coefficients (systems properties) and elasticity coefficients (local properties). The fundamental equations are presented in Box 1 (also see Figure 1). It should be noted, explicitly, that the use of metabolic control analysis is not limited to linear pathways, but is also applicable to branching and cyclic pathways, and enzyme cascades.
Box 1
Metabolic control analysis uses control coefficients, elasticity coefficients, and response coefficients to quantify responses to perturbations. The control and elasticity coefficients are scale-less terms of the form given in Equation 1. Control coefficients (C) define the degree of control that each step in a pathway has on system variables such as flux or metabolite concentration. The control coefficient (CA
i) of Equation 1 describes the strength of the response in variable
A (e.g. flux), to a change in the steady-state rate (ni) of step i.
A dA ni dln A A
C = • = where
兺
C = 1 (1)ni dni A dln ni n
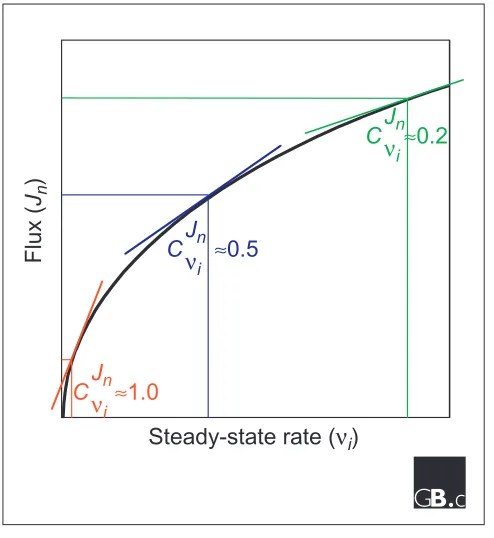
As illustrated in Figure 1, the flux control coefficient may range from 1 (complete control over a pathway) to 0 (no control). For a given flux Jn, the sum of the control coefficients for all enzymes affecting Jnmust equal one. Thus control coefficients are systems properties and are defined in the context and constraints of the system.
Elasticity coefficients (e)define the sensitivity of an isolated (that is, ‘local’) enzyme’s reaction rate (under the same con-ditions as the system) to changes in a reaction parameter such as substrate concentration. The elasticity coefficient is derived from the kinetics of a given enzyme and often reflects the fractional change in enzyme rate associated with a fractional change in substrate concentration.
The connectivity theorems relate the systems properties of the pathway (C) to the local properties of an individual enzyme’s kinetics (e) through a common intermediate metabolite (M). They describe how metabolic perturbations propagate through the chain of enzymes comprising a metabolic network. Equation 2 details the connectivity relation-ship - where A may be flux or metabolite concentration.
兺
i CAie
[M] i = 0 where A [M] (2)In addition to quantifying the control each step of a pathway exerts on a system variable (for example, flux), metabolic control analysis allows us to quantify the response to an external perturbation using the partitioned response coeffi-cient (R). As shown in Equation 3, an external effector (X) such as an inhibitor would affect the rate of some enzymes in the pathway as quantified by enzyme elasticity coefficients. However, as these rates change, so do the system vari-ables, as quantified by the control coefficient. The partitioned response coefficient therefore quantifies this change in the system variable (A) as the sum of the effects through all the enzymes (i) affected by the external effector (X), as shown in Equation 3.
RXA =
兺
i CA ie
i
comment
reviews
reports
deposited research
interactions
information
refereed research
Application to a specific system
Metabolic control analysis can be used to quantitate control exerted by different components of a specific system and pin-point areas requiring further experimentation. For example, Krauss and Brand [17] recently used metabolic control analysis to quantitate the contributions of known and unknown signal transduction pathways in the early response of thymocytes to mitogen (concanavalin A, ConA) stimulation. To apply meta-bolic control analysis to a complex system containing both metabolic and signaling components, they gathered large parts of metabolism or signal transduction into black-box groups of reactions, coupled signal transduction events to cellular vari-ables, and limited the time frame of observation. In particular, thymocyte response to Con A stimulation was quantified by measuring steady-state respiration rates, and signaling routes (such as protein kinase C (PKC)) were grouped based on their sensitivity to specific inhibitors. The effects of these known and unknown signal transduction pathways on the mitochondrial membrane potential, a key intermediate in respiration, were also quantified. The analysis of the model system, presented in Figure 2, resulted in a quantitative topology of signaling routes involved in the early phase of mitogen stimulation of thymocytes. Novel findings, such as the significant role played by calcineurin signal transduction pathways (30% of total), highlight areas for future experimental work.
Elucidation of underlying biological design principles
[image:3.609.53.300.86.355.2]The application of metabolic control analysis has altered our basic understanding of metabolic control. In particular, the belief that control over a pathway is dictated by a rate-limit-ing step is now obsolete and is berate-limit-ing removed from the bio-chemistry textbooks. Instead, it is replaced by the concept of shared control, where many - or theoretically all - enzymes in a pathway have a role in controlling the flux through the
Figure 2
The model systems analyzed in [17], reproduced with permission. (a) Mitogen stimulation of thymocyte
respiration is depicted as a single open arrow. Respiration is targeted by the mitogen Con A via a number of signal transduction pathways. Analysis of the system should allow one to establish a topology of signal routes and to weight the arrows extending through the signal transduction intermediates (PKC, MAPK, calcineurin and the unidentified pathways). (b) The system depicted in (a) in a modified form. Fewer signal transduction pathways are considered, but their interaction is studied with respect to two blocks of reactions that participate in respiration: the producers and the consumers of the mitochondrial membrane potential (DYm). The responses of these target pathways to Con A via the signal transduction pathways considered can be determined using specific inhibitors of signal transduction (bisindolylmaleimide I and cypermethrin), electron transport (myxothiazol) and ATP synthesis (oligomycin).
PKC
Producers Consumers
Bisindolyl-maleimide I
Myxothiazol Oligomycin
(Both)
Cypermethrin MAPK Calcineurin
Con A
Con A
Unidentified
PKC Calcineurin Others
(a)
(b)
∆Ψm
Figure 1
Flux control coefficients (C) for typical variations in pathway flux (J) measured at step n with a steady-state rate (n) at step iof a pathway. The coefficients are equal to the slope of the tangent to the curve (shown) multiplied by the scaling term vi/Jn. This figure is adapted from [6].
Steady-state rate (
νi
)
C
≈
1.0
Flux (
J
n)
J
nν
iC
J
n≈
0.5
ν
iC
J
n≈
0.2
[image:3.609.315.557.195.548.2]pathway. Implicit in this is the idea that the regulation of cell metabolism requires coordinate change in the activities of many enzymes (multisite modulation [26]). The validity of this notion has been supported by bioengineers lack of success in increasing a particular flux (product yield) by overexpressing the rate-limiting enzyme and success by overexpressing a group of enzymes in a pathway. For example, Niederberger et al.[27] found that overexpression of four of the five enzymes in the yeast biosynthetic pathway leading from chorismate to tryptophan was required to sig-nificantly increase (more than eightfold) the production of tryptophan.
If the coordinated expression of enzymes in a pathway is required to significantly increase its flux, this should be an underlying design principle of organisms. In fact, the coordi-nated induction of enzymes to increase metabolic flux through a pathway has long been observed in vivo. One of many examples provided by Fell [21] is the urea synthetic pathway. The rate of urea synthesis in rats responds propor-tionately to the amount of protein in the diet. When rats are fed on diets that increase urea output fourfold, eight of the enzymes measured increased significantly, including all four of the urea-cycle enzymes [28]. With DNA microarrays and complete genome information, global expression data detail-ing the coordinated induction of pathway enzymes may be coupled with structural information on the organization of genes for pathway enzymes in operons or in clusters with common cis-acting elements (for example, see [29]). By per-forming these types of analyses on organisms responding to a variety of external effectors (such as nutrient conditions, pathogens, and so on), and on diverse organisms, this underlying design principle may be further explored.
Metabolic control analysis can also be used to explain why most mutations in diploid organisms are fully recessive. Most enzymes have low-flux control coefficients; thus, a 50% reduction in enzyme concentration resulting from a null mutation in one allele of a diploid pair has little effect on the pathway flux. In addition, because pathway flux is a systems property, the influence of an alteration at one locus is mea-sured in the whole system, minimizing the impact from any one reduction. Kacser and Burns [30] therefore posited the phenomenon of genetic dominance as the inevitable conse-quence of the kinetic structure of enzyme networks and not a result of natural selection. This conclusion was supported by Orr [31], who found the same extent of recessive mutations in artificial diploids created from the haploid organism Chlamydomonas reinhardtii (where the possibility of selec-tion in the diploid was eliminated). The existence of a limited number of partially recessive mutants, in which the heterozygote has an intermediate phenotype, is also consis-tent with metabolic control analysis. Theoretically, these enzymes (with high control coefficients) would be more likely to be a part of a very small pathway or the first enzyme of a branching pathway. Despite these studies, the inevitability
of dominance is still debated [32]. With the availability of complete genome information for a number of diploid organisms, genomic information on natural variants (for example, the Arabidopsisecotypes Columbia and Landsberg [33]), and numerous collections of mutants, this type of question can now be addressed on a global scale.
Future directions and challenges
As illustrated above, metabolic control analysis is particu-larly useful for describing the theoretical aspects of regula-tion. This utility will continue to expand in the post-genomic era, particularly with advances in the in vivo imaging and quantitation of proteins and metabolites (for example, using tracer nuclear magnetic resonance). Future modeling efforts will require the integration or sampling of current mathe-matical approaches, including metabolic control analysis, as well as the development of new theoretical approaches and tools. As models become more complex and integrated to reflect the sheer volume of simultaneously occurring reac-tions in a cell, the incorporation of Monte Carlo methods (random sampling) and finite element analysis (approxima-tions based on subdivision into smaller, more manageable elements) is likely to be necessary. In addition, the platforms and databases required to construct models of increasing complexity need to be developed in an organized and collab-orative manner and to be widely accessible [34]. Access to the requisite computational resources will also become an issue. Perhaps an institute similar to the National Center for Atmospheric Research [35], which facilitates international global climate change research, could help coordinate and support biological modeling efforts.
Acknowledgements
My sincere thanks to David Fell, Stefan Krauss, Fred Ausubel and Julia Dewdney for their comments on drafts of this manuscript.
References
1. Gershenfeld N: The Nature of Mathematical Modeling.Cambridge Uni-versity Press; 1999.
2. Bhalla US, Iyengar R: Emergent properties of networks of bio-logical signaling pathways.Science1999, 283:381-387.
3. Collado-Vides J, Magasanik B, Smith TF: Integrative Approaches to Mol-ecular Biology. Cambridge, MA: MIT Press; 1996.
4. Giersch C: Mathematical modeling of metabolism.Curr Opin Plant Biol2000, 3:249-253.
5. Palsson B: The challenges of in silico biology. Nat Biotechnol 2000, 18:1147-1150.
6. Fell DA, Wagner A: The small world of metabolism.Nat Biotech-nol2000, 18:1112-1122.
7. Weng G, Bhalla US, Iyengar R: Complexity in biological signal-ing systems.Science1999, 284:92-96.
8. Poolman MG, Fell DA, Thomas S: Modelling photosynthesis and its control.J Exp Bot2000, 51:319-328.
9. Ni T-C, Savageau M: Application of biochemical systems theory to metabolism in human red blood cells. J Biol Chem 1996,271:7927-7941.
10. Savageau MA: Power-law formalism: a canonical nonlinear approach to modeling and analysis.In World Congress of Nonlin-ear Analysts, 92, Vol 4. Edited by Lakshmikantham V. Berlin: Walter de Gruyter; 1996.
11. Schilling CH, Schuster S, Palsson BO, Heinrich R: Metabolic pathway analysis: basic concepts and scientific applications in the post-genomic era.Biotechnol Prog1999, 15:296-303. 12. Edwards JS, Palsson BO: Systems properties of the
Haemophilus influenzae Rd metabolic genotype. J Biol Chem 1999, 274:17410-17416.
13. Jeong H., Tombor B, Albert R, Oltavai N, Barabasi, A-L: The large-scale organization of metabolic networks. Nature 2000, 407:651-654.
14. Fambrough D, McClure K, Kazlauskas A, Lander ES: Diverse signal-ing pathways activated by growth factor receptors induce broadly overlapping, rather than independent, sets of genes. Cell1999, 97:724-741.
15. Pawson T, Saxton TM: Signaling networks - do all roads lead to the same genes?Cell 1999, 97:675-678.
16. Kholodenko BN, Demin OV, Moehren G, Hoek JB: Quantification of short term signaling by the epidermal growth factor receptor.J Biol Chem1999, 274:30169-30181.
17. Krauss S, Brand MD: Quantitation of signal transduction.FASEB J2000, 14: in press.
18. Kacser H, Burns JA: Control of enzyme flux.Symp Soc Exp Biol 1973, 27:65-104.
19. Heinrich R, Rapoport TA: A linear steady-state treatment of enzymatic chains.Eur J Biochem1974, 42:89-95.
20. Fell DA: Metabolic control analysis - a survey of its theoreti-cal and experimental development.Biochem J1992, 152:313-330.
21. Fell D: Understanding the Control of Metabolism. London: Portland Press; 1997.
22. Heinrich R, Schuster S: The Regulation of Cellular Systems. New York: Chapman and Hall; 1996.
23. Cornish-Bowden A: Metabolic control analysis in theory and practice. Adv Mol Cell Biol 1995, 11:21-64.
24. MCA website[http://gepasi.dbs.aber.ac.uk/metab/mca]
25. Bionet metabolic regulation newsgroup[bionet.metabolic-reg] 26. Fell DA, Thomas S: Physiological control of metabolic flux: the
requirement for multisite modulation.Biochem J1995, 311:35-39.
27. Niederberger P, Prasad R, Miozzari G, Kacser H: A strategy for increasing an in vivo flux by genetic manipulations of the tryptophan system of yeast.Biochem J1992, 287:473-479. 28. Schimke RT: Adaptive characteristics of urea cycle enzymes
in the rat.J Biol Chem1962, 237:459-468.
29. Tavazoie S, Hughes JD, Campbell MJ, Cho RJ, Church GM: System-atic determination of genetic network architecture. Nat Genet 1999, 22:281-285.
30. Kacser H, Burns JA: The molecular basis of dominance.Genetics 1981, 97:639-666.
31. Orr HA: A test of Fisher’s theory of dominance.Proc Natl Acad Sci USA 1991, 88:11413-11415.
32. Grossniklaus U, Madhusudhan MS, Nanjundiah V: Nonlinear enzyme kinetics can lead to high metabolic flux control coefficients: implications for the evolution of dominance. J Theor Biol1996, 182:299-302.
33. The Arabidopsis Information Resource [http://www.arabidop-sis.org]
34. Alliance for Cellular Signaling[http://afcs.swmed.edu/] 35. National Center for Atmospheric Research
[http://ncar.ucar.edu/ncar]
comment
reviews
reports
deposited research
interactions
information