Performance Evaluation of K-means Clustering
Algorithm with Various Distance Metrics
Y. S. Thakare
Electronics and Telecommunication Engineering (PG Student)
KCT’s Late G. N. Sapkal College of Engineering Anjaneri, Nashik, India
S. B. Bagal
Electronics and Telecommunication Engineering (Head of Dept.)
KCT’s Late G. N. Sapkal College of Engineering Anjaneri, Nashik, India
ABSTRACT
Cluster analysis has been widely used in several disciplines, such as statistics, software engineering, biology, psychology and other social sciences, in order to identify natural groups in large amounts of data. Clustering has also been widely adopted by researchers within computer science and especially the database community. K-means is the most famous clustering algorithms. In this paper, the performance of basic k means algorithm is evaluated using various distance metrics for iris dataset, wine dataset, vowel dataset, ionosphere dataset and crude oil dataset by varying no of clusters. From the result analysis we can conclude that the performance of k means algorithm is based on the distance metrics for selected database. Thus, this work will help to select suitable distance metric for particular application.
General Terms
Clustering algorithms, Pattern recognition.
Keywords
K-means, Clustering, Centroids, distance metrics, Number of clusters.
1.
INTRODUCTION
In the recent years, Clustering is the unsupervised classification of patterns (or data items) into groups (or clusters). A resulting partition should possess the following properties: (1) homogeneity within the clusters, i.e. data that belong to the same cluster should be as similar as possible, and (2) heterogeneity between clusters, i.e. data that belong to different clusters should be as different as possible. Several algorithms require certain parameters for clustering, such as the number of clusters.
The basic step of K-means clustering is simple. In the beginning, determine number of cluster K and assume the centroid or center of these clusters. Take any random objects as the initial centroids or the first K objects can also serve as the initial centroids.
There are several different implementations in K-means clustering and it is a commonly used partitioning based clustering technique that tries to find a user specified number of clusters (K), which are represented by their centroids, and have been successfully applied to a variety of real world classification tasks in industry, business and science.
Unsupervised fuzzy min-max clustering neural network in which clusters are implemented as fuzzy set using membership function with a hyperbox core that is constructed from a min point and a max point [1]. In the sequel to Min-Max fuzzy neural network classifier, Kulkarni U. V. et al. proposed fuzzy hyperline segment clustering neural network (FHLSCNN). The FHLSCNN first creates hyperline segments by connecting adjacent patterns possibly falling in same cluster by using fuzzy membership criteria. Then clusters are
formed by finding the centroids and bunching created HLSs that fall around the centroids [2].In FHLSCNN, the Euclidean distance metric is used to compute the distances l1 , l2and l for
the calculation of membership function. Kulkarni U.V and others [3] presented the general fuzzy hypersphere neural network (GFHSNN) that uses supervised and unsupervised learning within a single training algorithm. It is an extension of fuzzy hypersphere neural network (FHSNN) and can be used for pure classification, pure clustering or hybrid clustering/classification. A. Vadivel, A. K. Majumdar, and Shamik Sural compare the performance of various distance metrics in the content-based image retrieval applications [4]. An Efficient K-means Clustering Algorithm Using Simple Partitioning presented by Ming-Chuan Hung, Jungpin Wu+, Jin-Hua Chang, In this paper an efficient algorithm to implement a K-means clustering that produces clusters comparable to slower methods is described. Partitions of the original dataset into blocks; each block unit, called a unit block (UB), and contains at least one pattern and locates the centroid of a unit block (CUB) by using a simple calculation [5]. The basic detail of K-means is also explained in this paper. Fahim et al. [6] proposed k-means algorithm determines spherical shaped cluster, whose center is the magnitude center of points in that cluster, this center moves as new points are added to or detached from it. This proposition makes the center closer to some points and far apart from the other points, the points that become nearer to the center will stay in that cluster, so there is no need to find its distances to other cluster centers. The points far apart from the center may alter the cluster, so only for these points their distances to other cluster centers will be calculated, and assigned to the nearest center. Bhoomi Bangoria, et al. presents a survey on Efficient Enhanced K-Means Clustering Algorithm. The comparison of different K-means clustering algorithms is performed here [8].To improves the performance using some changes in already existing algorithm Enhanced K-Means Clustering Algorithm proposed by Bhoomi Bangoria to Reduce Time Complexity of Numeric Values [9]. P. Vora et al. [10] proposed K-means clustering which is one of the popular clustering algorithms and comparison of K-means clustering with the Particle swarm optimization is performed. Mohammad F. Eltibi, Wesam M. Ashour [12] proposed an enhancement to the initialization process of k-means, which depends on using statistical information from the data set to initialize the prototypes and algorithm gives valid clusters, and that decreases error and time. An improvement in the traditional K-mean algorithm proposed by Jian, Hanshi Wang [13]. To optimize the K value, and improve clustering performance genetic algorithm is used.
13 recognition rate and no of cluster form, with different distance
metric and different datasets. The result are analyzed and compared for these various distance metric. The objective of this paper is to check the suitability.
The rest of this paper is organized as follows. In Section 2 the concept of K-means clustering algorithm with various distance metrics is explained. Its algorithm is discussed in Section 3. Section 4; explain the equations of various data metrics. The experimental procedure, simulation result, description of data sets and discussions on the results are presented in Section 5. Finally, we conclude the paper.
2.
K-MEAN CLUSTRING
"K-means" term proposed by James McQueen in 1967 [10].This standard algorithm was firstly introduced by Stuart Lloyd in 1957 as a technique pulse-code modulation. The K-Means clustering algorithm is a partition-based cluster analysis method [10]. K-means clustering is one of the simplest unsupervised classification techniques. It is also one of the most popular unsupervised learning algorithms due to its simplicity An unsupervised classifier is that a training data set with known class labels is required for the former to train the classification rule, whereas such a training data set and the knowledge of the class labels in the data set are not required for the latter.
K-means algorithm uses an iterative process in order to cluster database. It takes the number of desired clusters and the initial means as inputs and produces final means as output. Mentioned first and last means are the means of clusters. If the algorithm is required to produce K clusters then there will be K initial means and K final means. In completion, K-means algorithm produces K final means which answers why the name of algorithm is K-means.
According to the algorithm we firstly select k objects as initial cluster centers, then calculate the distance between each cluster center and each object and assign it to the nearest cluster, update the averages of all clusters, repeat this process.
To summarize, there are different categories of clustering techniques including partitioning, hierarchical, density-based and grid-based clustering. The K-means clustering algorithm is a clustering technique that falls into the category of partitioning. The algorithm finds a partition in which data points within a cluster are close to each other and data points in different clusters are far from each other as measured by similarity. As in other optimization problems with a random component, the results of k-means clustering are initialization dependent. This is usually dealt with by running the algorithms several times, each with a different initialization. The best solution from the multiple runs is then taken as the final solution.
3.
K- MEAN CLUSTRING ALGORITHM
The k-means clustering algorithm partitions a given data set into k mutually exclusive clusters such that the sum of the distances between data and the corresponding cluster centroid is minimized. The above distance measure between two data points is taken as a measure of similarity. A number of distance measures can be used depending on the data. The Euclidean distance and the Mahalanobis distance are some typical examples of distance measures. In this study, the standard Euclidean distance is used for the distance measure.
Mathematically, given a set of data or n no of points {x1, x2…. xn} where n is the number of observations, the k-means clustering algorithm groups the data into k clusters. As the
Euclidean distance was adopted as the distance measure in this study, it is then explicitly given as
d = (𝑥𝑖− 𝑧𝑗)2
𝑖=𝐶𝑗 k
j=1
1/2
(1)
Where, cj is the j-th cluster and zj, is the centroid of the cluster cj and xi is an input pattern. Therefore, the k-means clustering algorithm is an iterative algorithm that finds a suitable partition. A simple method is to initialize the problem by randomly select k data points from the given data. The remaining data points are classified into the k clusters by distance. The centroids are then updated by computing the centroids in the k clusters.
The steps of the K-means algorithm are therefore first described in brief.
Step 1: Choose K initial cluster centers {z1, z2… zK} randomly from the n points {x1, x2… xn}
Step 2: Assign point xi, i=1, 2… n to cluster Cj, j є {1, 2… K} if
ǁ xi-zj ǁ < ǁ xi-zp ǁ p=1, 2…K, j≠p (2)
Step 3: Compute new cluster centres z*1, z*2………… z*k
As follows:
z𝑖∗= 1
𝑛𝑖 𝑥𝑗∈𝑐𝑖𝑥𝑗 i=1, 2…, K (3) Where ni is the number of elements belonging to cluster Ci.
Step 4: Ifz𝑖∗ = zi, i =1, 2… K then terminates. Otherwise
continue from step 2.
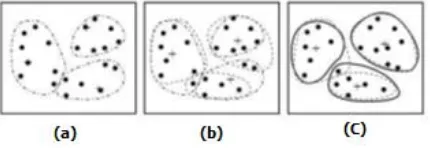
[image:2.595.319.534.488.562.2]Note that in case the process does not terminate at Step 4 normally, then it is executed for a maximum fixed number of iterations.
Fig. 1: Example of K-means Algorithm
4.
DISTANCE METRICS
To compute the distance d between centroid and the pattern of specific cluster is given by equation (1), we can use various distance metrics. In this paper we have decided to use three distance metrics. In pattern recognition studies the importance goes to finding out the relevance between patterns falling in n-dimensional pattern space. To find out the relevance between the patterns the characteristic distance between them is important to find out. So the characteristics distance between the patterns plays important role to decide the unsupervised classification (clustering) criterion. If this characteristics distance has changed then the clustering criteria may be changed.
[15] [16]. Euclidean distance is the direct straight line geometrical distance between the two points as shown in.
Fig 2: Concept of Euclidean Distance.
[image:3.595.93.241.276.399.2]While Manhattan distance is the city block distance between two points as shown in figure 3.
Fig 3: Concept of Manhattan Distance.
Considering above example it is clear that though the two points A and B remains at same position in pattern space but the distance between them has changed if the metric or method to calculate distance is changed. Hence in pattern clustering studies it is important to know how the pattern clustering result, i.e. recognition rate changes with various distance metrics. However it will be very interesting to know which distance metric is suitable for particular dataset. The results presented in this paper may help to decide the distance metric choice for particular application. Theoretically if we consider the problem, we should get different results if we apply different distance metrics to calculate distance between centroid to specific pattern given by equation (1) for calculation of this distance between two points can be calculated using various distance metrics as below [4]. Where, xi and yi is the two points, d is the distance between them and d is calculated using formula given below.
A. Euclidean Distance:
d = xi−yi 2 n
i=1
1/2
(4)
B. Manhattan Distance or City Block Distance:
d = xi− yi n
i=1
(5)
C. Canberra Distance:
d = xi− yi xi − yi n
i=1
(6)
5.
EXPERIMENTS AND RESULTS
This is implemented using MATLAB R2013a and ran on Intel core i3 2328M, 2.2GHz PC. To evaluate the different capabilities of an unsupervised pattern classifier, we choose five benchmark data sets from the UCI machine learning repository [11].A description of each data set is as follows.
1) The Iris data set: This data set contains 150 samples, each with four continuous features (sepal length, sepal width, petal length, and petal width), from three classes (Iris setosa, Iris versicolor, and Iris virginica). This data set is an example of a small data set with a small number of features. One class is linearly separable from the other two classes, but the other two classes are not linearly separable from each other.
2) The Wine data set: This data set is another example of multiple classes with continuous features. The features are Alcohol, Malic, Ash, Alcalinity, Magnesium, Phenols, Flavanoids, Non-Flavanoids, Proanthocyanins, Color, Hue, (1OD280/OD315) of diluted wines and Proline. This data set contains 178 samples, each with 13 continuous features from three classes.
3) The Vowel data set: This data set contains 871 samples, each with three continuous features, from six classes. There are six overlapping vowel classes of Indian Telugu vowel sounds and three input features (formant frequencies) [14]. These were uttered in a consonant vowel-consonant context by three male speakers in the age group of 30-35 years. The data set has three features F1, F2 and F3, corresponding to the first, second and third vowel formant frequencies, and six overlapping classes {δ, a, i, u, e, o}.
4) The Ionosphere data set: This data set consists of 351 cases with 34 continuous features from two classes. This is classification of radar returns from the ionosphere.
5)The Crude oil dataset: This overlapping data has 56 data points, 5 features and 3 classes.
The performance of K-means algorithm is evaluated for recognition rate with different no of cluster with different distance metric mentioned in section 4 for different datasets. Table I to III Tables shows the performance evaluation of k means clustering algorithm for Iris data, Wine data, vowel data, ionosphere data and crude oil data respectively. In case of vowel dataset it has 6 classes hence it can’t cluster in 3, 5 number of clusters.
Table I: Performance evaluation using Euclidean Distance Metric
Dataset
Recognition Rate (%)
Number of cluster Formed
3 5 10 14 16
Iris 89.33 98 98 99.33 99.33
15
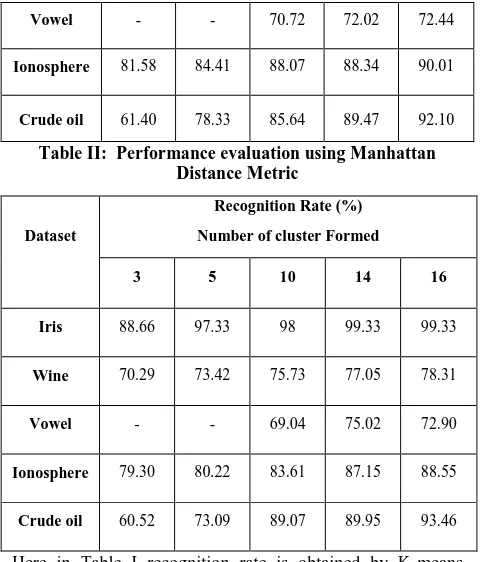
Vowel - - 70.72 72.02 72.44
Ionosphere 81.58 84.41 88.07 88.34 90.01
Crude oil 61.40 78.33 85.64 89.47 92.10
Table II: Performance evaluation using Manhattan Distance Metric
Dataset
Recognition Rate (%)
Number of cluster Formed
3 5 10 14 16
Iris 88.66 97.33 98 99.33 99.33
Wine 70.29 73.42 75.73 77.05 78.31
Vowel - - 69.04 75.02 72.90
Ionosphere 79.30 80.22 83.61 87.15 88.55
Crude oil 60.52 73.09 89.07 89.95 93.46
[image:4.595.48.288.71.352.2]Here in Table I recognition rate is obtained by K-means clustering Algorithm for different number of clusters i.e. 3, 5, 10, 14 and 16 for all given datasets using Euclidean Distance Metric.
Table III: Performance evaluation using Canberra Distance Metric
Dataset
Recognition Rate (%)
Number of cluster Formed
3 5 10 14 16
Iris 95.33 96 98 98 98
Wine 95.77 95.30 98.59 99.06 99.06
Vowel - - 75.52 77.30 78.11
Ionosphere 63.17 74.41 76.44 76.26 80.12
Crude oil 65.76 84.37 92.18 92.58 93.46
In Table II, Table III recognition rate is obtained by K-means clustering Algorithm for different number of clusters i.e. 3, 5, 10, 14 and 16 for all given datasets using Manhattan Distance Metric and Canberra Distance Metric.
The recognition rate is observed by varying the number of clusters by changing data sets, experiments are repeated for various numbers of clusters from 3, 5, 10, 14, 16 respectively and the obtained results are tabulated in rows of Table. Similarly, the results obtained with Euclidean Distance Metric, Manhattan Distance Metric, Canberra Distance Metric are listed in Table I, Table II and Table III.
If we observe the results summarized in Table I to Table III, then it is observed that all the distance metrics have different performance in terms of recognition rate and no of cluster. The Canberra distance metric gives lower recognition rate in case of Iris data set, ionosphere dataset, but it surprisingly
gives a good recognition rate for wine data set, and vowel and cruid oil data set. The Manhattan distance also gives a comparable performance for the entire data set in term of recognition rate. Thus all this result analysis shows that the performance of selected unsupervised classifier is based on the distance metrics as well the database used.
6.
CONCLUSION
The K means clustering unsupervised pattern classifier is proposed with various distance metrics such as Euclidean, Manhattan and Canberra distance metrics. The performance of k means clustering algorithm is evaluated with various benchmark databases such as Iris, Wine, Vowel, Ionosphere and Crude oil data Set .The k means clustering algorithm is evaluated for recognition rate for different no of cluster i.e. 3, 5, 10, 14, 16 respectively. From the result analysis we can conclude that the performance of k means algorithm is based on the distance metrics as well the database used. Thus, this work will help to select suitable distance metric for particular application. In future, the performance of various clustering algorithm for various metrics can be evaluated with different database to decide its suitability for a particular application.
7.
REFERENCES
[1] P. K. Simpson, ―Fuzzy min–max neural networks—Part 2: Clustering‖, IEEE Trans. Fuzzy systems, vol. 1, no. 1, pp. 32–45, Feb. 1993.
[2] U. V. Kulkarni, T. R. Sontakke, and A. B. Kulkarni, ―Fuzzy hyperline segment clustering neural network‖, Electronics Letters, IEEE, vol. 37, no. 5, pp. 301–303, March. 2001.
[3] U.V. Kulkarni, D.D. Doye, T.R. Sontakke, ―General fuzzy hyper sphere neural network‖, Proceedings of the IEEE IJCNN. 2369–2374, (2002).
[4] A. Vadivel, A. K. Majumdar, and S. Sural, ―Performance comparison of distance metrics in content-based Image retrieval applications‖, in Proc. 6th International Conf. Information Technology, Bhubaneswar, India, Dec. 22-25, pp. 159-164, 2003.
[5] Ming-Chuan Hung, Jungpin Wu+, Jin-Hua Chang,―An Efficient K-Means Clustering Algorithm Using Simple Partitioning‖, Journal Of Information Science And Engineering 21, 1157-1177 (2005)
[6] Fahim A.M., Salem A.M., Torkey F.A., Ramadan M.A. ―An efficient enhanced k-means clustering algorithm‖, J Zhejiang Univ. SCIENCE A 2006 7(10):1626-1633
[7] Juntao Wang and Xiaolong Su, "An improved k-mean clustering algorithm", IEEE 3rd International Conference on Communication Software and Networks (ICCSN), 2011, pp 44-46, 2011.
[8] Bhoomi Bangoria, Prof. Nirali Mankad, Prof. Vimal Pambhar, ―A survey on Efficient Enhanced K-Means Clustering Algorithm‖, International Journal for Scientific Research & Development, Vol. 1, Issue 9, 2013.
[9] Bangoria Bhoomi M., ―Enhanced K-Means Clustering Algorithm to Reduce Time Complexity for Numeric Values‖, International Journal of Computer Science and Information Technologies, Vol. 5 (1), 876-879, 2014.
International Journal of Science and Modern Engineering Volume-1, Issue-3, February 2013
[11]P. M. Murphy and D. W. Aha, UCI Repository of Machine Learning Databases, (Machine-Readable Data Repository). Irvine, CA: Dept. Inf. Comput. Sci., Univ. California, 1995.
[12]Mohammad F. Eltibi, Wesam M. Ashour, ―Initializing K-Means Clustering Algorithm using Statistical Information‖, International Journal of Computer Applications (0975 – 8887) Volume 29 No.7, September 2011
[13]Jian Zhu, Hanshi Wang, ―An improved K-means clustering algorithm‖, The 2nd IEEE International Conference on Information Management and Engineering (ICIME), 2010
[14]U. Maulik, and S. Bandyopadhyay, ―Genetic Algorithm-Based Clustering Technique‖, Pattern Recognition 33, pp. 1455-1465, 1999.
[15]K. S. Kadam and S. B. Bagal, ―Fuzzy Hyperline Segment Neural Network Pattern Classifier with Different Distance Metrics‖, International Journal of Computer Applications 95(8):6-11, June 2014.