Munich Personal RePEc Archive
Tax revenues in the European Union:
Recent trends and challenges ahead
Carone, Giuseppe and Nicodème, Gaëtan and Schmidt, Jan
European Commission - General Directorate Economic and
Financial Affairs
11 July 2007
Online at
https://mpra.ub.uni-muenchen.de/3996/
Economic Papers
are written by the Staff of the Directorate-General for
Economic and Financial Affairs, or by experts working in association with them.
The “Papers” are intended to increase awareness of the technical work being done
by the staff and to seek comments and suggestions for further analyses. Views
expressed represent exclusively the positions of the author and do not necessarily
correspond to those of the European Commission. Comments and enquiries
should be addressed to the:
European Commission
Directorate-General for Economic and Financial Affairs
Publications
BU-1
B - 1049 Brussels, Belgium
ISSN 1016-8060
ISBN 978-92-79-04633-9
KC-AI-07-280-EN-N
Tax revenues in the European Union:
Recent trends and challenges ahead
Giuseppe Carone
European Commission (DG ECFIN)
Gaëtan Nicodème*
European Commission (DG ECFIN), ECARES (ULB) and CEB (Solvay Business School)
Jan Host Schmidt
European Commission (DG ECFIN)
May 2007
Abstract: The governments of the European Union are facing important challenges that may
impact both their need and their capacity to collect taxes. First, ageing will increase some social spending while reducing the potential of some tax bases such as labour. Second, globalisation has the potential to increase the mobility of capital and of high-skilled workers, making it more difficult to rely on them as a source of revenues. Finally, the desire to shift tax away from labour and to make work pay while retaining the social models will force Member States to find alternative robust tax bases. This paper reviews the most recent trends in taxation in the European Union and discusses several tax policy issues in the light of those coming challenges.
Keywords: Taxation; Welfare State; European Union; ageing; globalisation.
JEL Classification: H10, H20, H50.
1. Introduction.
Over the latest years, we have witnessed a certain stabilisation in the overall tax burden of EU Member States. This marked an interruption of many years of increasing tax burdens, reflecting increasing public expenditures. More recently, overall levels of expenditure are being reduced in an effort to consolidate public finances, followed to some extent by some reduction in revenues as percentage of GDP after the peak in the late 1990s. While pursuing more efficiency in public spending should help reduce the pressure on revenues, the future economic and budgetary impact of population ageing and globalisation present significant challenges which require a comprehensive strategy, including on the taxation side.
EU Member States have carried out important reforms of their tax systems. These reforms were driven by several factors. First, high unemployment rates and low participation rates represent a loss of human capital and create social tensions. The growing awareness that the excessive tax burden on labour and its interaction with the benefit systems lower work incentives, especially for those with low earnings potential, has led EU Member States to move towards a more employment-friendly labour taxation. In doing this, they have also faced the difficulty of finding alternative tax bases to finance their expenditures. Second, Member States have undertaken efforts to rationalise and simplify their tax systems. Almost all efforts have gone in the direction of broadening the tax base in order to reduce the tax rates. This potentially brings economic benefits but also bring forward the question of a possible trade-off between efficiency and fairness. Finally, globalisation and ageing have raised the issue of the financing of the social models in the European countries. In particular, the constraints imposed by these challenges have focussed the debate around the need for finding alternative and robust tax bases. This paper discusses the implications of these challenges for tax policy in the European Union and reviews the options for financing the welfare state.
Tax collection has been impacted by structural developments and growing challenges. Economic integration and the increasing mobility of factors of production, in particular capital, have made it easier for tax bases to relocate and taxes are one element determining this choice. In the face of the growing challenges of ageing and globalisation, Member States have been progressively more concerned by the perspective of vanishing tax bases or the progressive shift of the tax burden from mobile to immobile tax bases which could ultimately threaten their capacity to finance their social model(s). Taxes are indeed closely linked to the objectives of the welfare state. These objectives can be conveniently classified according to the following categories: efficiency of the economy, supporting the living standards at all stage of life or in case of adverse events, reducing inequalities, promoting social integration, protecting citizens, and ensuring an intelligible and abuse-free administration (Barr, 2002)1. To meet these aims, taxation can be used in different ways2. First, taxation can be used as a source of financing for public interventions such as the production of public goods, the transfer of income or the provision of insurance with compulsory membership. Second, taxation can also be used to directly correct market failures or to promote (resp. discourage) the consumption of merit goods (resp. demerit goods) for which positive (resp. negative) externalities are not internalised.
1
An alternative classification deals with the three 'R's' of the welfare state: Redistribution between people, Risk and insurance, and Reallocation over the life cycle (de Mooij, 2006).
2
It naturally follows that the level – and to some extent the structure – of taxation is closely linked to the level of public expenditures. Several factors are shaping the degree of government intervention in the economy (Tanzi, 1997). First, the level of economic development is impacting the efficiency of markets and hence the need for policy intervention. In more developed economies, for which basic needs are fulfilled, citizens may express a higher desire for larger social programmes, a phenomenon known as the Wagner Law or Law of Increasing State Spending. Next, the level of technological development may shape government spending in several directions. Technological improvements may break natural monopolies and hence create less scope for direct public intervention. Innovation can also reduce the cost of existing technologies but in the same time bring new ones that are more costly – a well-known phenomenon in health care expenditures. Third, the degree of openness of the economy may increase the need for a larger public sector that acts as a buffer against external shocks (Rodrik, 1998). Finally and foremost, social attitudes, mainstream economic or political thinking, and historical developments help understanding the evolution of the size of the government3. As evidenced by table (1), during the period between the 1870 French-German war and WWI, total public expenditures to GDP were at a meagre 10-15%. Following the post-WWII Keynesian revolution and the oil shock of the early 1970s, public expenditures soared to reach levels above 50% of GDP in most countries. Over the last decade, public expenditures have somewhat retreated in Europe. The analysis contained in this paper shall therefore be read in the light of historical perspectives and current social preferences towards the extent and functions of the welfare state. It shall also recognise the strong link between taxation and the level of public expenditures, especially because of the need to ensure fiscal discipline.
Table (1): Total public expenditures as a percentage of GDP – selected countries
1880 1913 1920 1937 1960 1968 1974 1987 1995 2004
Austria n.a. n.a. 14.7c 14.8 35.7 40.6 41.9 52.4 53.2 50.6
Belgium n.a. 13.8 c 22.1 c 21.8 c 34.5 41.7 45.0 58.1 53.4 49.3
France 11.2 17.0 27.6 29.0 34.6 40.3 39.3 50.9 54.4 53.4
Germany* 10.0a 14.8 25.0 34.1 32.4 39.1 44.6 47.3 57.1 46.8
Italy n.a. 11.1 c 22.5 c 24.5 c 30.1 34.7 37.9 50.8 52.3 48.5
Netherlands n.a. 9.0 c 13.5 c 19.0 c 33.7 43.9 47.9 62.4 59.6 48.6
Spain n.a. 11.0 c 8.3 c 13.2 c 18.8 21.3 23.1 40.5 46.0 38.6
Sweden n.a. 10.4 10.9 16.5 31.0 42.8 48.1 59.4 66.8 57.3
UK 9.9 12.7 26.2 30.0 32.2 39.3 44.8 42.9 45.2 43.9
USA n.a. 7.5 12.1 19.7 27.0 30.3 31.7 36.3 35.7 36.5d
Japan 9.0b 8.3 14.8 25.4 17.5 19.2 24.5 32.7 36.3 38.2e
Sources: adapted from Maddison (1995) for 1880, Tanzi and Schuknecht (1997) for 1913-1960, OECD (1999) for 1968-1995, OECD (2005a) for 2004. Notes: For 1913 and 1920: general government expenditures. *:Western Germany for 1960-1987. a: 1881. b: 1885. c: central government. d: 2003. e: 2002. Because the table is aggregated from various sources, slight differences in the definition across years can appear.
[image:6.595.66.530.418.562.2]2. Structure of taxation in the European Union.
2.1. Total tax burden: turning the tide?
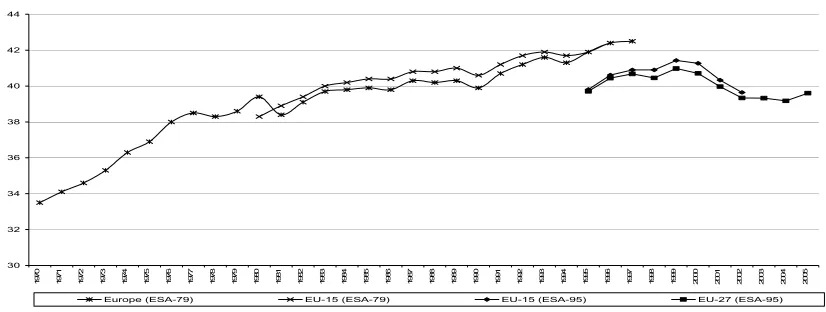
Between the early 1970s and the late 1990s, total tax burden in percentage of GDP4 has soared in the European Union5. On average, the rate of growth was of half a percentage point per year during the 1970s, a period of rapid growth of public expenditures. The growth of the total tax burden slowed down in the 1980s – with an average annual growth of less than a tenth of a percentage point per year – before growing again in the 1990s at an annual average rate of 0.3 percentage-points. The total tax-to-GDP in Europe peaked at the turn of the century before decreasing by 0.2 percentage-points per year on average. The latest data however show a pickup at the current end. Overall, the tax ratio is by now at the same level as ten yeas ago.
Figure (1): Total taxes (including SSC) in percentage of GDP.
30 32 34 36 38 40 42 44
1970 1971 1972 1973 1974 1975 1976 1977 1978 1979 1980 1981 1982 1983 1984 1985 1986 1987 1988 1989 1990 1991 1992 1993 1994 1995 1996 1997 1998 1999 2000 2001 2002 2003 2004 2005
%
G
D
P
Europe (ESA-79) EU-15 (ESA-79) EU-15 (ESA-95) EU-27 (ESA-95)
Source: European Commission (2006). Note the statistical break due to a change in classification at Eurostat. All data are GDP-weighted. Europe refers to the GDP-weighted average for Member States in the respective years.
When looking at the evolution of individual countries, several exceptions stand out. First, some countries have been particularly successful to stabilise their total tax-to-GDP ratio either from the 1970s – this is the case of Ireland and United Kingdom – and this at levels around 35%, or from the 1980s – such as Germany (at about 40%), Belgium, Luxembourg, and the Netherlands (all at about 45%). Second, the level of taxes in the economy has dramatically increased – by some 10 percentage-points – in Finland, Greece, Italy, Portugal and Spain in the 1980s and 1990s, although starting at comparatively low levels. The same 'catch-up' effect occurred in Cyprus and Malta over the last decade. Third, for the most recent period, some of the recent Member States have experienced important decreases in their total
4
Despite its simplicity – or rather because of it – the total tax-to-GDP ratio remains a rough indicator that carries interesting summary information but also suffers from deficiencies. It cannot be seen in isolation of the level of public expenditures and of the use of other alternative means for government intervention such as regulation. Moreover, total tax revenues convey very little information on the impact – in terms of distortions and in terms of redistribution – of tax systems.
5
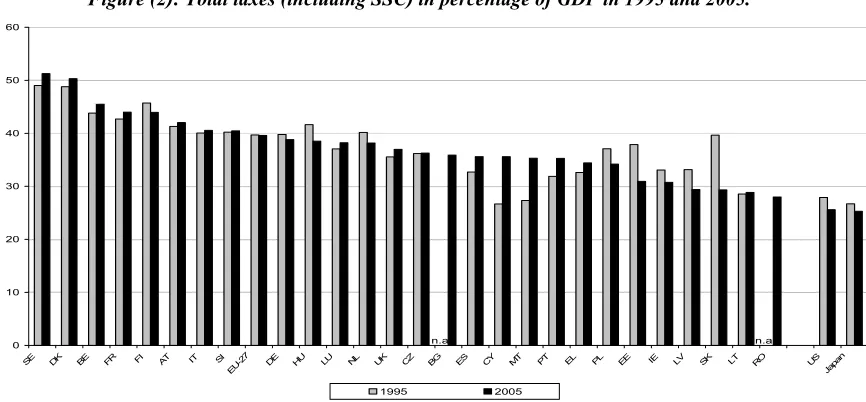
[image:7.595.97.510.254.410.2]tax burdens. This is the case of the Slovak republic (about 10 p.p.), Estonia (7 p.p.), Latvia (about 4 p.p.), Poland and Hungary (both about 3 p.p.). Interestingly, the bulk of these changes have occurred in the second half of the 1990s.
Figure (2): Total taxes (including SSC) in percentage of GDP in 1995 and 2005.
0 10 20 30 40 50 60
SE DK BE FR FI AT IT SI EU
-27 DE HU LU NL UK CZ BG ES CY MT PT EL PL EE IE LV SK LT RO US Japa
n
%
GD
P
1995 2005
n.a. n.a.
Source: European Commission (2006).OECD (2005b). US and Japan: 1995 and 2003.
Finally, about half of the Member States have experienced a decrease in their tax-to-GDP ratio between 2000 and 2005. This decrease was especially marked in Germany, Greece, Finland, the Netherlands, Slovak republic, and Sweden. In 2005, latest year available, the GDP-weighted average for the EU-27 was at 39.6%. It ranges from 28.0% in Romania to 51.3% in Sweden.
2.2. Tax systems in the European Union rest on three pillars.
Most tax systems in the world rely on three pillars: direct income taxes, indirect taxes on consumption and social security contributions. The European Union does not differ in that respect, although it generally relies proportionally more on consumption taxes (because of its developed VAT system) and on social security contribution than other developed economies (OECD, 2001). The respective shares of these three components have been quite close over time, staying within the 30-35% range. Direct taxes are quite volatile and largely influenced by the business cycle. The ratio of indirect taxes to GDP steadily increased until 1999 before slightly levelling off in the most recent years (but the share of indirect taxes in the total has increased over the last decade). This increase is due to developments in VAT collection that represented about 5% of GDP in 1970 to reach over 7% in 1999, partly explained by the creation of VAT systems in Portugal (1986), Spain (1986), Greece (1987) and Finland (1995). At 13.8% of GDP and 35% of total taxes, indirect taxes remain the main source of tax revenues in the European Union, followed by direct taxes at 13% of GDP (or 33% of total taxes). There also seems to be a trend in recent years towards more reliance on indirect taxes, as exemplified most recently by the German decision to increase VAT by three points and use part of the proceeds to cut social contributions.
[image:8.595.88.521.125.326.2]security contributions6. However, measures were mostly targeted or of limited scope so that little if any marked reduction in EU averages is visible since the turn of the century.
Figure (3): direct taxes, indirect taxes and SSC in % of GDP.
12 12,5 13 13,5 14 14,5 15 15,5
1980 1981 1982 1983 1984 1985 1986 1987 1988 1989 1990 1991 1992 1993 1994 1995 1996 1997 1998 1999 2000 2001 2002 2003 2004
% G
D
P
EU-15 (ESA-79) - share indirect EU-15 (ESA-79) - share direct EU-15 (ESA-79) - share SSC EU-15 (ESA-95) - share indirect EU-15 (ESA-95) - share direct EU-15 (ESA-95) - share SSC
Source: European Commission (2006).
Note the statistical break due to a change in classification at Eurostat. All data are GDP-weighted.
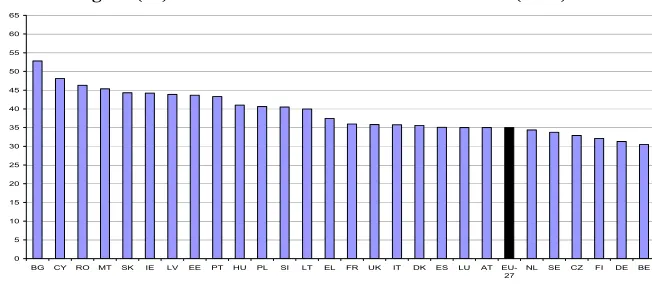
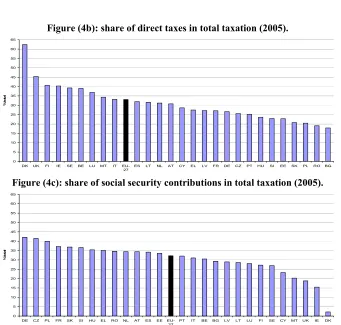
The structure of taxation varies widely across countries. The share of indirect taxes in total taxation varies from about 30% in Belgium and in Germany to around 50% in Bulgaria and Cyprus. Direct taxes take on less than 20% of total taxes collected in Bulgaria and Romania but reach over 62% in Denmark. Finally, social security contributions represent only about 2.2% of the total in Denmark but over 40% of the total in Germany and Czech Republic.7
Figure (4a): share of indirect taxes in total taxation (2005).
0 5 10 15 20 25 30 35 40 45 50 55 60 65
BG CY RO MT SK IE LV EE PT HU PL SI LT EL FR UK IT DK ES LU AT EU-27
NL SE CZ FI DE BE
%
to
ta
l
6
This development seems however mainly driven by a reduction in social security contributions for employees in France and in the Netherlands. It is unclear whether labour cost as declined as those measures have been partially compensated by personal income tax (Netherlands) or surcharges (so-called CSG in France).
7
[image:9.595.112.491.114.305.2] [image:9.595.136.462.432.576.2]Figure (4b): share of direct taxes in total taxation (2005).
0 5 10 15 20 25 30 35 40 45 50 55 60 65
DK UK FI IE SE BE LU MT IT EU-27
ES LT NL AT CY EL LV FR DE CZ PT HU SI EE SK PL RO BG
%
to
ta
l
Figure (4c): share of social security contributions in total taxation (2005).
0 5 10 15 20 25 30 35 40 45 50 55 60 65
DE CZ PL FR SK SI HU EL RO NL AT ES EE EU-27
PT IT BE BG LV LT LU FI SE CY MT UK IE DK
%
to
ta
l
Source: European Commission (2006), EU-27 is GDP-weighted. PT: direct taxes for 2004.
2.3. Taxing labour, capital or consumption.
[image:10.595.130.471.118.443.2] [image:10.595.134.465.150.303.2]Figure (5): labour, capital and consumption taxes in % GDP.
0 5 10 15 20 25
1980 1981 1982 1983 1984 1985 1986 1987 1988 1989 1990 1991 1992 1993 1994 1995 1996 1997 1998 1999 2000 2001 2002 2003 2004
% G
D
P
EU-15 (ESA-79) - labour EU-15 (ESA-79) - consumption EU-15 (ESA-79) - capital EU-15 (ESA-95) - labour EU-15 (ESA-95) - consumption EU-15 (ESA-95) - capital
Figure (6): implicit tax rates for several economic functions.
0 5 10 15 20 25 30 35 40 45
1980 1981 1982 1983 1984 1985 1986 1987 1988 1989 1990 1991 1992 1993 1994 1995 1996 1997 1998 1999 2000 2001 2002 2003 2004
%
EU-15 (ESA-79) - labour EU-15 (ESA-79) - capital EU-15 (ESA-79) - consumption EU-15 (ESA-95) - Corporate EU-15 (ESA-95) - labour EU-15 (ESA-95) - capital EU-15 (ESA-95) - consumption
Source: European Commission (2006). EU-15 is GDP-weighted.
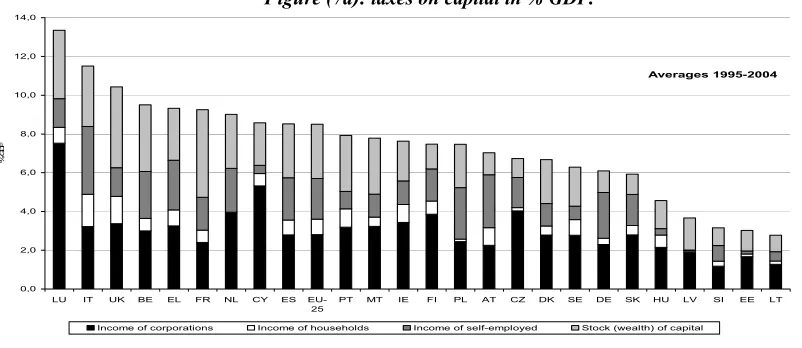
Taxes on consumption carry a relatively similar weight across Member States, but there is much more variation across Member States in the taxation of labour and capital8. Taxes on labour vary from slightly above 10% of GDP in Cyprus and Malta to over 30% in Sweden. There is also more variation over time as the weight of labour taxation in GDP decreased since the mid-1990s in most countries. EU Member States still largely rely on taxes on labour but they differ as whether those taxes are borne by employees or employers. On average, about 42% of the total taxes on employed workers are paid by employers but this share varies from 2% in Denmark to 60% in a range of countries. Interestingly, labour market reforms targeting employed workers have been focussed on reducing the burden for either employers or employees, but rarely both, and a decrease in the tax burden for one source was often partially offset by an increase in the tax burden for the other.
Figure (7a): taxes on capital in % GDP.
Averages 1995-2004
0,0 2,0 4,0 6,0 8,0 10,0 12,0 14,0
LU IT UK BE EL FR NL CY ES EU-25
PT MT IE FI PL AT CZ DK SE DE SK HU LV SI EE LT
%
G
D
P
Income of corporations Income of households Income of self-employed Stock (wealth) of capital
.
8
[image:11.595.68.532.71.283.2] [image:11.595.83.484.466.640.2]Figure (7b): taxes on consumption in % GDP.
Averages 1995-2004
0 2 4 6 8 10 12 14 16
DK HU SI FI EL SE AT EE PL UK IE LT FR PT SK LV LU EU-25
NL BE CY MT CZ IT DE ES
% GD
P
Figure (7c): taxes on labour in % GDP.
Averages 1995-2004
0 5 10 15 20 25 30 35
SE DK BE FI AT DE FR SI EU-25
HU NL IT EE CZ LU ES PL LV SK LT PT UK EL IE CY MT
% G
D
P
Employed paid by employers Employed paid by employees Non-employed
Source: European Commission (2006). EU-25 is GDP-weighted
2.4. Do the Newly-accessed Member States differ from the EU-15?
The recent accessions of new Member States have fuelled some debates in the 'old' Member States because statutory rates – notably on companies – were perceived to be substantially lower in the new Member States. In addition, some of the new Member States have cut taxes aggressively, introducing e.g. zero rates on retained profits, or embraced inherently less progressive tax models such as the so-called flat tax regime. This perceived feeling of tax competition was also fuelling fears of a failure to finance social model(s).
[image:12.595.155.447.106.263.2] [image:12.595.169.432.304.471.2]Figure (8): Evolution of statutory corporate income tax rates in the European Union.
Statutory corporate tax rates in the European Union (incl. Local taxes and surcharges)
0 5 10 15 20 25 30 35 40 45 50
1985 1986 1987 1988 1989 1990 1991 1992 1993 1994 1995 1996 1997 1998 1999 2000 2001 2002 2003 2004 2005 2006
%
EU-15 average EU-25 average NMS-10 average
Source: de Mooij and Nicodème (2006). The rates include local taxes and applicable surcharges.
During the past two decades, statutory corporate tax rates in Europe have fallen considerably, with a drop of the average tax rate in the EU-15 from slightly below 50% in 1985 to 30% in 2006. The decline in corporate tax rates has induced fears of a race-to-the-bottom in the European Union, i.e. a process in which competing governments successively undercut each others tax rates in order to attract mobile tax bases10.
Looking at the data, and contrary to common belief, the bulk of the difference in direct tax-to-GDP ratios is to be attributed to a lower collection of personal income taxes in new Member States, and not to lower corporate income taxes. Moreover, while personal income taxes in percentage of GDP is clearly below the level of the EU-15 (5.0% compared to 9.4%), the ratio of corporate income taxes to GDP in the NMS-10 still tops the one in the EU-15 (2.5% compared to 2.4%). However, some statistical artifices distort the comparison. In particular, in some large Member States such as Germany, the vast majority of companies do not pay the corporate income tax but their owners are taxed instead at the personal income tax, which artificially drives down the EU-15 average corporate tax-to-GDP. The arithmetic average personal income tax-to-GDP for the EU-15 and the NMS-10 is 10.4% and 5.7% in 2004 respectively, confirming the large difference. Furthermore, although the respective values for corporate income tax to GDP are 3.1% in the EU-15 and 2.7% in the NMS-10, this difference grows significantly if one excludes Cyprus and Malta, as the NMS-10 ratio falls to 2.3%11. Furthermore, the economies of the New Member States have been growing very fast, which boosts their tax revenues from capital.
All in all, the data are relatively inconclusive about the extent and the effects of corporate tax competition that could threaten tax collection. In particular, it is difficult to assess to what extent the above-mentioned factors are responsible for the fact that so far we do not observe a visible and marked erosion of tax collection. The large differences in statutory tax rates might also reflect a stronger choice towards lower rates and larger bases in the new Member States. However, there are limits to base widening as it cannot offset forever continuing rate cuts. Another problem is that very low corporate income tax rates threaten the
10
Enlargement has reinforced such fears as new Member States apply corporate tax rates that have gradually reached levels of more than 10%-points lower than in the EU-15 countries. See Nicodème (2007a) for a review of the literature on corporate tax competition. See also de Mooij and Nicodème (2006) for a discussion on corporate tax rates and bases developments.
11
[image:13.595.107.495.100.249.2]so-called "backstop function" of that tax, which is to protect personal income tax revenue from the risk of individuals subject to personal income tax acquire the legal form of corporations to reduce their tax bill; if this happens the erosion of tax revenues would be more apparent in the revenue from the personal income tax rather than from the corporate income tax12.
3. Recent trends in tax reforms.
Over the last years, Member States have carried out important reforms of their tax systems. These reforms were driven by several factors. First, high unemployment rates and low participation rates represent a loss of human capital and create social tensions. European Labour markets are distorted by taxes and Member States have sought to create a more employment-friendly labour taxation. Doing this, they have also faced the difficulty of finding alternative tax bases to finance their expenditures. Second, the recent trend has been towards simpler tax systems, maybe driven by the need to reduce marginal tax rates while keeping revenues constant.
3.1. Employment-friendly labour taxation.
Table (2): taxes in percentage of GDP in the EU-15.
EU-15
1995 1996 1997 1998 1999 2000 2001 2002 2003 2004
Total taxes 39.8 40.6 40.9 40.9 41.4 41.3 40.3 39.6 39.7 39.6
Indirect taxes 13.4 13.5 13.6 14.1 14.4 14.2 13.8 13.7 13.7 13.8
Of which
VAT 6.7 6.7 6.8 6.9 7.1 7.0 6.9 6.8 6.8 6.8 Excise duties 2.9 2.9 2.9 2.9 2.9 2.8 2.7 2.8 2.8 2.7 Other taxes on
products 1.7 1.7 1.8 1.8 1.9 1.9 1.8 1.8 1.8 1.9 Other taxes on
production 2.1 2.2 2.2 2.5 2.5 2.4 2.4 2.4 2.3 2.4
Direct taxes 12.5 13.0 13.3 13.7 14.1 14.3 13.9 13.3 13.1 13.1
Of which
Personal income
taxes 9.3 9.4 9.4 9.9 10.1 10.1 10.0 9.7 9.6 9.4 Corporate
income taxes 2.0 2.4 2.8 2.6 2.7 2.8 2.6 2.3 2.2 2.4 Other direct
taxes 1.2 1.2 1.2 1.2 1.3 1.4 1.3 1.2 1.4 1.4
Social Security
Contributions 14.0 14.2 14.0 13.1 13.1 12.9 12.7 12.7 12.9 12.8
Of which
Paid by
employers 7.5 7.7 7.6 7.4 7.4 7.3 7.3 7.3 7.4 7.3 Paid by
employees 4.8 4.7 4.6 4.2 4.2 4.1 4.1 4.0 4.1 4.0 Of
self-employed 1.7 1.8 1.7 1.5 1.5 1.4 1.4 1.4 1.5 1.5
Implicit taxes
Consumption 19.9 19.8 20.0 20.1 20.4 20.1 19.6 19.6 19.6 19.6 Labour 36.9 37.4 37.4 37.5 37.2 37.1 36.7 36.3 36.6 36.5 Capital 26.0 28.0 29.2 29.9 32.8 33.1 31.5 30.2 30.1 n.a. Corporate
income 17.8 20.2 22.3 21.2 23.7 23.8 24.5 21.9 20.8 n.a.
[image:15.595.107.492.78.495.2]Table (2bis): taxes in percentage of GDP in the NMS-10.
EU-15
1995 1996 1997 1998 1999 2000 2001 2002 2003 2004
Total taxes 38.0 36.8 36.2 35.8 36.0 34.7 34.5 34.9 34.6 34.5
Indirect taxes 14.6 14.5 13.9 13.7 14.0 13.5 13.0 13.2 13.3 13.7
Of which
VAT 6.3 6.4 6.8 6.7 7.1 7.3 7.1 7.3 7.3 7.7 Excise duties 3.8 3.9 3.3 3.5 3.7 3.5 3.5 3.6 3.7 3.9 Other taxes on
products 3.2 2.9 2.5 2.2 1.9 1.4 1.1 1.2 1.2 1.3 Other taxes on
production 1.3 1.3 1.3 1.3 1.3 1.3 1.3 1.1 1.0 1.2
Direct taxes 10.7 9.8 9.9 9.6 8.2 8.0 7.8 8.2 8.0 7.8
Of which
Personal income
taxes 6.7 6.7 6.5 6.5 5.2 5.0 5.0 5.1 5.0 5.0 Corporate
income taxes 3.2 2.7 2.9 2.7 2.6 2.5 2.3 2.4 2.5 2.5 Other direct
taxes 0.7 0.4 0.4 0.4 0.4 0.5 0.5 0.6 0.5 0.4
Social Security
Contributions 12.8 12.6 12.6 12.6 13.9 13.2 13.9 13.8 13.5 13.2
Of which
Paid by
employers 8.4 8.1 8.1 8.1 7.8 7.7 7.5 7.5 7.4 7.2 Paid by
employees 4.1 4.2 4.2 4.2 5.6 4.7 5.1 4.9 4.7 4.6 Of
self-employed 0.5 0.5 0.5 0.5 0.7 1.1 1.5 1.6 1.6 1.4
Implicit taxes
Consumption 23.0 22.2 21.1 20.9 21.3 20.4 19.5 20.4 20.9 21.7 Labour 38.4 37.7 37.5 37.3 39.0 36.9 36.9 37.0 36.9 38.9 Capital 22.1 19.5 21.2 18.4 20.7 20.8 21.0 22.4 19.8 n.a. Corporate
income 29.4 22.3 28.8 21.7 34.5 29.8 31.1 32.4 21.2 n.a.
[image:16.595.104.495.97.516.2]Table (3) Total tax wedge on labour.
Single person without children at average wage (100% AW)
2000 2005 Difference Part PIT (2005)
Part SSC employee (2005)
Part SSC employer (2005)
Austria 47.3 47.4 0.1 10.9 14.0 22.6
Belgium 57.1 55.4 -1.7 21.4 10.7 23.3
Czech rep. 42.7 43.8 1.1 8.6 9.3 25.9
Germany 53.9 51.8 -2.2 17.3 17.3 17.3
Denmark 44.3 41.4 -3.0 30.2 10.6 0.5
Greece 38.4 38.8 0.4 4.3 12.5 21.9
Spain 38.6 39.0 0.4 10.7 4.9 23.4
Finland 47.8 44.6 -3.2 20.1 5.1 19.4
France 49.6 50.1 0.5 10.8 9.6 29.7
Hungary 52.7 50.5 -2.2 14.3 10.0 26.3
Ireland 28.9 25.7 -3.2 11.4 4.7 9.7
Italy 46.4 45.4 -1.0 13.6 6.9 24.9
Luxembourg 38.2 35.3 -2.9 11.1 12.3 11.9
Netherlands 39.7 38.6 -1.1 9.5 19.7 9.5
Poland 43.2 43.6 0.3 5.3 21.3 17.0
Portugal 37.3 36.2 -1.1 8.1 8.9 19.2
Sweden 50.1 47.9 -2.2 18.1 5.3 24.5
Slovak rep. 41.8 38.3 -3.4 6.9 10.6 20.8
UK 32.1 33.5 1.4 15.7 8.2 9.6
EU* 45.2 44.4 -0.8 n.a. n.a. n.a.
USA 29.7 29.1 -0.6 14.6 7.3 7.3
Source: OECD, Taxing wages report. * GDP-weighted average for those countries above. From January 2005, Slovak Republic has introduced the fully funded pillar. Under this system, 9 percentage point of the social security contributions paid by the employer to the pension insurance go directly to pension funds and not to the social insurance company as previously. The pension funds are treated outside of the general government so that these contributions are not accounted for in the OECD calculations. Hence, the 2005 employers' social security contributions are assumed to be 26.2% (OECD, taxing wages report).
As documented in table (3), tax wedges on labour remain high in most countries, reaching 50% in several Member States. Looking at the size and components of the tax wedge, it can be seen that the lion's share (about 45%) of the total tax wedge is accounted for by employers' social security contributions, while the remaining is made up of personal income taxes (30%) and employee's social security contributions (25%). This situation contrasts with the US, for which the total tax wedge is about a third lower than in Europe and equally borne by personal income taxes and social security contributions14.
14
[image:17.595.65.536.83.374.2]Member States have carried out many reforms, with a majority of them paying particular attention to the reduction of taxes on labour for low-skilled workers and making work pay. The reductions in personal income taxes and social security contributions have often been accompanied by increases in tax allowances. In 2005, the GDP-weighted personal income taxes in the EU-27 were at 9.2% of GDP, the same level as 1995. In the same period, social security contributions paid by employers decreased from 7.5% to 7.3% of GDP and those paid by employees declined from 4.7% to 4.0% of GDP. The total decline in taxation of labour corresponds therefore to about slightly more than 1% of GDP15.
Figure (9): Evolution of the components of labour taxation in % GDP 1995-2004.
-6,0 -5,0 -4,0 -3,0 -2,0 -1,0 0,0 1,0 2,0 3,0
PL EE SI IE SK LV NL FI LU HU DK DE EU-25
ES BE CY AT IT SE LT UK FR CZ PT EL MT
% G
D
P
Personal Income taxes SSC employees SSC employers total
Source: European Commission (2006). EU-25 is GDP-weighted. Portugal: 1995-2003. Slovak republic: 1995-2003 for personal income taxes.
3.2. Tax simplification and tax-cuts-cum-base-widening tax reforms.
Recently, Member States have shown a trend towards simplifying their tax systems. In the absence of comprehensive tax reforms, targeted tax reforms may have accumulated and rendered the system very complicated with sometimes measures with conflicting effects. Tax systems are frequently used to provide a favourable treatment to specific tax-payers or activities. These special provisions are called 'tax expenditures' and can take various forms16. Governments may provide exemptions for certain types of income. They can also take the form of deductions from taxable income, tax credits, and special rates relief, accounting conventions or deferral possibilities. Such tax expenditures are not always easy to detect or quantify but they are considered to be sizeable. They are a substitute for direct cash or in-kind public expenses and can be a powerful instrument to encourage certain types of behaviour that are deemed desirable by tax authorities. Examples include encouraging home-ownership, supporting private gifts to charities, pushing for energy-saving investment, or trying to raise maternity rates. Going through the tax system may be a good idea if this requires less marginal administrative costs compared to setting up new specific programs. However, the experience with tax expenditures calls for caution. Tax expenditures may sometimes induce
[image:18.595.149.463.187.374.2]
effects that are in opposition to the intended ones17 and they in addition may distort the features of income tax systems. Deductibility is indeed often done at the highest marginal income tax rate, meaning that high-revenues taxpayers benefit the most from those measures. This can dramatically reduce the effective progressivity of tax systems. In addition, they are subject to less public or parliamentary scrutiny than direct expenditures, which make them popular to lobbies, and they complicate the tax system. Their level is also more subject to cyclical and behavioural fluctuations than fixed direct expenditure18. Finally, they narrow the tax base, which limits the scope for tax rates reductions and may decrease efficiency. Such tax expenditures shall therefore rather been used by parsimony and in well-defined situations19.
A parallel trend has been to accompany the simplification of the tax system – allowing often for a widening of the tax base – with a reduction of marginal tax rates. For personal income taxes, one has observed a clear reduction in the number of tax brackets with a decrease in marginal tax rates either at the low-end or at the top-end, if not both. The base-widening-cum-tax-cuts strategy has obviously also been applied to corporate taxes for which statutory rates have declined and the tax base has widened – for a great deal thanks to the abolition of a multitude of special regime (sometimes within the framework of the code of conduct). Turning to international activities, we have seen above that the absence of a multilateral tax treaty or common rules in personal income taxation is an important hurdle to labour mobility in Europe. A similar problem applies with taxation of capital as studies show that exchange of information between tax authorities is not well-developed20. There seem also to be large difficulties in VAT, despite the harmonization of the tax base and cooperation between tax authorities. A recent survey21 on 700 European companies stressed difficulties for repayment and refund of VAT, especially coping with procedures for refunds, such that an estimated 53.5% of large companies have not requested refunding at some point. Finally, in the specific case of corporate income taxation, the difficulty to deal with 27 accounting and tax systems, the uncertainties in the treatment of transfer pricing as well as the general absence of cross-border loss relief are seen as a major tax obstacle to doing business on a pan-European basis.
An interesting case in the trends towards simplification is the flat tax which cumulates some of the arguments developed here above as its proponents see it as reducing the burden on labour and stimulating labour supply, reducing the tax on high-wage workers to avoid their move, and simplifying the tax system. Personal income tax systems in most developed countries have increasingly been perceived by public opinions as too complicated with many variables to account for and a high compliance cost. This perception also coincides with trends towards downsizing the role of governments. Hence, the belief that simple taxation is necessarily good taxation has emerged. The same drift believes that the existence of multiple tax brackets is itself a factor in the complexity of the tax systems while in fact this is the simplest part of the tax declaration and computation22. Given this background, one form of taxation has naturally attracted a lot of attention over the last years: the flat tax. The flat tax
17
This can be for example the case in housing taxation where tax deductibility of mortgage interest and/or capital payments – a measure intended to help first-time owners – may simply translate into higher property prices.
18
Arguably, this may be a good thing if counter-cyclical.
19
Removing tax expenditure may however prove politically difficult because losers are large and concentrated while winners are dispersed.
20
See Keen and Ligthart (2005, 2006).
21
European Commission (2004).
22
debate really started in 1983 following the release of Robert Hall and Alvin Rabushka’s book on flat tax. The debate was rather US-centred – given the complexity of the US tax code – and attracted publicity during the 1992 and 1996 US presidential campaigns. It regained vigour in the recent years in the EU with enlargement to countries that have adopted such a system. Most scholars date the beginning of the flat tax experiment in 1994 in Estonia, which introduced a single uniform rate of 26% on personal incomes. Actually, some dependent territories seem to have introduced such a system as soon as the 1940’s. Today, at least twenty-two countries (of which five current Member States) have introduced a flat tax, but the detailed provisions vary a lot across countries23. Discussions on the flat tax have also occurred in many western European countries but in all countries, "a notable and troubling feature (…)
is that it has been marked more by rhetoric and assertion than by analysis and evidence"24.
Table (4): Flat taxes on personal income in the world.
Country Flat Tax Rate Year of
introduction
Country Flat Tax Rate Year of
introduction
Jersey 20% (i) 1940 Iraq 15% 2004
Hong Kong 16% (ii) 1947 Slovak rep. 19% (vii) 2004 Guernsey 20% (i),(iii) 1947 Georgia 12% (x) 2005
Jamaica 25% 1980 Romania 16% 2005
Bolivia 10%(iv) 1986 Kyrgyzstan 10% 2006
Estonia 26% (v) 1994 Paraguay 10%(xi) 2006
Lithuania 33% (vi) 1994 Macedonia 12% (xii) 2007
Latvia 25% (vi) 1995 Iceland 35.73% (xiii) 2007
Russia 13% (vii) 2001 Mongolia 10% 2007
Serbia 14% (viii) 2003 Mauritius 15% 2009
Ukraine 13% (ix) 2004 Tonga 10%(xiv) n.a.
Source: Rabushka (2007), The Economist (2005), Teather (2005), Grecu (2004), Bird (1992). Tax rates at the time of introduction. (i) Applied to personal and corporate incomes for both Jersey and Guernsey. None have VAT. The channels islands do not tax dividends, interest or capital gains. (ii) Taxpayers have the choice between being taxed at a 16% flat tax or under a progressive tax system with marginal tax rates ranging from 2 to 20%. Hong Kong does not tax dividends, wealth,
and capital gains and has no VAT, sales tax or payroll tax. (iii)Capped at £250,000, making it therefore regressive as soon
as revenues reach £1,250,000. From 2007, the corporate tax rate is reduced to zero. (iv) 13% since 1992. The tax base is all income (wages, salaries, rentals, interest, royalties, etc.), except foreign-income and capital gains which remain tax-free. There is also a general allowance equivalent to two (previously four) monthly minimum wages (this minimum wage is about Bs 240 or USD 45). The system is designed to fight VAT fraud, so that individuals can offset against this tax the VAT paid, provided they have invoices or receipts. (v) Reduced to 24% in 2005, 23% in 2006, 21% in 2007, 20% in 2008. Estonia has a zero corporate tax rate on retained earnings but taxes distribution (mainly dividends) at 21%. This is accompanied by a general non-deductibility of interest payments. (vi) Both Lithuania and Latvia’s corporate tax rates are set at 15% in 2007. (vii) Accompanied by a 24% corporate tax rate. (viii) On both corporate and personal incomes. (ix) 15% since 2007. (x) With no basic allowance. (xi) VAT paid is tax deductible. (xii) 10% from 2008. (xiii) Corporate tax rate is at 18% and capital income taxed at 10% under a Dual Income Tax System. (xiv) Above 2,500 USD. The date of implementation is unknown. The following countries have no tax on personal income: Andorra, the Bahamas, Bahrain, Bermuda, Burundi, Cayman Islands, Kuwait, Monaco, Nigeria, Oman, Qatar, Saudi Arabia, Somalia, United Arab Emirates, Uruguay and Vanuatu.
Flat taxes seem particularly attractive because their proponents propose low levels of tax rates. However, one problem with this is that the low rates are not by themselves a characteristic of the flat tax. Another argument is that flat taxes are attractive because they are transparent and easy to administrate. Transparency is indeed an interesting feature of the flat tax, notably because each worker knows about its marginal tax rate (something more difficult to assess in a progressive tax system). It shall be nevertheless said that because social security contributions continue to be non-proportional due to ceilings or progressivity, and because
23
[image:20.595.70.528.237.394.2]these contributions have generally gained importance in countries having adopted a flat tax structure, effective taxation on labour is far from being flat in practice25. Flat taxes are also easy to administrate because they are usually accompanied by a removal of most (complex) tax deductions from the tax base to replace them with a general tax allowance. However, it is difficult to quantify the exact saving by tax administrations and the few studies available so far tend to give unrealistically high estimates.
Proponents of the flat tax also claim that it raises more tax revenues, because of an alleged Laffer curve effect. It is indeed true that tax revenues have increased in some countries after the flat tax has been introduced - albeit not in all of them – but research has not found Laffer effects or sizeable labour supply effects26. It seems that a large part of the outcome was due to the fact that the introduction of the flat tax was generally accompanied by stricter rules to combat tax fraud and improve compliance. It is therefore far from being clear-cut whether these positive results can be reproduced in all countries, especially those with allegedly lower tax fraud. Next, reforms towards flat taxes are not neutral in terms of redistribution. These effects obviously depend on the details of each single proposal. However, flat tax reforms tend to favour the lower-end and top-end classes of revenues whilst increasing the tax burden on the middle-class27. Finally, because there is a tax-free allowance, a flat tax is still a progressive tax (maybe less sharp than in the case of a progressive system with several tax brackets although here again it depends on the details of each system).
At the end of the day, the choice of whether adopting a flat tax relates to the degree of redistribution that shall be achieved by taxation, the choice of how to tax capital and labour and the desired equity-efficiency trade-off. For some of the EU Member States, the level of revenues currently collected by the personal income tax is relatively high so that the flat tax system would have to apply a relatively high rate and a small allowance to be revenue-neutral. This is not necessarily a benign scenario, especially in terms of redistribution.
4. The challenges ahead.
4.1. The consequences of ageing and globalisation.
The demographic transition and ageing population in the EU raises many challenges and issues in terms of the structure of taxation. The economic impact of ageing will be severe and diverse28: productivity will become the predominant source of growth because of a shrinking working-age population leading (with unchanged policies) to a fall in potential growth rates. A key challenge will be to develop labour market policies and reforms in the tax and benefit systems aimed at increasing labour supply and further reforms of the welfare state that guarantee the long-term sustainability of public finances in the face of these demographic developments. What seems a likely development for the future is that the financing of the welfare state may have to rely less on labour taxes and, in case of a decline in savings arising
25
Keen, Kim and Varsano (2006), page 5. In particular, if social security contributions are taken into account.
26
Keen, Kim and Varsano (2006).
27
In a recent study for Germany, Fuest, Peichl, and Schaefer (2007) use micro data to analyse the effects of a revenue-neutral flat tax on the German economy. They found that all scenarios - combining a flat rate and an allowance - yield an increase in inequality and redistribution in favour of the highest incomes. In most scenarios, the middle-class is the main loser and the poorest also somewhat loose. In terms of efficiency, all scenarios lead to a decrease in labour supply, the more so with lower marginal rates and smaller allowance. Finally, in terms of welfare, scenarios with high rates and high allowances lead to large decrease in welfare while those with low rates and allowances lead to small welfare gains but concentrated mainly in the highest decile.
28
from demographic transition, also less tax revenues from savings (although the net effect will also depend on interest rates).
Taxes are used to finance public expenditure, among which social spending represents a sizeable share. In 2003, gross average social protection expenditure accounted for 28% of GDP in the EU-2529. The major share of it related to old age and survivors' benefits. This share was at 45.7% of the total on average but reached more than 50% in several Member States. In addition, expenditure on sickness and health care and on disability represented the second and third sources of social expenditure in the EU-25 with respectively 28.3% and 8.0% of the total. The coming challenge of ageing is likely to increase the need for these categories of social spending and to decrease the labour tax base30. Empirical studies31 suggest a negative correlation between the dependency ratio and both tax rates and the generosity of social transfers. They also suggest that the tax-contribution rates that would balance social security systems in the future are much higher than current statutory rates32. This therefore calls for reforms now as to avoid larger pains in the future.
Another point of concern for tax authorities is the potential effects of globalisation and tax competition that could force them to shift the tax burden from (geographically) mobile to immobile tax bases. The impact of tax competition has been the focus of a sizeable amount of academic research33, especially in relation to corporate taxation. As we have seen above, statutory corporate tax rates in Europe have fallen considerably during the last 25 years and this decline in corporate tax rates has induced fears of a race-to-the-bottom in the European Union. This could ultimately erode corporate tax revenues and impose a threat to the financing of the European welfare states.
One important question is of course whether the decline in corporate tax rates is the result of tax competition and whether there is a "race to the bottom". Several authors have tried to estimate whether jurisdictions of various natures were setting taxes in an interdependent fashion. Many studies found some form of interaction, although the choice of tax indicators is extremely important34. In addition, even if accepting that there are tax setting interactions, there is uncertainty in the literature about the reason behind these interactions, that is, whether it is the result of tax competition to attract mobile tax bases, treasury effects35, yardstick tax competition in which countries try to mimic each other’s tax policy or simply convergence across countries in economic structures and/or dominant economic thinking. Indeed, despite the reduction in corporate tax rates, corporate tax revenues have maintained remarkably stable and actually increased somewhat during the last decade.
29
See Eurostat (2006).
30
On the revenue side, the main sources of funding of social protection are social contributions with 60% and general government contributions derived from taxes at 37% in 2003 (Eurostat, 2006). The share of social contributions in the total receipts for funding social protection has declined over time, although remaining the main source, and general government contributions have increased in proportion.
31
See Razin, Sadka, and Swagel, (2002).
32
Razin, Sadka and Woon Hang (2005).
33
Figure (10): Corporate income tax in percentage of GDP.
Taxes on corporations as percentage of GDP (1980-2004)
0 0,5 1 1,5 2 2,5 3 3,5
1980 1981 1982 1983 1984 1985 1986 1987 1988 1989 1990 1991 1992 1993 1994 1995 1996 1997 1998 1999 2000 2001 2002 2003 2004
% o
f
G
D
P
EU-25 EU-15 NMS-10
Source: Structures of taxation systems - DG TAXUD GDP-Weighted
EU-15 NMS-10
EU-25
Source: European Commission (2006). Measures are GDP-weighted.
Apparently, the corporate tax base has broadened, which made up for the revenue losses from rate reductions. However, several studies suggest that base broadening is unlikely to have been sufficient to make up for the ex-ante revenue losses from rate reduction. An increase in the profitability of companies has been another candidate for (partially) explaining this puzzle. The problem is that measures do not univocally show a large increase in profitability. Finally, some studies36 point to the possibility that falling corporate tax rates and a widening of the gap between personal income and corporate income taxes have created incentives for entrepreneurs to incorporate. This is important because it means that one possible effect of corporate tax competition is to shift some tax revenues from the personal income to the corporate income.
The mobility of capital can also take various forms, which render the analysis of a potential shift even more complicated. Usually, it is thought through the relocation or the development of real activities. For example, the median value of the semi-elasticity of tax to FDI shows that an increase in the tax rate by one percentage-point will reduce FDI inflows by 2.9%37. Several other studies also show that taxation has an impact on location decision38. Furthermore, recent research39 has shown that profit-shifting activities in the form of transfer pricing or debt-shifting were sizeable. All this suggests that the mobility of capital may erode some tax bases, whether the capital one or even the labour tax base. The mobility of labour is even more complex to study. In recent years, there has been an increasing amount of special regimes for expatriates and wealthy workers. The general view however remains that taxation is a major obstacle to labour mobility alongside difficulties in social security and pension portability. The general recommendation of the OECD is that workers shall be taxed in the country where they spend 183 days a year. This rule does not apply however to the increasing
36
See de Mooij and Nicodème (2006).
37
De Mooij and Everdeen (2006)
38
For example, Devereux and Griffith (1998).
39
[image:23.595.135.466.182.366.2]number of workers who are sent across Europe for short-term missions as they may end up spending less than 183 days in any of the countries. They then have to refer to all bilateral tax treaties. This creates a lot of uncertainty and risks of no or double taxation, especially since the rules may differ across tax treaties and not all Member States has a tax treaty with all the others. The absence of a multilateral tax treaty or common rules is an important hurdle to labour mobility in Europe.
The analysis of a possible tax shift from mobile to immobile tax bases is complex because the effects can take various forms. A more formal analysis by way of regressing the changes in the ratio of labour taxes in percentage of GDP on the changes in the ratio of capital taxes in percentage of GDP does not bring statistically significant results. Figures (5) and (6) above, respectively showing capital and labour in percentage of GDP and in percentage of their own tax base does not suggest either that a major shift may have occurred. More in-depth analysis may however be needed. It is possible for example that the distinction between capital and labour as representing mobile and immobile tax bases is ill-defined and that the analysis shall have to distinguish between mobile and immobile categories in both capital and labour factors.
More in-depth studies40 show that notwithstanding increasing integration and globalisation, there is still room for independent economic policies and that the views that globalisation has altered the composition of government expenditures and reduced its financing are not fully supported by empirical analysis. Several explanations have been put forward. First, the share of mobile activities in total taxes is still relatively small. Second, globalisation may equally increase profitability and hence tax revenues, for any given tax rate. Third, on the expenditure side, globalisation may increase the need for more social spending.
In conclusion, globalisation and ageing have raised the issue of the financing of the European Social Model(s). Ageing will put more pressure on public spending and on some categories of tax revenues. At the same time, globalisation may render it increasingly difficult to collect taxes from mobile tax bases. The need for financing may well lead to a need to increase tax rates41. There is therefore a need to find alternative means of financing by ways of robust tax revenues. This may well request a more efficient tax structure that is broad, simple, non-fraud prone, and that allows Member States to pursue their objectives in term of equity and efficiency. The next section reviews several options.
4.2. The quest for alternative tax bases.
Various options for alternative tax bases are under discussion. Some of the main one concern a shift from low-income to high-income workers, a shift from labour to capital, an increasing use of environmental taxes, or greater reliance on immovable property or consumption as a tax base. Ideally, the new tax base shall be wide to be able to impose a low tax rate and minimize distortions, as well as stable as to ensure certainty in revenue collection.
Some countries, starting from Scandinavian countries in the early 1990s, have introduced a dual income tax system that tax personal capital income at low and proportional tax rates while keeping higher and progressive tax rates on labour income. One of the objectives of such a move has been to reduce the incentives for capital exports and tax avoidance and evasion.
will have a positive effect on employment because it stimulates wage moderation. Alternatively, if the labour market is competitive, such an increase will have a negative effect on employment because of the substitution effect from consumption to leisure. The overall effect ultimately depends on the respective wage elasticities of low-paid and high-paid workers. To the extent that it is much higher for workers at the low-end, an increase in progressivity may both increase employment and reduce the overall excess burden of the tax. There is however a growing constraint to this. The international mobility of skilled workers and the possibility to change the "label" of labour income (especially for self-employed) to capital income puts a limit to top marginal personal income tax rates.
The debate has also revolved around the possibility of shifting the tax burden from labour to capital. Such a shift has been popular among some policy-makers because there is a perception that globalisation was shifting the tax burden the other way around and that some correcting measures would be politically desirable. Such move has not really happened so far because it faces two major constraints. First, the capital tax base is smaller than the labour tax base and would therefore require a much higher tax rate to be revenue-neutral, probably leading to big distortions. Second and foremost, capital is much more mobile and this creates difficulties to enforce taxation in the absence of international coordination. In addition, economic theory shows that the burden of taxing the mobile tax base (capital) ultimately falls on the immobile factors (labour and land) because, in the absence of location-specific rents, the emigration of the mobile factor lowers the productivity of the immobile ones. It will reduce domestic immobile factors incomes by more than the amount of the tax collected from the mobile factor and it would therefore be better to directly tax those immobile factors - especially because, by doing this, one avoids the additional tax distortion on the immobile factor42.
An interesting alternative tax base is a tax on polluting activities. Environmental taxes are a classic case for applying Pigouvian taxation that discourages the consumption of de-merit goods or "bads". A lot of ideas have been launched recently, especially as the debate on the need to act against global warming is heating up. For example, car taxation will be based to a large extent in the future on their emissions. Some proposals have also been made to modulate property taxes with the degree of insulation of the habitation or to tax products based on the pollution created by their fabrication process. It seems however that despite some remarkable exceptions, going from rhetoric to practice has proven hard in most Member States. Over the last ten years, the EU-25 GDP-weighted average level of environmental taxation has declined from 2.8% of GDP to 2.6%43. It is true that a sizeable amount of environmental non-tax instruments of command and control exist and that, in theory, an efficient green tax is one that deters polluting activities instead of collecting revenues (that is that the amount of the tax is optimally set at the level that internalises the externalities). However, the pessimistic view is that the low collection results rather from the fact that environmental taxes are not widely used.
42
Razin and Sadka (1991). Note that the incidence of a tax on savings can be different than the incidence of a tax on investment, especially if countries are price-taker. The same goes for the tax elasticity of FDI and of savings, which could be different and differ. One shall therefore qualify the type of capital that is considered.
43
Figure (11): environmental taxes in percentage of GDP.
0,0 0,5 1,0 1,5 2,0 2,5 3,0 3,5 4,0 4,5 5,0
DK CY NL SI LU FI MT PT SE IT HU CZ AT UK EU-25
LV DE IE BE EL PL EE FR ES LT
% GD
P
1995 2004
1999 2003 2002
Source: European Commission (2006).
Next, taxes on immovable properties (real estate) could be an alternative instrument to raise additional revenues because they are difficult to relocate. The share of taxes on immovable properties in total taxes remains low in most Member States at between 1 and 3%44. One specific problem of property taxation is that, to favour home-ownership, some Member States are offering deductions of interest and/or capital payments to the personal income tax base. Those reductions have potential perverse effects as they may simply increase demand and prices45. Alternatively, registration taxes on properties create a sunk cost and may reduce the liquidity of the asset, with adverse consequences on the mobility of labour. Taxes on real estate also carry two additional problems. First, the tax is generally local in many Member States so that an increase of this type of taxes to finance a reduction in labour taxes may require institutional arrangements. Second, the valuation of the tax base differs a lot across countries and may not well reflect the benefits, in particular because many countries apply outdated values.
Finally, a widely-discussed alternative would be to shift the tax burden from labour to consumption. The choice between taxing consumption or income has been the focus of a large amount of theoretical and empirical research. Both types of taxes discourage work by leaving leisure untaxed. However, consumption taxes treat current and future consumption in the same way while income taxes impose a higher burden on future consumption, discouraging savings. The intuition behind this result is that under a consumption tax46, savings can be accumulated tax-free. This can increase investment, raise the capital stock, and boost
44
Own calculations based on OECD (2005b).
45
[image:26.595.140.460.150.360.2]productivity and the size of the economy47. The tax can be indirect (possibly with differentiated tax rates) and applied to commodities, or it could be direct and applied on expenditure. In this latter case, the tax base is the income minus the savings. Taxing consumption rather than income is also often seen by policy-makers as positive because it applies to a larger tax base, which shall allow a lower tax rate and hence reduces distortions. Although theoretically the tax base for consumption shall be smaller than the one for income (because consumption taxes, unlike income taxes, leave savings untaxed), multiple exemptions for taxation of income may make the base larger in practice48. Next, Consumption taxes may also allow taxing elements that may be hidden from the income tax declaration. Consumption taxes are however not exempt of fraud either. Finally, consumption taxes also solve some of the inequities linked with the timing of income collection. Under a classical progressive income tax, receiving revenues on one single occasion will push the taxpayer into higher marginal tax rates compared to a taxpayer that earns the same amount but over several periods. One shall note however that this argument holds only if the consumption tax is proportional and the income tax progressive, two conditions that may not hold in practice.
The main objection against consumption taxes is that they are seen as regressive, falling more heavily on those with lower incomes. This can be true if the ratio of consumption to income falls with higher incomes and if there is a decreasing marginal utility of revenues. One counter-argument however is that consumption taxes can be made progressive. Such a system would be similar to those on income taxes in the case of an expenditure tax and differentiated tax rates or with a system of allowances in the case of commodity taxation. In practice, many countries apply low VAT rates on goods considered as basic needs, although the theoretical case for using commodity taxation for redistribution purposes is far from obvious in the economic literature (Atkinson and Stiglitz, 1976). Another objection is that (commodity) consumption taxes may be less visible because the consumer pays little by little over his/her consumption patterns and he/she may also not notice the tax if prices are shown tax-included. This lower visibility may increase acceptance.
In practice, countries do not necessarily face a choice between consumption and income taxes as many of them have both. In addition, most consumption taxes and income taxes depart from their standard models and are actually hybrid systems. There is widespread feeling that countries have increasingly relied on consumption taxes over the last decade, although the figures do not necessarily suggest substantial changes49. A dramatic move from income to consumption taxes – possibly to finance the welfare state – would carry important transition problems, not the least the problem of the retired generation who would then have paid high taxes on their income when active and now face high taxes on their consumption once retired.
5. Conclusions.
Over the last few years, we have witnessed a certain stabilisation in the overall tax burden. This follows many years of increasing tax burdens in most Member States, reflecting increasing public expenditures. More recently, overall levels of expenditure have started to be
47
Internal simulations within the European Commission suggest that the long-run GDP and employment effects of a standardised 1% of GDP shift from wage to VAT are both about 0.14% if benefits are exogenous and about 0.07% if benefits are indexed to consumer prices.
48
In the EU, the tax base for consumption taxes is approximately a third higher than the tax base for labour (i.e. total amount of gross compensation per employee).
49
reduced in an effort to consolidate public finances, followed to some extent by some reduction in revenues as a percentage of GDP since the peak in the late 1990s.
Member States have recently carried out major reforms of their tax systems and these reforms have been driven by several interrelated factors. First, the growing awareness that an excessive tax burden on labour and its interaction with the benefit systems lowers work incentives has led Member States to move towards a more employment-friendly labour taxation. Second, Member States have endeavoured to rationalise and simplify their tax systems, almost always by broadening the tax base in order to reduce the tax rates. Finally, European Member States are facing two main challenges, globalisation and ageing, which have raised the issue of how the social models in the European countries should be financed. These latter challenges may impact both their need and their capacity to collect taxes. Ageing will increase some social spending while reducing the potential of some tax bases such as labour. Globalisation has the potential to increase the mobility of capital and of high-skilled workers, making it more difficult to rely on them as a source of revenues. The desire to shift tax away from labour and to make work pay while retaining the social models will force Member States to find alternative robust tax bases. This paper reviews the most recent trends in taxation in the European Union and discusses several tax policy issues in the light of the main challenges mentioned above.
The policy goal of pursuing further reductions in labour taxes, given notably the pressing need to complete the consolidation of public finance raises difficult political and practical issues. Against this background, revenue-neutral tax reforms deserve particular attention. This implies that Member States have to look for robust alternative tax bases to labour taxation to finance the welfare state. Ideally, new tax bases should be wide – so that a low tax rate can be imposed and distortions minimised – and stable – so as to ensure certainty in revenue collection. Several options are possible, ranging from an increasing use of environmental taxes, a greater reliance on real estate or a shift towards consumption as a tax base. All solutions present advantages and disadvantages, as well as practical constraints. This may also be why, in practice, shifts have so far been relatively limited.
References.
Arpaia, A. and Carone, G. (2004). Do labour taxes (and their composition) affect wages in the short and the long run? Economic Paper. No. 216. European Commission.
Atkinson, A.B. and Stiglitz, J. (1976). The Design of Tax Structure: Direct versus Indirect Taxation. Journal of Public Economics. 6:55-75.
Barr, N. (1992). Economic Theory and the Welfare State: a Survey and Interpretation. Journal of Economic Literature. 30: 741-803.
Bird, R.M. (1992). Tax Reform in Latin America: A Review of Some Recent Experiences. Latin American Research Review, 27(1): 7-36
Carone, G. and Salomaki, A. (2001). Reforms in tax-benefit systems in order to increase employment incentives in the EU. Economic Paper. No. 160. European Commission.
Carone, G.; Costello, D.; Diez Guardia, N.; Pryzwara, B.; and Salomaki, A. (2005). The economic impact of ageing populations in the EU25 Member States. Economic Paper. No. 236. European Commission.
Cigno, A. (2006). Is there a social security tax wedge?, CESifo Working Paper No. 1172.
Economist, The(2005). The Flat Tax Revolution. April 16th, 2005, page 9.
European Commission (2000). Structures of Taxation Systems in the European Union: 1970-1997. Brussels. European Commission (2004). European Tax Survey. SEC(2004)1128.
European Commission (2006). Structures of Taxation Systems in the European Union: 1995-2004. Brussels. European Commission and European Policy Committee (2006), The impact of ageing on public expenditure: projections for the EU25 Member States on pensions, health care, long-term care, education and unemployment transfers (2004-2050), European Economy. Special Report no.1/2006.
Eurostat (2006). Social Protection in the European Union. Statistics in Focus. 14/2006.
Fuest, C., Peichl, A. and Schaefer, T. (2007). Is a Flat Tax Pilitically Feasible in a Grown-Up Welfare State? FIFO-CPE Discussion Paper, No.07-6.
Greçu, A. (2004). Flat tax: the British case. Adam Smith Institute, available from:
http://www.adamsmith.org/images/uploads/publications/flattax.pdf
Hagemann, R.P., Jones B.R. and Montador, R.B. (1987). Tax Reform in OECD Countries: Economic Rationale and Consequences. OCED Working Papers, No. 40. August.
Hall, R.E. and Rabushka, A. (1983). Low Tax, Simple Tax, Flat Tax. New York. McGraw-Hill.
Hines, J.R. (2006). Will Social Welfare Expenditure Survive Tax Competition? Oxford Review of Economic Policy. Vol. 22(3): 330-348.
Huizinga, H. and Laeven, L. (2006). International profit shifting within multinationals: a multi-country perspective. Economic Paper. No. 260. European Commission.
Huizinga, H., Laeven, L. and Nicodème, G. (2006). Capital Structure and International Debt Shifting. Economic paper. No. 263. European Commission.
Keen, M., Kim, Y. and Marsano, R. (2006). The 'flat tax(es)': principles and evidence. IMF Working Paper, No. 06/218.
Keen, M. and Ligthart, J.E. (2005). International Information Sharing and International Taxation: a primer. International Tax and Public Finance. 13(1): 81-110.
Keen, M. and Ligthart, J.E. (2006). Incentives and Information Exchange in International Taxation. International Tax and Public Finance. 13(2-3): 163-180.
Maddison, A. (1995). Monitoring the World Economy 1820-1992. OECD, Paris.
Mooij, de, R. and Ederveen, S. (2006). What a difference does it make? Understanding the empirical literature on taxation and international capital flows. Economic Paper. No. 261. European Commission.
Mooij, de, R. (2006). Reinventing the Welfare State. CPB Netherlands.
Mooij, de R. and Nicodème, G. (2006). Corporate Tax Policy, Entrepreneurship and incorporation in the EU. Economic Paper. No. 269 and CESifo Working paper, No. 1883.
Musgrave, R. A. (1985). A Brief History of Fiscal Doctrine. Handbook of Public Economics. 1:1-59.
Nicodème, G. (2007a). Corporate Tax Competition and Coordination in the European Union: What Do We Know? Where Do We Stand? in 'International Taxation Handbook', Gregoriou and Read eds. Elsevier.
Nicodème, G. (2007b). Flat Tax: Does One Rate Fit All? Intereconomics. 42(3): 138-142. OECD (1996). Tax Expenditures: recent experiences. Paris.
OECD (1999). OECD Historical Statistics: 1960-1997, Paris.
OECD (2001). Tax and the Economy: a comparative assessment of OECD Countries, Paris. OECD (2005a). OECD in figures – 2005, Paris.
OECD (2005b). Revenue Statistics 1965-2004, Paris. OECD (2006). Taxing wages. Paris.
Rasmussen, B. S. (1997a). Long run effects of employment and payroll taxes in an efficiency wage model. University of Aarhus Working Paper. No.8.
Rasmussen, B. S. (1997b). Non equivalence of employment and payroll taxes in imperfectly competitive labour markets. University of Aarhus Working Paper. No. 22
Razin, A. and Sadka, E. (1991). International Tax Competition and Gains from Tax Harmonization. Economic Letters. 37: 69-76.
Razin, A.; Sadka, E. and Swagel, P. (2002). The Aging of the Population and the Size of the Welfare State. IMF Working Paper, No. 02/68.