Considerations concerning the analysis of the wage costs efficiency
Full text
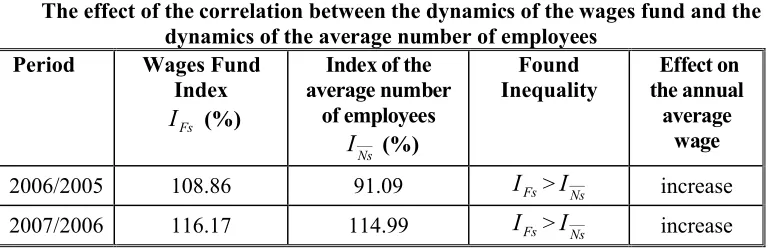
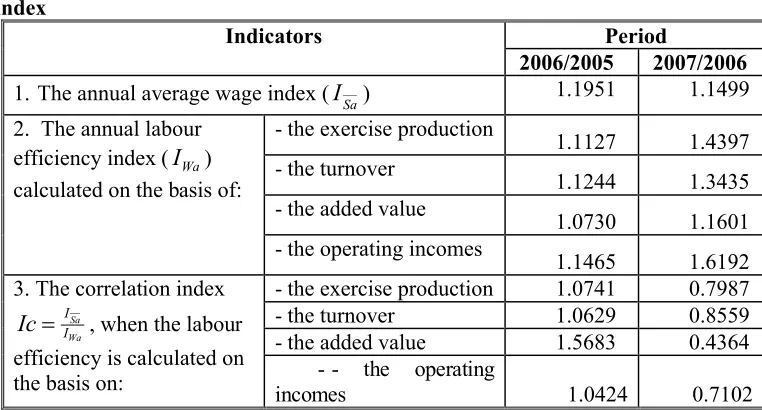
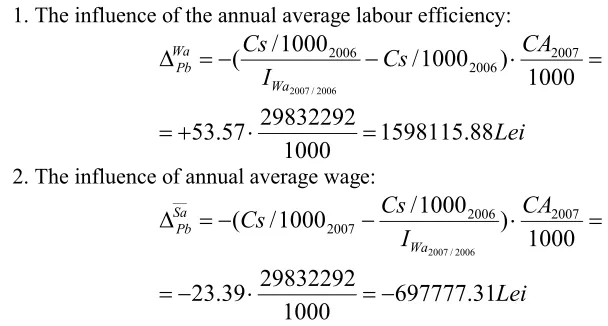
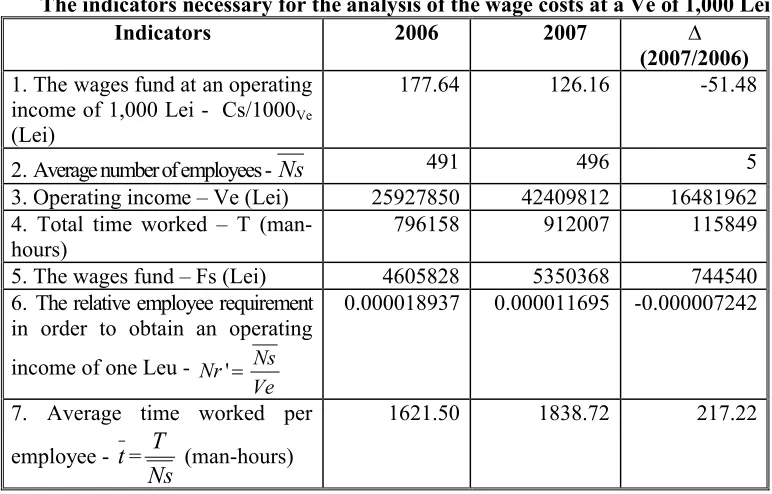
Figure
Related documents
Background and Objectives: Serratia marcescens , a potentially pathogenic bacterium, benefits from its swarming motility and resistance to antibiotic as two important
class I integrons and antibiotic resistance profile of Salmonella enterica serovars isolated from clinical specimens.. MATeRIAlS AND
ephemera joins the discussion on critical organization studies in a field of engagement already drawn out by AOM, APROS, BAM, CMS, EGOS, SCOS, Organization, Organization Studies,
National Conference on Technical Vocational Education, Training and Skills Development: A Roadmap for Empowerment (Dec. 2008): Ministry of Human Resource Development, Department
During this portion of the study, we examine the effect that lowering the threshold number of flow contributing cells required to distinguish between channel and overland flows has
The uniaxial compressive strengths and tensile strengths of individual shale samples after four hours exposure to water, 2.85x10 -3 M cationic surfactant
issued by the Comptroller General of the United States, the financial statements of the business-type activities and the discretely presented component unit (Francis Marion
