http://dx.doi.org/10.4236/jmmce.2014.22015
How to cite this paper: Reddy, T.R., Thyagarajan, K., Montero, O.A., Reddy, S.L. and Endo, T. (2014) X-Ray Diffraction, Elec-tron Paramagnetic Resonance and Optical Absorption Study of Bauxite. Journal of Minerals and Materials Characterization and Engineering, 2, 114-120. http://dx.doi.org/10.4236/jmmce.2014.22015
X-Ray Diffraction, Electron Paramagnetic
Resonance and Optical Absorption
Study of Bauxite
Tanguturi Ravindra Reddy1, Krishnan Thyagarajan2, Ovidio Almanza Montero3, Sanapa Reddy Lakshmi Reddy1*, Tamio Endo4
1Department of Physics, Sri Venkateswara Degree College, Kadapa, India
2Department of Physics, Jawaharlal Nehru Technological University, College of Engineering, Pulivendla, India 3Department of Physics, Universidad Nacional de Colombia, Bogota, Colombia
4Graduate School of Engineering, Mie University, Tsu, Mie, Japan
Email: *[email protected]
Received 20 November 2013; revised 30 December 2013; accepted 7 January 2014
Copyright © 2014 by authors and Scientific Research Publishing Inc.
This work is licensed under the Creative Commons Attribution International License (CC BY).
http://creativecommons.org/licenses/by/4.0/
Abstract
The bauxite mineral obtained from Araku, Vishakapatnam district of Andhra Pradesh, India is used in the present work. Structural characterization was performed by X-ray diffraction (XRD). The mineral was found to be gibbsite in phase. The transitional metal ions present were investi-gated using electron paramagnetic resonance (EPR) and optical absorption spectra. The EPR re-sults suggest that Fe3+ has replaced Al3+ in the unit cell of bauxite. The optical absorption spectrum is due to Fe3+ which indicates that it is in distorted octahedral environment. The near-infrared (NIR) spectrum is due to water fundamentals and combination overtones, which confirm the for-mula of the compound. The impurities in the mineral are identified using spectroscopic tech-niques.
Keywords
Bauxite; Gibbsite; X-Ray Diffraction (XRD); Electron Paramagnetic; Electron Paramagnetic Resonance; Optical Absorption Spectra; Fe3+; Water Fundamentals
1. Introduction
Bauxite is an aluminium ore. It is clay like compound. The most common impurity in the bauxite is the iron in
ferric state that results from the replacement of aluminium in the crystalline matrix. Gibbsite, disapore and boehmite are the three hydrates of alumina. Often gibbsite (Al2O3∙3H2O) is the predominant mineral in bauxite.
Further gibbsite is a stable form of the bauxite at lower temperatures, whereas at higher temperatures, disapore or boehmite is the most stable phase. In gibbsite, the fundamental unit of the structure is a layer of Al3+ ions which are octahedrally coordinated with oxygens. All of the coordinated sites between the oxygen layers are occupied by cations. The layers may be regarded as built of octahedra linked laterally by sharing edges and network formed becomes an orthogonal structure. The structure of gibbsite is a distorted octahedron resulting in orthogonal cell with a = 8.64 Å, b = 5.07 Å and c = 9.72 Å [1] [2]. Vibrational spectroscopic techniques have been used in the characterization of bauxite- and seawater-neutralized bauxite residues [3]. The studies indicate that the ferric ion in bauxite residue could be identified by its characteristic NIR spectra.
Alumina (Al2O3) is prepared from raw bauxite by a hydrometallurgical technique known as “Bayer process”.
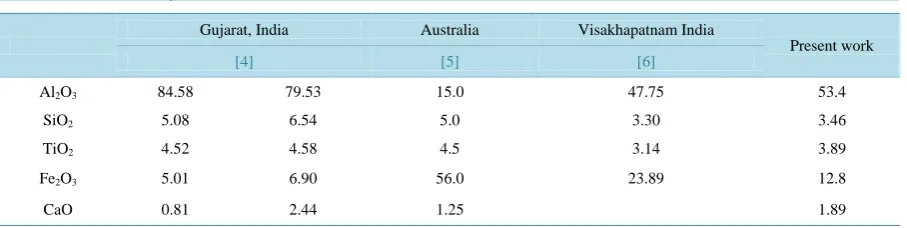
Bauxite is leached under high temperature and pressure with sodium hydroxide solution. From the solution, the insoluble material also termed as red mud is separated. The precipitate is aluminium hydroxide then it is finally calcined to alumina. After that, alumina is subjected to electrolytic reduction to obtain pure aluminum. It is im-portant to know the composition and mineralogy of bauxite deposits in order to evaluate the processability of the material. Detailed mineral characterization of bauxites can lead to the creation of effective processing options and can also be used to evaluate bauxite beneficiation techniques for ore quality enhancement before processing. The compositional analysis of different localities’ bauxite sample had been reported and is given in Table1.
About 10 mg of bauxite sample was taken in an agate pestle and mortar. The mineral sample is finely ground like a face powder. The powdered sample is used in the present study for different spectral techniques. In the present study, we used pale yellow coloured bauxite originated from Araku, Vishakapatnam district of Andhra Pradesh, India and studied its structural properties including particle size and nature of metal-oxygen bond using X-ray diffraction (XRD), electron paramagnetic resonance (EPR), optical absorption and near-infrared (NIR) spectroscopic methods.
2. Characterization Techniques
The X-ray powder diffraction pattern of the bauxite was recorded in reflection geometry on a Philips X-ray dif-fractometer operating at 30 mA, 40 kV using a Cu-Kα (λ = 1.54060 Å) source at 25˚C and the instrument was operated in the range of 10˚ - 75˚. Data were collected using a continuous scan rate which was then refined into 2θ of 0.02˚ per step.
EPR spectra of powdered bauxite sample was recorded at room temperature using a JEOL JES TE100 ESR spectrometer operated at the X-band frequency (υ = 9.31929 GHz) with a 100 kHz field modulation to obtain the first derivative EPR spectrum. DPPH (2,2-diphenyl-1-picrylhydrazyl) with a g factor value of 2.0036 was used as a standard for the calculation of the g factor.
An optical absorption spectrum of the mineral sample in a mull form was recorded at room temperature on a Carey 5E UV-Vis-NIR spectrophotometer in the range of 200 - 2500 nm.
[image:2.595.87.541.607.721.2]Band component analysis was performed using the Jandel “PEAKFIT” software package, which enabled the type of fitting functions to be selected and specific parameters to be fixed. Band fitting was conducted using a Lorentz-Gauss cross product function with a minimum number of component bands during the fitting process. The Lorentz-Gauss ratio was maintained at values greater than 0.7, and fitting was performed until reproducible results were obtained with squared correlations of r2 greater than 0.9975.
Table 1. Chemical analysis of raw bauxite (wt%).
Gujarat, India Australia Visakhapatnam India
Present work
[4] [5] [6]
Al2O3 84.58 79.53 15.0 47.75 53.4
SiO2 5.08 6.54 5.0 3.30 3.46
TiO2 4.52 4.58 4.5 3.14 3.89
Fe2O3 5.01 6.90 56.0 23.89 12.8
3. Results and Discussion
3.1. XRD Results
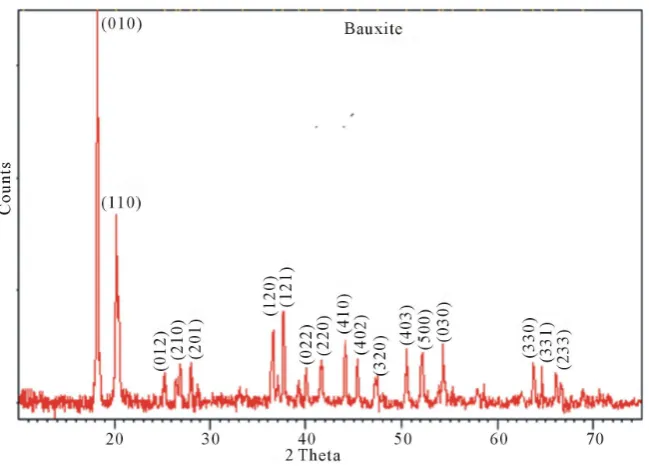
Figure1 presents the XRD pattern of the bauxite sample recorded on the Philips diffractrometer at 25˚C. Peaks
were characterized using the Scherrer formula. The peaks were very sharp, indicating good crystallinity of the compound. The list of X-ray peaks of the bauxite sample is presented in Figure1. The indexing of diffraction lines from various planes was similar to reported JCPDS file no 15-0776 [4]. Phase analysis study indicates that the major crystalline phase is gibbsite with a small amount of boehmite. The unit cell constants obtained from these peaks were a = 8.75 Å, b = 5.075 Å and c = 9.65 Å. Thus, the phase is a gibbsite. These values are similar to those reported for gibbsite mineral [7]. These results confirm that the mineral adopts a distorted octahedral rhombic structure. These values are similar to those reported for gibbsite mineral [7]. The X-ray density dx was calculated using the formula
x ZM d
NV
= ,
where Z = 8 (number of molecules in a unit cell of gibbsite phase of the bauxite lattice), M is the molecular mass of the gibbsite (155.964 g/mol), N is Avogadro’s number and V is the lattice volume of the sample [8]. The cal-culated X-ray density was 4.83 × 10³ kg/mm3. The percentage porosity of sample was calculated using the rela-tion,
1 100
x d d ρ= −
with d being the bulk density of the material (for gibbsite, d = 3.55 g/cm3) [9]. The calculated value of the per-centage porosity was 27. The particle size of the compound is evaluated
( )
1 2 0.9
cos
hkl
D λ
β θ
= .
where D is the average particle size of the crystal, θ is the corresponding Bragg angle, λ is the wavelength of in- cident X-ray, 1
2
[image:3.595.153.478.472.706.2]β is the full width at half the maximum (FWHM) height of the peak. The particle size of the crystal, calculated by XRD was 70 nm.
3.2. EPR Spectral Analysis
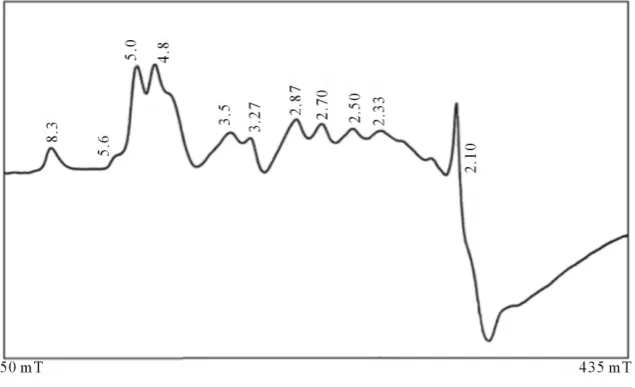
EPR measurements are useful for obtaining information related to the location of the transitional metal ion im-purities within the lattice of the natural bauxite sample. Figure2 shows the spectrum of the powdered bauxite (gibbsite phase) at room temperature. It shows a large number of resonances. The g values of different lines are indicated in the figure. These can be explained by considering charge compensating vacancies in the lattice, when Fe3+ is substituted for Al3+, it creates a low symmetry crystal field which is further distorted because of the strong tetragonal crystal field of Fe3+ion. Hence, one can expect resonances from all the three Kramers doublets
5 2
± , ±3 2 and ±1 2 . If the lowest doublet is populated, g values are obtained ranging from 0 to 9 [10] [11]. If the middle doublet is populated gives g is 4.30 and if the third doublet is populated g values are 2/7 and 30/7 [10] [11]. A few systems are known which show resonances from all the three Kramers doublets [10] [11]. Accordingly, the EPR spectrum of the bauxite (gibbsite phase) shows with g factors ranging from 8.3 to 2.1 due to Fe3+ impurity.
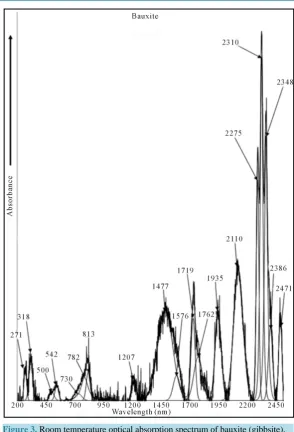
3.3. Optical Absorption Spectral Results
Optical absorption spectrum of bauxite is shown in Figure3 from 200 - 2500 nm at RT. It consists of bands at 36,900 cm−1 (271 nm), 31,745 cm−1 (318 nm), 20,000 cm−1 (500 nm), 18,450 cm−1 (542 nm), 13,700 cm−1 (730 nm), 12,790 cm−1 (782 nm), 12,300 cm−1 (813 nm) and 12,300 cm−1 (813 nm) cm−1 in the UV-Vis region. A band observed at 12,300 cm−1 with two component bands at 12,790 and 13,700 cm−1 is assigned to the transition
( )
( )
6 4
1g 1g
A S → T G whereas the band at 18,450 cm−1 is assigned to 4
( )
1gT G transition for Fe(III). The band at 20,000 cm−1 is assigned to 4E(G) transition in the present compound. These three bands are characteristic of Fe(III) ion occupying in distorted octahedral symmetry in the bauxite.
Assignment of each band to an appropriate electronic transition is difficult due to complexity of the transi-tions and multiplicity and distortransi-tions of the sites occupied by the transition metal ion. Therefore, Tanabe-Sugano diagram of d5 configuration is used to assign the transitions of the other bands [12]. The energy matrices of d5 configuration were solved for different values of Dq, B and C. The parameters that give good fit to the experi-mental data is Dq = 842 cm−1, B = 600 cm−1 and C = 2450 cm−1 and are presented in Table2.
Also the bauxite spectrum shows the bands at 8285 (1207 nm), 6770 (1477 nm), 6345 (1576 nm), 5820 (1719 nm), 5675 (1762 nm), 5170 (1935 nm), 4740 (2110 nm), 4400 (2275 nm), 4330 (2310 nm), 4260 (2348 nm), 4190 (2386 nm) and 4050 (2471 nm) cm−1 in the NIR region. These are analysed as follows:
Water has C2V symmetry. It gives three fundamental modes. They are ν1, ν2 and ν3. ν1 represents symmetric
OH stretch, ν2 the asymmetric OH stretch and ν3 the H-O-H bend respectively. In vapour phase ν1, ν2 and ν3
oc-cur at 3652, 1595 and 3756 cm−1 respectively [13].
The first overtones of the OH stretching of the vibrations appear in the region 1300 - 1800 nm. The sample
[image:4.595.155.473.508.702.2]Figure 3. Room temperature optical absorption spectrum of bauxite (gibbsite).
Table 2. Band headed data with assignments for Fe(III) in bauxite (gibbsite phase). Dq = 842 cm−1, B = 600 cm−1 and C =
2450 cm−1.
Wave length (nm)
Wave number (cm−1)
Transitions from 6A 1g(S)
Observed Calculated
813 12,300
782 12,790 12,796 4T
1g(G)
730 13,700
542 18,450 16,529 4T
2g(G)
500 20,000 20,050 4E
g(G)
318 31,745 31,430 4A
1g(G)
271 36,900 36,332 4T
2g(F)
[image:5.595.87.537.549.686.2]In the NIR, all the spectral features are due to the vibrations of the hydroxyl ion. Only two groups of bands are noticed in the region 1300 - 1800 nm. These are 7460 to 6330 cm−1 and 5880 to 5680 cm−1. Whenever water is present in any compound, in general, two characteristic bands appear around 7000 cm−1 due to 2ν3 and 5200
cm−1 due to (ν2 + ν3). The first overtone and combinations of the stretching modes produce the numerous
rela-tively sharp features centered at 6770 cm−1 and the combination of the stretching and bending modes produce the feature near 4350 cm−1. When the bands are broad, it indicates that water molecules are relatively disordered and when the bands are sharp, it indicates that water molecules are located in well defined ordered sites [14]. The band observed at 5675 cm−1 is identified as ν3 mode of H2O molecule. The maximum intense sharp band is
at 4740 cm−1 and another sharp band is at 5170 cm−1 which are due to H-O-H bending and asymmetric OH stretching respectively. A very sharp band centered at 4330 cm−1 with shoulders on either side with almost equal intensity is noticed in this range. This band is assigned to the combination of OH stretching and Fe-OH vibration. The low wave number band near 4050 cm−1 may be attributed to Fe-OH units [15].
4. Conclusions
1) XRD results indicated that the bauxite (gibbsite phase) had distorted octahedral crystal structure with lat-tice constants a = 8.75 Å, b = 5.075 Å, and c = 9.65 Å.
2) EPR results indicated that the bauxite (gibbsite phase) consisted of Fe3+ ion which was in higher concentra-tion.
3) Optical absorption spectrum was characterized by the Fe3+ in the bauxite (gibbsite), which was in a dis-torted octahedral structure.
4) NIR results were due to the fundamental vibrations of water and OH units.
These results are conclusively proving that the metal ion is placed in distorted octahedral environment with oxygen and water ligands.
References
[1] Deer, W.A., Howie, R.A. and Zussman, J. (1978) An Introduction to the Rock Forming Minerals. ELBS, London, 436- 443.
[2] Crook, N.P., Hoon, S.R., Taylor, K.G. and Perry, C.T. (2001) Electron Spin Resonance as a High Sensitivity Tech-nique for Environmental Magnetism: Determination of Contamination in Carbonate Sediments. Geophysical Journal,
149, 328-337.http://dx.doi.org/10.1046/j.1365-246X.2002.01647.x
[3] Palmer, S.J. and Frost, R.L. (2012) Characterisation of Bauxite and Seawater Neutralised Bauxite Residue Using XRD and Vibrational Spectroscopic Techniques. Journal of Materials Science, 44, 55-63.
http://dx.doi.org/10.1007/s10853-008-3123-y
[4] Tripathi, H.S., Ghosh, A., Halder, M.K., Mukherjee, B. and Maiti, H.S. (2012) Microstructure and Properties of Sin-tered Mullite Developed from Indian Bauxite. Bulletin of Materials Science, 35, 639-643.
http://dx.doi.org/10.1007/s12034-012-0337-z
[5] Gräfe, M., Landers, M., Tappero, R., Klauber, C., Hutomo, G., Gan, B., Grabsch, A., Austin, P. and Davies, I. (2010) A Study on Chemical Leaching of Iron from Red Mud Using Sulphuric Acid. 19th World Congress of Soil Science,
Soil Solutions for a ChangingWorld, Brisbane, 1-6 August 2010.
[6] Geological Survey of India, Detailed Information on Bauxite in India (1994).
[7] Ford, W.E. (1944) Dana System of Mineralogy. 7th Edition, Wiley Eastern Ltd., New Delhi.
[8] Cullity, B.D. (1959) Elements of X-Ray Diffraction. Addison-Wesley Publishing Company, Boston.
[9] ChiCaroline, MacGillavry, H. and Rieck G.D., Eds. (1968) International Tables for X-Ray Crystallography Vol. III. Kynoch Press, Birmingham.
[10] Rao, P.S. and Subramanian, S. (1985) Single Crystal E.P.R. Studies of Some First-Row Transition Ions in Hexaimida-zole Zinc (II) Dichloride Tetrahydrate. Molecular Physics, 54, 415-427.http://dx.doi.org/10.1080/00268978500100321 [11] Castner, T., Niawell, G.S., Holton, W.C. and Slichter, C.P. (1960) Note on the Paramagnetic Resonance of Iron in
Glass. Journal of Chemical Physics, 32,668.http://dx.doi.org/10.1063/1.1730779
[12] Tanabe, Y. and Sugano, S. (1954) On the Absorption Spectra of Complex Ions. I. Journal of the Physical Society of Japan, 9,753.http://dx.doi.org/10.1143/JPSJ.9.753
[14] Hunt, G.R. and Salisbury, J.W. (1970) Visible and Near-Infrared Spectra of Minerals and Rocks—I. Silicate Minerals.
Modern Geology, 1,283.