http://dx.doi.org/10.4236/ojn.2016.68060
How to cite this paper: Olimpia, G.E.S., Darío, G.H., Adriana, M.M.R., Verónica, G.G. and Yolanda, T.F. (2016) Expectations and Perspectives of Users with the Screening Program for Cervical Cancer. Open Journal of Nursing, 6, 565-572.
http://dx.doi.org/10.4236/ojn.2016.68060
Expectations and Perspectives of Users with
the Screening Program for Cervical Cancer
Gutiérrez Enríquez Sandra Olimpia, Gaytán Hernández Darío,Martínez Martínez Rosa Adriana, Gallegos García Verónica, Terán Figueroa Yolanda*
Nursing Faculty, Autonomic University of San Luis Potosí, San Luis Potosí, México
Received 12 June 2016; accepted 21 August 2016; published 24 August 2016 Copyright © 2016 by authors and Scientific Research Publishing Inc.
This work is licensed under the Creative Commons Attribution International License (CC BY). http://creativecommons.org/licenses/by/4.0/
Abstract
Objective: Evaluate user satisfaction before and after taking the Pap. Methodology: Observational and prospective study. It was carried out in two health centers in San Luis Potosicity, Mexico in 93 users which attended for a Pap test from February to June 2015. The satisfaction was assessed us-ing multidimensional scalus-ing SERVQUAL whit 5 dimensions to evaluate the quality of services in an organization: reliability, responsibility, security, empathy and touchable and materials goods (tangible elements). This scaling was obtained internal consistency by Cronbach’s alpha coeffi-cient with a value of 0.74. For data analysis, nonparametric test Wilcoxon for related samples was used. Results: In all cases, perspective was less than expectancy where the means of the scores before attention (expectation) and after care (perspective) there was a statistically significant dif-ference (p = 0.000). Before receiving care users had an expectation of 192.96 points, after care perspective score dropped to 184.49 points indicating that the care provided was not what they expected. The difference in scores was 8.47 points (p = 0.004). Conclusions: Users of the screening program for cervical cancer were unsatisfied because the attention was not what they expected. In most of the indicators studied, a high percentage of dissatisfaction was obtained.
Keywords
Cervical Cancer, Pap Smears, Prevention and Control, SERVQUAL
1. Introduction
The appreciation of users is essential to improve all health programs. In this 21st century, the global competition among service providers is to render qualitative services to satisfy the desires of customers [1]. The quality of
care is a judgment that is made by the customer after receiving the service and comparing their expectations with the received service [2]. Most of the organizations, for improving customer’s satisfaction and, consequently, their own survival, are willing to evaluate the strategies of their service quality, and so, the customer is consi-dered the key indicator in this evaluation [3]. Expectations are customer’s demands, meaning that what they feel a service provider must present and perceptions are customer’s experiences [4] with the service received and the difference between costumer’s expectations and perceptions is called service quality gap [5].
Researchers of service marketing have developed nineteen service quality models during the period 1984- 2003 [6]. The service quality model “SERVQUAL” ranks as the most important of these models. By determin-ing the gap between costumer’s perceptions and expectations of the quality of provided services, the process of service provision could be improved and costumer’s satisfaction, as a very sensitive element in today’s field of competition, could be provided [7].
In order to determine the gap of the service quality in hospitals and health care centers, the SERVQUAL ap-proach has been used in many studies. This service conceptual model was introduced in 1985 by Parasuraman et al. This tool measures the patients’ perceptions and expectations of services in 5 different dimensions, including physical or concrete dimensions, reliability, responsiveness, assurance, and empathy [8]. In fact, customer-cent- ered organizations set their activities based on the expectations and preferences of their customers and are to sa-tisfy the needs and expectations of customers and considering their expectations as service quality standards is of essence [9].
Quality in the field of health services has a special place because the critical duty and mission of protecting the health and lives of the society is the responsibility of this part and any mistake could be irreparable; on the other hand, health services are related to a vast part of the society [10]. Different studies have been conducted to evaluate customer’s satisfaction for improving the quality of provided services using SERVQUAL model in different areas from higher education [11] to health services [12], but a little attention has been paid to evalua-tion of service quality in different secevalua-tions of primary health care of health centers [13], including service timely detection of cervical cancer. It is in this sense that the aim of the present study was to evaluate the perspectives of users of the cervical cancer detection service in two health centers of a Mexican province.
2. Patients and Methods
2.1. Data SourceQuantitative, observational, prospective and longitudinal study. It was conducted in two health centers in San Luis Potosicity, Mexico. The work was conducted with a total of 93 users (49 health center called for this study as 1, and 44 health center labeled 2), which they received attention for taking cervical cytology (Pap) by nurses in the period from February to June 2015. Satisfaction was measured using the multidimensional SERVQUAL model.
This survey was designed by Parasuraman et al. in 1985 for validation and reliability [14]. In Mexico the sur-vey was validated in 2011 at the General Hospital of Celaya, Guanajuato, obtained an internal consistency by Cronbach’s alpha coefficient of 0.74 in full scale and factor analysis that wasdetected in the five dimensions of the scale 0,82 for expectations and perceptions to 0,66 for ; showing that it is valid and reliable [15].
Multidimensional SERVQUAL model measured and related customer perception and expectations regarding the quality of service. The 5 dimensions contained to the evaluation, in this case of a health service are:
1) Reliability. Ability to develop the service as promised, agreed and accurately.
2) Liability (answer’s capacity). Willingness to help customers and provide prompt service.
3) Security. Knowledge of employees about what they do, their courtesy and their ability to convey trust. 4) Empathy. Ability to provide care and personal attention to their customers.
5) Tangibles. Related to the appearance of physical facilities, equipment, personnel and communication mate-rials. They are the physical aspects in the organization that the customer perceives [14].
VALUE MEANING
Difference between P and E = 0 Satisfied user
Difference between P and E = a positive number Very satisfied user
Difference between P and E = between-1 y -3 Little satisfied user
Difference between P and E = between -4 y -7 Unsatisfied user
2.2. Data Analysis
Descriptive statistics were applied as percentages and frequencies, confidence intervals were estimated at 95%, the normality of the data was validated with the Kolmogorov-Smirnov test and based on the results of this test, nonparametric Wilcoxon test was applied to compare the scores of perspectives and expectations.
2.3. Ethical Considerations
The research protocol was reviewed and approved by the Ethics Committee of the School of Nursing of the Au-tonomous University of San Luis Potosi which assigned a registration number CEIFE-2015-118. Discretionary criteria were taken into account as the Declaration of Helsinki brand and general health law of Mexico, article 17. All participants signed a letter of informed consent.
3. Results
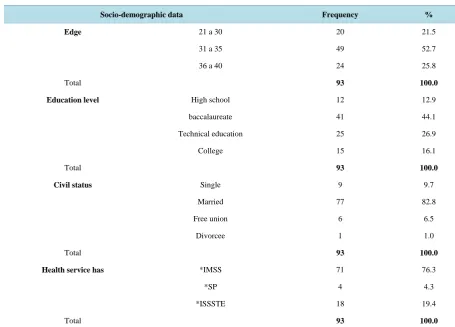
In this study, 93 users from San Luis Potosí, México were selected and some of its characteristics were analyzed, which indicate, from Table 1, that most of them are between 31 and 35 (52.7%), 21.5% between 21 and 30 years and 25.8% are in the range of 36 to 40 years. in relation to level education, the highest percentage (44.1%) have baccalaureate education and the lowest (12.9%) have high school education. As for marital status, most are married (82.8%). Regarding health services they have, 76.3% it affiliated to the Mexican Social Security Insti-tute, 19.4% to Publicly Provided Health Insurance and 4.3% to Services Institute of Social Security for State Workers.
By measuring expectations and prospects in each dimension of scale SERVQUAL model, it was found that in all averages the scores before the attention (expectations) and after this (perspectives) there is a difference statis-tically significant (p = 0.000). In all cases, prospects were below expectations, which it means that users ex-pected better care that they received (Table 2).
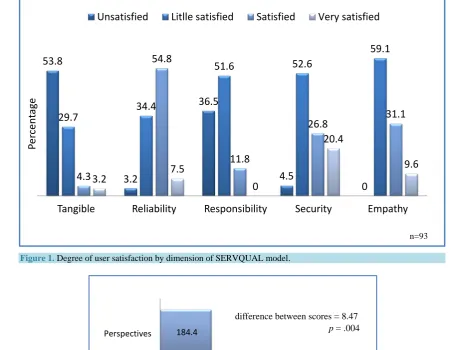
Degree of user satisfaction by dimension (as after care) was obtained as a percentage. Intangibles (the physi-cal aspects that the customer perceives of the organization), 53.8% of them was unsatisfied and 3.2% very satis-fied. Regarding reliability (ability to develop the service as promised as agreed and accurately), 54.8% of them was satisfied and 3.2% unsatisfied. On the other hand, responsibility (willingness to help customers and provide service fast), 51.6% of them was little satisfied and anyone was very satisfied. With regard to security dimension (knowledge of employees about what they do, their courtesy and their ability to convey trust), 52.6 % of them was little satisfied and anyone was unsatisfied. In the dimension empathy (ability to provide care and personal attention to their customers), 59.1% of them was little satisfied and anyone was unsatisfied about the service. It is important to note that the satisfaction’s degree “very satisfied” never obtained the highest percentage and that the degree “satisfied” only responsibility dimension occupied the highest percentage (Figure 1).
Before receiving care users had an expectation of 192.96 points. Considering that the highest score that can be obtained by applying the scale SERVQUAL is 196 points, we can assume that the expectation was high. How-ever, after receiving the service perspective score was 184.49 points, indicating that the care provided was not that they expected. Difference between scores was 8.47 points (p = 0.004) (Figure 2).
4. Discussion
Table 1. Socio-demographic data of users who came to take pap.
Socio-demographic data Frequency %
Edge 21 a 30 20 21.5
31 a 35 49 52.7
36 a 40 24 25.8
Total 93 100.0
Education level High school 12 12.9
baccalaureate 41 44.1
Technical education 25 26.9
College 15 16.1
Total 93 100.0
Civil status Single 9 9.7
Married 77 82.8
Free union 6 6.5
Divorcee 1 1.0
Total 93 100.0
Health service has *IMSS 71 76.3
*SP 4 4.3
*ISSSTE 18 19.4
Total 93 100.0
Source: Multidimentional SERVQUAL scale. *IMSS: Mexican Social Security Institute, *SP: Publicly Provided Health Insurance, *ISSSTE: Servic-es Institute of Social Security for State Workers.
Table 2. Expectations and perspectives of users by scale dimensions of SERVQUAL.
Dimension Indicator Average S.D. D.B.A. L.L. U.L. p*
Tangibles E 54.84 1.035 3.312 2.959 3.665 0.000
P 51.53 1.646
Responsibility E 20.76 0.427 0.462 0.260 0.665 0.000
P 20.30 0.918
Capacity E 62.04 1.122 3.097 2.686 3.508 0.000
P 58.95 1.964
Security E 27.51 0.670 0.613 0.333 0.893 0.000
P 26.89 1.118
Empathy E 27.68 0.514 0.849 0.629 1.070 0.000
P 26.83 0.904
Source: multidimentional SERVQUAL scale. E = Expectations; P = Perspectives; D.E. = Standard deviation, D.B.A. = difference betweenthe average; L.L. = Lower Límit; U.L. = Upper limit. *Wilcoxon.
[image:4.595.95.540.469.633.2]Figure 1. Degree of user satisfaction by dimension of SERVQUAL model.
Figure 2. Degree of user satisfaction by dimension of SERVQUAL model. Nonparametric Wilcoxon test.
This is most often used to assess the quality of care in health services and measurement indicator is expressed in levels of user satisfaction [18]. The survey for validity and reliability is the most widely accepted to measure the quality of care in multidimensional tool business services [19]. Babakus and Mangold validated a new SERVQUAL construct to hospital [19] and in Mexico were validated in 2011 in a Celaya Guanajuato hospital [15].
The incidence of cervical cancer has decreased substantially in developed countries due to the widespread success of Pap smears programs, however, these results have not been obtained in developing countries [20] [21]. Recognizing the limited effectiveness of the program in Mexico [22], different strategies have been im-plemented, but the assessment of the prospects of the users of it is very important and little or nothing has been
53.8
3.2
36.5
4.5
0
29.7
34.4
51.6
52.6
59.1
4.3
54.8
11.8
26.8
31.1
3.2
7.5
0
20.4
9.6
Unsatisfied
Litlle satisfied
Satisfied
Very satisfied
Pe
rc
en
ta
ge
Tangible
Reliability
Responsibility
Security
Empathy
n=93
192.9 184.4
180 185 190 195
Expectations Perspectives
Average score
difference between scores = 8.47
explored, marking the aim of this research using multidimensional SERVQUAL scale. In other countries like in Iran, was studied the customer’s perceptions and expectations of primary healthcare services quality in health centers of Bandar Abbas in this paper the authors found that the majority of participants (64%) assessed the ser-vices quality moderate and that the best dimension of service quality was assurance, followed by reliability, responsiveness and tangibles with empathy being the worst [23]. In our study, users had higher expectations that perspectives on the care provided, indicating low satisfaction. Furthermore, in this study itwas found that the dimension was more dissatisfaction was tangible, which include material, equipment, facilities and staff health. About, program quality and patient safety at Children’s Hospital of Mexico “Federico Gómez”, mentions that amenities include elements such as degree of comfort achieved, hotel services provided, the information system and situation of intimacy in which the patient is attending among others. This specifies that the quality is the ap-plication of science and medical technology in a way that maximizes their health benefits without increasing proportionately their risks [24].
Thus, in our study we found that most users are dissatisfied with the elements related to the institution, which is important for future research are analyzed factors concerning the organization and specifically concerning the service provided by nurses, the qualitative aspects and everything that influences so that patients come to per-form or notPap using new indicators. Health institutions in the public sector in Mexico, nursing staff is respon-sible for taking the cervical smear tests and the main contact with users of the program since one of its functions, in addition to providing care, is to provide the necessary information to women so they can achieve greater at-tachment to the early detection program. Such personnel must hear from women attending the screening on their expectations and experiences regarding the care in order to detect areas of opportunity later to become im-provement strategies that increase the quality of this priority health program. In this sense, we have identified the main problems perceived by users, which lie in long waiting periods, conditions of inadequate physical spaces, lack of respect for privacy and lack of continuous and appropriate monitoring causing dissatisfaction with the service [25].
The authorities of public organizations have realized that their achievements as the targets are not associated with the appreciation that management makes citizens. Political discourse and theoretical approaches are not always compatible with the operation of programs that impact poorly on the reality of the people they are in-tended. In this context, studies seeking to approach people and understand their complex reality of incorporating multidimensional aspects, are relevant to narrowing the gap between public policy planners and those who re-ceive benefits [26].
On the other hand, users have certain needs or desires which sometimes are not even concerning the care and can be obtained by the organization to design and deliver a service that no longer satisfied. Some systems are available to identify the real needs of customers, while others allow only perceive the needs of which the user is aware. Both perspectives are used to improve service quality and tend to greater satisfaction of people who re-ceive it [16].
In conducting this study there were different limitations, including the small influx of women who demand service and large span of time (45 minutes) to do this, which meant not being able to have a larger sample.
Finally, it should be mentioned that studies as performed by this research group and characteristics that were addressed are important to improve a program, in this case the timely detection of cervical cancer. Users’ opi-nion of the program is critical because they are the recipients of care and can provide useful information for de-cision makers’ information. For future research is suggested to address the point of view of health personnel re-garding some variables analyzed in this study for comparison of the experiences of the major players in the pro-gram of cervical cancer screening. It should be mentioned that there are few studies on the quality of health care and user opinion, and much less those related to the service responsible for the early detection of cervical cancer.
5. Conclusion
Users of the program for early detection of cervical cancer were dissatisfied with it because attention was not what they expected. In most indicators addressed, a high percentage of dissatisfaction was obtained.
Acknowledgements
References
[1] Asogwa, B.E. (2014) Use of ServQUAL in the Evaluation of Service Quality of Academic Libraries in Developing Countries. Library Philosophy and Practice (E-Journal), 1146, 1-25.
[2] Ruset, R.T., Lemon, K.N. and Zeithaml, V. (2004) Return on Marketing: Using Customer Equity to Focus Marketing Strategy. Journal of Marketing, 68, 109-27. http://dx.doi.org/10.1509/jmkg.68.1.109.24030
[3] Kaplan, R.S. and Norton, D.P. (2001) The Strategy-Focused Organization: How Balanced Scorecard Companies Thrive in the New Business Environment. 1st Edition, Soundview Executive Book Summaries, Harvard Business School Press, Concordville, 148-159. https://www.uaservice.com/pdf/The_Strategy-Focused_Organization.pdf http://dx.doi.org/10.1108/sl.2001.26129cab.002
[4] Mohammadi, A. and Shoghli, A.R. (2008) Survey on Quality of Rimary Health Care’s in Zanjuan District Health Cen-ters. Journal of Zanjan University of Medical Science and Health Services, 16, 89-100.
[5] Kebriaei, A., Akbari, F., Hosseini, M., Eftekhare-Ardabili, H. and Purreza, A. (2004) Survey on Quality Gap in Prima-ry Health Care in Kashan Health Centers. The Journal of Qazvin University of Medical Sciences, 31,82-88.
[6] Seth, N., Deshmukh, S.G. and Vrat, P. (2005) Service Quality Models: A Review. International Journal of Quality & reliability Management, 22, 913-949. http://dx.doi.org/10.1108/02656710510625211
[7] Tarahi, M.J., Hamozadeh, P., Bijuanvand, M. and Lshgrara, B. (2012) Survey on Quality of Health Services Provided in Khorramabad Health Care Centers Using the SERVQUAL Model. Journal of Lorestan University of Medical Sci- ences, 14, 13-21.
[8] Parasuraman, A., Berry, L.L. and Zeithaml, V.A. (1991) Refinement and Reassessment of the SERVQUAL Scale. Journal of Retailing, 67, 420.
[9] Nouri, H. (2006) Applying SERVQUAL Model in RasouleAkram Hospital. University of Medical Sciences, Tehran.
[10] Jackson, S. (2000) Successfully Implementing TQM within Health Care. International Journal of Health Care Quality Assurance (IJHQA), 14,157-163. http://dx.doi.org/10.1108/09526860110392431
[11] Glavandi, H., Behaeshtirad, R. and Ghaleei, A. (2012) Investigating the Quality of Educational Services in the Univer-sity or Urmia through SERVQUAL Model. Quarterly Journal of Management Development, 25, 49-66.
[12] Nadi, A., Shojaee, J., Abedi, G., Siamian, H., Abedini, E. and Rostami. F. (2016) Patients’ Expectations and Percep-tions of Service Quality in the Selected Hospitals. Medical Archives, 70, 135-139.
http://dx.doi.org/10.5455/medarh.2016.70.135-139
[13] Oliaee, Z., Jabbari, A. and Ehsanpour, S. (2016) An Investigation on the Quality of Midwifery Services from the Viewpoint of the Clients in Isfahan through SERVQUAL Model. Iranian Journal of Nursing and Midwifery Research,
21,291-296. http://dx.doi.org/10.4103/1735-9066.180377
[14] Parasuraman, A., Zeithaml, V. and Berry, L. (1988) SERVQUAL: A Multiple-Item Scale for Measuring Consumer Perceptions of Service Quality. Journal of Retailing, 6,12-37.
[15] Calixto, O.M., Okino, S.N., Hayashida, M., Costa, M.I., Auxiliadora, T.M. and Godoy, S. (2011) Escala SERVQUAL: Validación en población mexicana. Texto Contexto Enferm, 20, 326-333. http://producao.usp.br/handle/BDPI/3578 http://dx.doi.org/10.1590/S0104-07072011000300014
[16] Castillo Morales, E. Escala Multidimensional Servqual (2005) Facultad de Ciencias Empresariales. Universidad de Bio-Bio, Chile.
https://docs.google.com/document/d/1aLp1eZ2g2RIpHQ_3C0f81fax9YseQdYV0GeYqPtqSys/edit?pli=1
[17] Cabello, E. and Chirinos, J.L. (2012) Validation and Applicability of SERVQUAL Modified Survey to Measure Ex-ternal User Satisfaction in Health Services. Revista Medica Herediana, 23,88-95.
http://dx.doi.org/10.20453/rmh.v23i2.1037
[18] Andía, C., Pineda, A.M., Sottec, V., Santos, J.R., Molina, M.E. and Romero, Z. (2002) User Satisfaction Services Outpatient from I Espinar Hospital. SITUA, 10,3-11.
[19] Babakus, E. and Mangold, W.G. (1992) Adapting the SERVQUAL Scale to Hospital Services: An Empirical Investi-gation. Health Services Research Journal, 26,767-786.
[20] Sahasrabuddhe, V.V., Parham, G.P., Mwanahamuntu, M.H. and Vermund, S.H. (2011) Cervical Cancer Prevention in Low- and Middle-Income Countries: Feasible, Affordable, Essential. Cancer Prevention Research, 5,12-17.
http://cancerpreventionresearch.aacrjournals.org/content/5/1/11.full
http://dx.doi.org/10.1016/S0140-6736(11)61351-2
[22] Hernández-Avila, M., Lazcano-Ponce, E. and Martínez, O. (2011) Public Policies for HPV Screening and Vaccination in Mexico. 27th International Papilloma Virus Conference and Clinical Workshop. Berlin, 17-23.
[23] Agha Molaei, T., ZareShahram, Poudat, A. and Kebriaei, A. (2007) Customer’s Perceptions and Expectations of Pri-mary Healthcare Services Quality in health Centers of Bandar Abbas. Medical Journal of Hormozgan Univestity, 11, 173-179.
[24] Programa de calidad y seguridad del paciente (2013) Hospital Infantil de México “Federico Gómez”. México, D. F.
[25] Vega Chávez, J., Gutiérrez Enríquez, S.O. and Terán Figueroa, Y. (2009) Use of Pap in Women Attending Early De-tection of Cervical Cancer: An Approach to Meeting The Service. Investigación y Educación en Enfermería, 27,201- 208.
[26] Hamui Sutton, L., Fuentes García, R, Aguirre Hernández, R. and Ramírez de la Roche, O.F. (2013) Expectativas y experiencias de los usuarios del Sistema de Salud en México: Un estudio de satisfacción con la atención médica. Coyoacán, D.F. Formas e Imágenes, S. A. de C. V, 22.
Submit or recommend next manuscript to SCIRP and we will provide best service for you:
Accepting pre-submission inquiries through Email, Facebook, LinkedIn, Twitter, etc. A wide selection of journals (inclusive of 9 subjects, more than 200 journals) Providing 24-hour high-quality service
User-friendly online submission system Fair and swift peer-review system
Efficient typesetting and proofreading procedure
Display of the result of downloads and visits, as well as the number of cited articles Maximum dissemination of your research work