Munich Personal RePEc Archive
Aid Financing of Global Public Goods:
an Update
Cepparulo, Alessandra and Giuriato, Luisa
Dipartimento di Economia Pubblica, Sapienza University of Rome,
Italy, University of Exeter, Business School, Xfi Centre for Finance
and Investment
December 2009
Online at
https://mpra.ub.uni-muenchen.de/22625/
Aid Financing of Global Public Goods: an Update
Alessandra Cepparulo* and Luisa Giuriato**
December 2009
Abstract
The paper compares different aggregates of aid financed global public goods and detects the presence, for the period 1995-2006, of the substitution effect between these aggregates and traditional aid that was found by former studies for earlier periods. A second focus of the paper is on the differences in the importance that donors attach to the various types of global public goods, trying to detect regular patterns in their choices of financing. Statistical regularities, representative of common historical, social, cultural factors, for groups of countries (Anglo-Saxon, Northern European and Central European) give rise to the existence of a certain clusterized homogeneity in global public goods financing. Potential explanatory variables are examined in a panel analysis, which reveals the dominance of the donors’ wealth, preferences for public goods and public finance constraints in the decision of aid funding of global public goods. Finally, there is evidence that some global public goods with weakest-link technologies have become increasingly important at the global level. The increase in their financing through aid flows could be explained by the rich countries’ fear of an insufficient provision by poor countries, which, increasingly, cannot afford to pay for them: rich countries are therefore stepping in to avoid sub-optimal levels of provision, as already foreseen by Sandler (1998).
Keywords: Foreign aid, Global public goods JEL codes: H41, F35, H87
*
University of Exeter, Business School, Xfi Centre for Finance and Investment, Rennes Drive, Exeter. Email:
A.Cepparulo@exeter.ac.uk
** Università Roma “Sapienza”, Dipartimento di Economia Pubblica, Via del Castro Laurenziano, 9, 00161, Rome: luisa.giuriato@uniroma1.it.
The authors wish to thank Nicola Acocella for his comments and Grzegorz Trojanowski for his attentive reading. The authors also acknowledge the helpful suggestions of Umberto Triulzi, Ferruccio Marzano, Giovanni
1. Introduction
The current financing of international public goods (IPGs) is almost totally entrusted to national governments and it is the joint product of domestic public expenditure decision concerning research, knowledge development, defense, and environment protection. Only a minor share of IPGs are financed at the international level (0.5 per cent according to Kaul and Le Goulven, 2005). However, tracing direct and explicit IPG financing in specific headings of the national budgets is very difficult, as no separate accounting is generally provided for international programs. As far as we know, only Canada has promoted a two-track budgeting system to ensure that every ministry pays for the international mechanisms it benefits from.
For OECD-DAC countries, indirect financing of IPGs can be detected through the Official Development Assistance (ODA) budgets, i.e. the aid and development funds to
developing countries1. Since the 1980s, it has become a common practice to use aid funds for
financing IPGs provision by developing countries2: te Velde et al.(2002) estimate the share of
total aid spending allocated to IPGs to be nearly 5 per cent in 1980-82, 7 per cent in 1990-92, and close to 9 per cent in 1996.
The aid financing of IPGs is now recognized as one of the rationales behind development assistance, together with motivations of international solidarity and strategic, political, and economic self interest (Sagasti, 2005). However, the presence of lines of IPG financing inside aid funding have met both approval and criticism. On one hand, there is evidence of important relationships between cooperation for development and the provision of IPGs (Zedillo and Thiam, 2006) and each of them can be essential for the supply of the other. Limited development can hinder the provision of many IPGs that require sufficient capacity at national level as a pre-condition for an efficient delivery. IPG provision must sometimes ‘wait’ until this capacity has been built: for example, communicable disease control requires sufficiently developed national health sectors to deliver drugs, vaccines and the necessary health services in the whole countries, including the rural areas. Complementarity plays also in the opposite direction and some IPGs are critical for attracting private direct investment flows, for ensuring development financing and the effectiveness with which governments deliver national public goods.
On the other hand, global concerns can also have dubious impact on development and, in some cases, they can distort the whole structure of aid. For instance, this is the case for global security expenditures. “While domestic security in developing countries is a pre-requisite for development efforts, the current emphasis on global security could highjack aid as the Cold War did for decades. The pursuit of narrow geo-political and security interests distorts aid allocation patterns, reduces resources available for human development and reinforces pernicious practices such as the provision of tied aid” (Sagasti, 2005, p. 11).
Further criticisms to aid financing of IPGs have been advanced (Anand, 2004) on grounds of (i) ethics, as IPGs divert resources that should mainly directed to poverty reduction; (ii) efficiency, as institutions for development may not be the most appropriate for
1
Net Official Development Assistance (ODA) comprises grants or loans to developing countries and territories on the OECD/DAC list of aid recipients that are undertaken by the official sector with promotion of economic development and welfare as the main objective and at concessional financial terms.
2
IPG delivery; (iii) accountability, as IPG funding seems to take place without prior assessment of needs.
Concerns for coherence in aid programs and the fear that IPGs displace aid devoted to human development and poverty reduction have been growing since the 1990s: “if IPGs are less beneficial to at least to some poor countries than traditional aid, earmarking aid to IPGs would reduce the utility that developing countries can derive from aid“ (Reisen et al., 2004, p. 28). Crowding out of aid-financed national public goods and development by IPG financing is all the more harmful when there exist complementarities between international and national public goods and between international goods and development expenditure. Thus, if spending on IPGs were to displace aid spending on complementary national public goods, the effect would weaken developing countries’ ability to provide IPGs (te Velde et al. 2002, p. 142). A number of studies have searched for the presence and the size of the crowding-out effect and evidence has been found both in a strong (te Velde et al., 2002) and in a soft version (Reisen et al., 2004) for the 1980s and 1990s.
Notwithstanding the concerns that surround aid financing of IPGs, these seem to have been integrated within the “grand purpose” currently assigned to international development assistance, namely the managing of global interdependencies in a globalized world (Severino and Ray, 2009). The expanding range of global concerns that the international community faces, calls for a better understanding of the motivations behind IPGs financing through aid funds. Do donor countries consciously pursue the altruistic aim of increasing the total provision of IPGs from which every country in the world would benefit? Or do they expect nation-specific returns from their expenditures on IPGs? Are donor countries aware of the new task of managing global interdependencies assigned to ODA? Or are they just disillusioned with aid, thus egoistically diverting funds from development to seize the world-wide benefits that IPGs provide? Why do donors not separate expenditures to development and poverty reduction from those to IPGs? Do donors keep IPGs financing together with development aid just to increase the ODA level and formally reach the Millennium targets on aid? Has the concern for some IPGs become so great that, fearing underprovision, developed countries are ready to finance the shares that less developed ones cannot afford to grant? Do donors take into account the provision technologies of IPGs and do they act cooperatively when required?
This paper tries to provide some tentative answers to these questions focusing on aid financing of those IPGs that can be termed global public goods (GPGs), i.e. that provide benefits that extend worldwide and that are globally non-rival and non-excludable. This excludes IPGs that are regional public goods and thus provide non-rival and non-excludable benefits only to a limited number of countries.
Canavire et al., 2005). A second caveat concerns a fundament limit of this research: the picture of GPGs financing would need to be completed with the consideration of explicit, non-ODA financing through the national budgets, which could complement or substitute for the share of GPGs that are funded through the ODA channels.
1.1. Outline of the paper
Estimates of aid financing of IPGs and GPGs vary a lot, ranging from 3.7 per cent (Anand, 2002) to 12.5 per cent (1994-98; World Bank, 2001), to 16 per cent (1997-99; Reisen et al., 2004) and to 25 per cent (Raffer, 1999). These differences are almost entirely attributable to differences in the definition of what “international/global” is3. In the line of Reisen et al. (2004), we construct our definitions of GPGs according to the spatial dimension of the aid financed activities and we include only those activities whose benefits spread worldwide. When possible, we also try to make reference to the third dimension of ‘publicness’ of GPGs, namely their ‘aggregation technology’, or the manner in which contributions determine the aggregate provision level.
Our estimates of GPGs financing include the update of Reisen et al. (2004) aggregate (from now on GPG_OECD) and the introduction of two new aggregates. The first is designed to capture the GPGs that should be financed to attain the Millennium Development Goals (GPG_MDG); the second aggregate (GPG_E) broadens the OECD definition by including new sectors. This second aggregate will be used as our benchmark.
The paper then develops along the following lines. First, we search for the presence of a substitution effect, where the financing of IPGs displaces other aid spending (te Welde, 2002; Reisen et al., 2004), for the period 1995-2006. With respect to previous studies, we compare the effect of the adoption of different definitions of GPGs on the substitution effect and we try to show the relevance of this effect for the single donor countries.
The second objective is to focus on differences in the importance that donors attach to the various types of GPGs (as it is done also by te Velde et al., 2002), trying to detect a regular pattern in their choices of financing. The paper adds to previous studies by extending the analysis to multilateral aid financing of GPGs. Multilateral financing, which implies common-pool funding, gives donors less control over their donations than bilateral aid4. It, thus, offers fewer occasions for strategic behavior. However, it is an increasingly important source of GPGs financing.
Then, the analysis focuses on a larger number of determinant variables for GPG financing, which are subsumed under two dominant types: preferences and constraints. We investigate whether preferences for redistribution and national public goods financing within the donor countries influence their choice of GPG financing and which role is played by donors’ openness to the rest of the world and their altruistic concern for recipient countries.
3
According to Birdsall (2006) and OECD (2004), regional public goods amounted to 23.9 per cent in 1997 and to 14.9 per cent in 2002. These data refer to a broad definition of regional public goods, which captures any support that might have spillover effects into neighbouring countries. When employing a stricter definition of a regional public good, including only projects with clear transborder properties (region-wide air transport, river development, rail transport, protection and pest control), the amount of development assistance for regional public goods is about 6 percent for 1997 and to less than 3 percent for 2002 (Birdsall,2006).
4
The state of donors’ public finances acts as a constraint. However, even if aid could be one of the first budgetary items to be cut in case of budgetary strains, GPGs could move in different directions. When GPGs are of primary concern, such as health emergencies are, their financing through aid could be kept or even increased.
Using data from 1995 to 2006 for 22 countries, we first perform a statistical analysis of the correlations between ODA and GPG expenditures and their potential determinants. Then, through a panel analysis, we estimate the donors’ committed expenditure to aid funded GPGs and we evaluate the relevance of different explanatory variables.
The outline of the paper is as follows. Section 2 presents the data and the definitions of GPGs adopted. Section 3 offers a description of the evolution of aid financed GPGs from 1995 to 2006 and Section 4 presents a more detailed analysis of bilateral and multilateral financing by donors and categories of intervention. Section 5 presents the analysis of the determinants of ODA and GPGs and Section 6 presents the results of the estimation of a GPG financing supply function through a panel analysis. Section 7 concludes.
2. Data and definitions of GPGs
The estimates of aid financing of GPGs provided in this paper are based on the Aid Activity database of the DAC-OECD, i.e. the Creditor Reporting system (CRS), which offers a sector allocation of aid based on common definitions agreed by all DAC countries. The CRS data
refer to payments and commitments by DAC countries and multilateral organizations5 and to
total flows (grants and loans). The estimates of GPGs provided in this paper are given for bilateral and multilateral levels, by categories and by donors and they include both loans and grants, as, in general, the GPGs financing is not peculiarly skewed towards grant-financing as
compared to ODA (Anand, 2004, p. 231)6.
The CRS database records flows according to 194 sectors of destination, which are selected according to their local, regional or global dimension. This choice involves a degree of arbitrariness, as the distinction between global, regional, and national goods is not always uncontroversial. Table A.1 provides a summary of the different definitions adopted in some previous analyses of aid spending on international public goods (World Bank, 2001; te Velde et al., 2002; Reisen et al., 2004).
The main difference between this paper and previous studies by the World Bank (2001) and te Velde et al. (2002), is that the latter refer to IPGs (both global and regional public goods) and that they include in their definition only those CRS sectors that are related to “core” activities. For example, they completely exclude the sector ‘Economic and financial governance’, as the CRS data base does not provide separate statistics for the core and non-core activities included in it and does not distinguish the financing allocated to the support of global economic integration (non-core activity) or to the participation in global forums (core
5
The time series for gross disbursements starts from 2002.
6
activity): economic and financial governance is treated as a complementary activity that is
national in range7. On the other hand, they include the expenditures for preventing or
alleviating the effects of conflicts, as these provide regional security benefits. World Bank (2001) includes post-conflict reconstruction and mine clearing, while te Velde et al. (2002) treat them as national public goods. Te Velde et al. (2002) also exclude emergency relief and aid to refugees, which are instead core activities according to World Bank (2001).
As in Reisen et al. (2004), this study distinguishes CRS activities according to a spatial dimension and focuses on ODA flows with a global spatial dimension. This implies excluding some activities that are “core” according to the World Bank, but which have a limited spatial dimension, for example, “post-conflict peace building of the United Nations peace operations” or “land mine clearance”, which have national/regional spatial dimension. On the contrary, the present study includes the expenditures for “narcotics control activities” that are functional to the provision of the global good ‘Crime control’, whose benefits have a global scale8.
The activities included in the data set present different degrees of rivalry and non-exclusivity (Arce and Sandler, 2002) and they are produced through the contributions of donor countries, which are aggregated according to different technologies: summation, weighted sum, weakest link and best shot technologies (Arce and Sandler, 2002; Stansfield et al. 2002). Available data of CRS sectors are too aggregated to enable to fully take into
account the aggregation technology of each GPG: nonetheless, some tentative general
considerations are provided. From the CRS database, 59 CRS sectors9 are aggregated into the following categories, which are standard in the literature (Zedillo and Thiam, 2006) and which will build the GPG aggregates:
Knowledge generation and dissemination. Knowledge can be generated by best-shot and/or summation technologies and this influences the direction of the financing flows. For example, vaccine development research has both summation and best-shot aggregation patterns (Stansfield et al., 2002). From the CRS database, we have chosen all sectors related to research, the building of statistical capacity and the financing to scientific institutions, excluding education provision, which is essentially a national good.
Human rights. Reisen et al. (2004) treats the protection of human rights and the working for gender equality and women’s empowerment as GPGs. On the contrary we deem that the benefits they generate are basically national, although their protection raises international concerns. Besides, we deem that treating human rights as GPGs is not appropriate, as they themselves are the reason for the provision of many GPGs (right to health, right to clean
7
The argument is that establishing global institutions to coordinate the provision or to directly provide international public goods is a core activity. Providing financial stability in one country is not an international public good; however, it is considered a complementary activity as it contributes to the overall stability and to the governance in that country. Besides, building governance capacity, especially in the context of economic policy and management, confers public benefits only at national level and is a complementary activity (Morrissey, 2002).
8
For a detailed description of the CRS sectors employed see Table A.1 in the Appendix.
9
water or air, right to education; Bizzarri, 2005). Thus, this category will be present only in the GPG_OECD aggregate.
Communicable disease control. Although the provision of health services is a national good,
the expenditures for communicable disease control are global in their effects. From the CRS
database, we choose two sectors: activities related to the prevention, control and combat of
sexually transmitted (including HIV/AIDS10) and activities related to infectious diseases
control (excluding tuberculosis and malaria, which have regional coverage). Available data cannot enable us to distinguish activities according to the proportion of benefits that can be
ascribed to a local dimension and the one that has an international range. Besides, the two CRS
sectors employed include activities that exhibit a mixture of aggregation technologies. For instance, finding a cure for AIDS or preventing the spread of a disease are best shot technologies. Disease prevention, elimination or eradication programs display weakest-link patterns of aggregation, because the smallest effort fixes the level of the global good provision. Controlling pest needs a weighted sum technology, as each country’s contribution has different additive impact (Stansfield et al., 2002).
Global governance. As already mentioned, both the World Bank (2001) and te Velde et al. (2002) exclude economic governance. Following Reisen et al. (2004), we include those activities that support the governing of international economic relations (such as trade, investment) and the macroeconomic and financial stability of developing countries. These activities are generally provided by summation technologies.
Crime control and global peace. Differently from World Bank (2001) and te Velde et al. (2002), we exclude from ‘Global Peace’ the reintegration of demobilized military personnel or land mine clearance, as they have a national or regional spatial dimension. On the contrary, we include the narcotics control activities that are functional to ‘Crime control’ on a global scale: these activities are often provided by a weakest/weaker link technology.
Global commons and sustainability. Environmental goods have a global public nature: biosphere protection, biodiversity protection, environmental projects related to fishery, and forestry policy are of global importance. All kinds of production technologies are present in this category, with a dominance of the summation type. Following Barrett (2005), we deem that the absence of climate change is a GPG and that addressing it would require new technologies that produce energy without emitting greenhouse gases. Therefore, in our estimates we include all activities related to alternative energy sources, which are classified as national goods by te Velde et al. (2002).
Communications. This category includes the CRS activities named Communications policy (policy, planning and programs, including postal service development), Telecommunications (telephone networks, telecommunications satellites) and the Free flow of information, which
10
we deem to have global spillovers. Production technologies are of the summation and of the weakest-link types.
The above categories are employed to construct three aggregates of GPGs (Table 1). The first one is built according to Reisen et al. (2004) definition (GPG_OECD): it includes Knowledge, Human rights, Communicable disease control, Global governance, Crime control and global peace, Global commons and sustainability. Differently from Reisen et al. (2004), we include all types of financing (grants and loans). The second aggregate, named Millennium Global Goods, includes the key GPGs that are relevant for the Millennium
Development Goals11 (GPG_MDG), as indicated by the UK Department for International
[image:9.595.103.496.385.512.2]Development (Speight, 2002): Knowledge, Communicable disease control, Global commons and sustainability, Global Governance. The third aggregate, which will be the benchmark in the discussion, is the largest one (GPG_E), as it includes the GPG_MDG categories plus Communications and Crime control and global peace. Both the GPG_MDG and the GPG_E aggregates exclude the category Human rights, which is a permanent concern at international level, but whose benefits are basically national.
Table 1 – Definitions of GPGs
Categories included GPG_OECD GPG_MDG GPG_E Knowledge generation and dissemination √ √ √
Human rights √
Communicable disease control √ √ √
Global governance √ √ √
Crime control and peace building √ √ Global commons and sustainability √ √ √
Communications √
As Table A.2 in the Appendix shows, the categories of GPGs we employ in the MDG and E aggregates do not match perfectly those chosen by Reisen et al. (2004), as we have added or removed some sectors. These changes affect especially Global commons, Crime control and Global Governance. For example, differently from Reisen et al. (2004), we include Conflict prevention and Post-conflict peace building in the category Crime control and global peace, as contemporary conflicts have all global spillovers and exert their influence on the world balance of powers (wars in Iraq, Israel and Palestinian, Georgia are examples of this). Besides, differently from the choices made by Reisen et al. (2004) for the Global commons category, we exclude the activities related to Family planning (planning services, counseling,
11
information, education, delivery of contraceptives), which, we deem, have a national/regional dimension, and those related to the hydro-electric power plants, as they are often an element of environment disruption rather than promotion.
GPG aggregates are given in 2000 constant USD and expressed as shares on GDP, on ODA and also on ODA as corrected for debt forgiveness (ODAT). Debt forgiveness is retroactively recognized by the DAC accounting system as ODA grants, but it does not correspond to actual financial flows. This correction allows a better assessment of the actual transfers and of the shares of GPGs, as these latter are financed only out of actual financial flows. The total period 1995-2006 is considered as a whole and in three sub-periods, which are determined according to significant trends in the financing of ODA and GPGs: 1995-1998, 1999-2002 and 2003-2006.
3. Trends in aid financing to GPGs: 1995-2006
While the 1990s were characterized by aid stagnation due to the re-thinking of development policies after the end of the Cold War, the subsequent years saw an encouraging rise in ODA, due to the impulse of the global debate on poverty reduction, that took place at the beginning of the new millennium (Millennium Summit, 2000), and of the pledges of aid scale-up, renewed at the Monterrey (2002) and Gleneagles (2005) summits (Graph 1).
Graph 1 – ODA financing of GPGs (%): 1995-2006
0.00 2.00 4.00 6.00 8.00 10.00 12.00 14.00 16.00 18.00
1995 1996 1997 1998 1999 2000 2001 2002 2003 2004 2005 2006
%
0.00 0.05 0.10 0.15 0.20 0.25 0.30 0.35 0.40 0.45
%
ODA/GDP GPG_E/ODA GPG_MDG/ODA GPG_OECD/ODA ODA_T/GDP
Source: authors’ calculations based on OECD-CRS.
Notes: ODA transfers (ODAT) exclude debt forgiveness items from ODA. Right-hand scale is referred to total ODA to GDP and to ODA as corrected for debt forgiveness (ODAT) to GDP. Left-hand scale is referred to the shares of global goods to ODA and to ODA transfers for the three aggregates (%).
Int. Conference on financing of terrorism
UN Millennium Summit
Monterrey Summit Earth Summit
In the whole period 1995-2006, the volume of aid increased more than three times in current terms and by about 150 per cent in real terms: the evolution is less marked, when ODA is corrected for debt forgiveness. The UN target of aid to GDP (0.7 per cent by 2015) is still far from being honored, although the economic significance and the assumptions upon which it
was determined have been seriously challenged (Clemens and Moss, 2007).
Out of the total aid financing, a share of 11 per cent was devoted to the largest aggregate of GPGs in 1995: twelve years later this share has grown to 15.3 per cent (Graph 1), which is not an impressive rise. On a still minor scale (+ 2.2 p.p.), a similar rise can be detected also for the OECD and the MDG aggregates. For both aid and GPGs financing, turning points in the period seem to be associated with world summits and international conferences. The largest part of aid is provided by bilateral financing (73 per cent on average; 70.7 per cent on average when corrected for debt forgiveness). Bilateral aid is also the largest source of GPGs financing (about 76 per cent on average for the E aggregate).
3.1 Searching for a crowding out effect in bilateral aid financing of GPGs
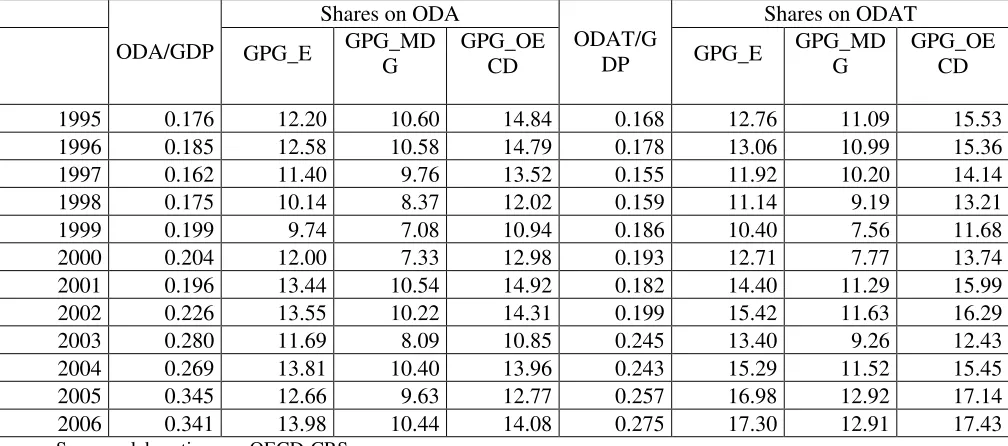
Depending on the definition adopted, GPGs represent a share of between 7 and 14 per cent of bilateral ODA. Table 2 shows the trend of these shares: a decline from 1995 to 1999, an upward surge from 2000 to 2002, some oscillations thereafter. The largest increase can be observed for the expanded definition: from 12.2 to 14 per cent. Higher shares of GPGs financing can be observed when ODA is corrected for debt forgiveness: the range of the ratios to ODAT goes then from 7.5 to 17.4 per cent.
As Reisen et al. (2004) analysis reports, “there is no straightforward way to test for crowding-out” (p. 28) associated to aid financed GPGs. The methodology adopted in the present study compares the growth rates of the ODA/GDP ratio and those of the GPG_i/ODA
ratio (i represents one of the three possible aggregates adopted), as in te Velde et al. (2002) .
The possible cases are:
1- absence of substitution effect: the share of resources devoted to ODA increases while the financing to GPG_i out of ODA keeps constant, diminishes or increases less; 2- substitution effect:
- only on the incremental side: the ODA/GDP ratio and the GPG_i/ODA ratio
increase at the same rate, meaning that every additional dollar spent in ODA is earmarked for GPGs;
- complete: the GPG_i ratio on ODA increases more than ODA/GDP, implying
Table 2 - Bilateral aid and GPGs financing: 1995-2006 ( %)
Shares on ODA Shares on ODAT
ODA/GDP GPG_E GPG_MD G
GPG_OE CD
ODAT/G
DP GPG_E
GPG_MD G
GPG_OE CD
1995 0.176 12.20 10.60 14.84 0.168 12.76 11.09 15.53 1996 0.185 12.58 10.58 14.79 0.178 13.06 10.99 15.36 1997 0.162 11.40 9.76 13.52 0.155 11.92 10.20 14.14 1998 0.175 10.14 8.37 12.02 0.159 11.14 9.19 13.21 1999 0.199 9.74 7.08 10.94 0.186 10.40 7.56 11.68 2000 0.204 12.00 7.33 12.98 0.193 12.71 7.77 13.74 2001 0.196 13.44 10.54 14.92 0.182 14.40 11.29 15.99 2002 0.226 13.55 10.22 14.31 0.199 15.42 11.63 16.29 2003 0.280 11.69 8.09 10.85 0.245 13.40 9.26 12.43 2004 0.269 13.81 10.40 13.96 0.243 15.29 11.52 15.45 2005 0.345 12.66 9.63 12.77 0.257 16.98 12.92 17.14 2006 0.341 13.98 10.44 14.08 0.275 17.30 12.91 17.43
Source: elaborations on OECD-CRS.
Notes: ODA transfers (ODAT) exclude debt forgiveness items from ODA.
The regression analysis proposed by te Velde et al. (2002) for the period 1980-98 is performed for sub periods from 1995 to 2006 and for all definitions,:
(1) gpgdit/oda = γ+ β odait/gdp+ γ1TD95-98+ γ2TD99-02
where is the first difference operator, necessary to eliminate the country-specific effect and to focus on the change between periods in each country; gpgdit/oda is the share of GPGs financed by ODA for country i at time t for the three definitions (d) of GPGs considered;
odait/gdp is the share of ODA spending on GDP and TD is a time dummy for the three
sub-periods considered. The same regressions are performed then for aid transfers (ODAT). We expect that changes in the ODA/GDP ratio entail changes of the same sign in the GPG/ODA ratio
Table 3 – Do aid financed GPGs crowd out other forms of aid expenditure?
a) GPG and total bilateral aid
gpgi/oda = β oda/gdp+ γ1TD95-98+ γ2TD99-02+γTD03-06
gpg_e/oda Coeff. gpg_mdg/oda Coeff. gpg_oecd/oda Coeff.
oda/gdp .349786 oda/gdp 3.805355 oda/gdp 3.467516 TD95-98 10.82204* TD95-98 7.819874* TD95-98 11.14259*
TD99-02 12.01694* TD99-02 7.294383* TD99-02 10.46597*
TD03-06 11.6144* TD03-06 7.112651* TD03-06 9.498748*
Num obs. 216 Num obs. 216 Num obs. 216
R-squared 0.7802 R-squared 0.7506 R-squared 0.7149
b) GPG and bilateral aid transfers
gpgi/odat = β odat/gdp+ γ1TD95-98+ γ2TD99-02+γTD03-06
gpg_e/oda Coeff. gpg_mdg/oda Coeff. gpg_oecd/odat Coeff.
odat/gdp -.312754 odat/gdp 3.458632 odat/gdp 2.883462 TD95-98 11.53154* TD95-98 8.418438* TD95-98 11.93041*
TD99-02 13.4598* TD99-02 8.11459* TD99-02 11.51061*
TD03-06 13.69216* TD03-06 8.893738* TD03-06 11.88989*
Num obs. 216 Num obs. 216 Num obs. 216
R-squared 0.8134 R-squared 0.7772 R-squared 0.7448
Note: subscript i is referred to one of the three definitions of global goods (E, MDG, OECD). Pooled ordinary least squares estimates. * significant at 5%.
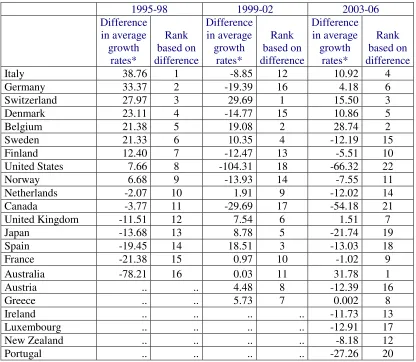
Table 4 offers a crude measure of the displacement effect in the DAC country, by presenting the differences between the growth rate of the GPG_E/ODAT ratio and the growth rate of ODAT. Countries are ranked according to the relevance of the displacement effect, whose presence is implied by a positive value of that difference.
The results show, in general, great dynamism in donors’ behavior. Some countries, like the US, Sweden, Norway, and Finland, which in the sub-period 1995-1999 displaced, on average, other forms of aid by GPG financing, have reversed this trend in more recent years. An opposite trend, from no displacement towards displacement, has been followed by Australia, France, and the UK, while the group of the Central European countries plus Italy continue to increase the presence of GPGs at the expenses of other forms of aid spending.
countries’ awareness of the necessity of increasing their contributions to the financing of GPGs, especially those with weakest or weaker link technologies that poorest countries cannot afford to pay.
[image:14.595.106.522.275.637.2]We leave open the question whether this erosion signifies a shift from generosity to greater selfishness by donor countries in times of declining prosperity and public finance difficulties. Alternatively, the displacement effect could signify a ‘selfish’ reassessment of the donor-specific gains from development aid compared with the world-wide benefits from GPGs. Sections 4 and 5 offer some tentative answers.
Table 4 - Ranking over the substitution effect of GPGs: ODA transfers financing to GPG_E and to other forms of aid
1995-98 1999-02 2003-06 Difference
in average growth
rates*
Rank based on difference
Difference in average growth
rates*
Rank based on difference
Difference in average growth
rates*
Rank based on difference
Italy 38.76 1 -8.85 12 10.92 4
Germany 33.37 2 -19.39 16 4.18 6 Switzerland 27.97 3 29.69 1 15.50 3 Denmark 23.11 4 -14.77 15 10.86 5
Belgium 21.38 5 19.08 2 28.74 2
Sweden 21.33 6 10.35 4 -12.19 15
Finland 12.40 7 -12.47 13 -5.51 10 United States 7.66 8 -104.31 18 -66.32 22
Norway 6.68 9 -13.93 14 -7.55 11
Netherlands -2.07 10 1.91 9 -12.02 14 Canada -3.77 11 -29.69 17 -54.18 21 United Kingdom -11.51 12 7.54 6 1.51 7
Japan -13.68 13 8.78 5 -21.74 19
Spain -19.45 14 18.51 3 -13.03 18 France -21.38 15 0.97 10 -1.02 9 Australia -78.21 16 0.03 11 31.78 1
Austria .. .. 4.48 8 -12.39 16
Greece .. .. 5.73 7 0.002 8
Ireland .. .. .. .. -11.73 13
Luxembourg .. .. .. .. -12.91 17
New Zealand .. .. .. .. -8.18 12
Portugal .. .. .. .. -27.26 20
Source: Authors’ calculations based on OECD-CRS. ODAT excludes debt forgiveness items from ODA. * Positive differences between the growth rate of the GPG_E/ODAT ratio and the growth rate of ODAT imply the presence of a substitution effect. When the difference is zero there is substitution effect only on the incremental side. A negative value for the difference implies no substitution effect.
3.2 An increasing trend in multilateral aid financing to GPGs
grow more smoothly, probably due to the more stable financing that programs promoted by multilateral agencies enjoy (Graph 2). As debt forgiveness is almost irrelevant for multilateral aid, the trend of multilateral ODAT replicates that of multilateral ODA.
Graph 2 –Multilateral aid and aid transfers and shares of GPGs: 1995-2006 (constant USD, million and %)
0 5000 10000 15000 20000 25000 30000
1995 1996 1997 1998 1999 2000 2001 2002 2003 2004 2005 2006
U
S
D
m
il
li
o
n
0 2 4 6 8 10 12 14 16 18
%
Multilateral ODA (USD constant) Multilateral ODAT GPG_OECD/ODA GPG_E/ODA GPG_MDG/ODA
Source: Author’s calculations based on OECD-CRS. Notes: ODA transfers excludes debt forgiveness items from ODA. Left-hand scale is referred to total multilateral ODA and multilateral ODAT. Right-hand scale is referred to the shares of global goods to multilateral ODA for the three definitions.
The aggregate E of GPGs represents 8 per cent of multilateral ODA at the beginning of the period and reaches 16 per cent in 2006. GPGs compete with other aid spending in multilateral financing. Their average annual growth (Table 5) is about 7.8-8.4 per cent, while it is about 4.5 per cent for total multilateral ODA. In the sub-periods, the rates of growth for GPGs are
always higher than those of multilateral aid for all aggregates12. This means that international
financing has increasingly financed those multilateral agencies whose mission is the provision of GPGs, such as the Joint United Nations Program on HIV/AIDS (UNAIDS) or the Global Fund to Fight AIDS, Tuberculosis and Malaria (GFTAM).
A crowding out effect can thus be detected also for multilateral aid, in the sense that multilateral programs have been increasingly directed towards global goods provision. As for bilateral aid, this change in the target of multilateral financing can be explained either because GPGs are in some cases a pre-requisite for the provision of development aid, or because
12
donors in international agencies have increasingly required the financing of goods with worldwide spillovers from which they would themselves benefit. When at international level the decision to contribute is a voluntary one and “[...] the arrangements are to raise the monies needed, they must somehow make it in the interests of the countries to contribute (Barrett, 2007, p. 105)”.
Table 5 – Average rates of growth of multilateral aid financing to GPGs(1995-2006)
Av. Annual Rate of growth
1995-2006
Av. Annual Rate of Growth
1995-1998
Av. Annual Rate of Growth
1999-2002
Av. Annual Rate of Growth
2003-2006
Multilateral ODA/GDP 4.46 8.91 -0.62 6.19
GPG_E/Multilateral ODA 7.89 9.55 2.75 11.78 GPG_MDG/Multilateral ODA 7.80 9.31 0.95 13.53 GPG_OECD/Multilateral ODA 8.45 11.28 3.16 11.61
Source: Author’s calculations based on OECD-CRS.
4. The composition of aid financing to GPGs
This section gives insights into the composition of aid financing of GPGs according to the six categories into which they are grouped. When examining bilateral aid financing, the focus is first on the pattern of financing displayed by single donors and then on their composition.
The composition and the evolution of the aid financing to GPGs between 1995-1997 and 2004-2006 are summarized in Graph 3 for the E aggregate which is the only one we consider in this section13. Expenditures for the Global commons and sustainability, which represented the largest share of total financing in 1995-1997, have substantially decreased in time as a share on the total GPGs. A reduction is detected also for the expenditures on Communications. Both categories have been substituted by Communicable disease control, which covered only 9 per cent of the expenditures in 1995-1997 and reaches 28.3 per cent twelve years later. Expenditures on Crime control and Global peace also represent an increasing share of financing. Therefore, we observe both an increase in aid financed GPGs and a change in their composition.
13
Graph 3 – The composition of total, bilateral and multilateral aid financing of GPGs (GPG_E) (av. 1995-1998 and 2003-2006; %)
8.56 9.09 26.75 2.41 42.80 10.38
7.58 28.34 21.66 17.10 19.33 5.99
8.58 8.39 21.90
2.52 45.21 13.41
8.90 25.49 17.02 21.82 19.67 7.12
7.80 12.33 39.69 2.32 37.29 0.57
3.36 37.01 35.67 2.55 18.64
2.78
0% 20% 40% 60% 80% 100%
1995-98 2003-06 1995-98 2003-06 1995-98 2003-06 Total ODA Bilateral ODA Multilateral ODA Knowledge generation and dissemination Communicable disease eradication Global governance Crime control Global commons and sustainability Communications
Source: Author’s calculations based on OECD-CRS.
Higher growth rates are observable by the categories which include GPGs provided by weakest-link technologies: Crime control and Communicable disease control. GPGs provided mostly by summation or best-shot technologies (Communication, Knowledge generation and dissemination, Global governance) show lower and sometimes negative growth rates. Global commons, which includes GPGs with a dominance of summation technologies, presents the worst trend.
4.1 Ranking donors
Bilateral donors tend to finance four categories of GPGs (Graph 3): Crime control, Communicable disease control, Global governance and Global commons. The first three present a sustained growth in the period, while the expenditures for environment are declining in time. In 2003-2006, the largest share of financing is devoted to Communicable disease control (25.5 per cent), while twelve years before the expenditure for environmental global goods had the primacy (45.5 per cent).
Graph 4 and 5 shows the different role played by DAC countries in GPGs financing at
the extremes of the period. On average, donors devoted 9 per cent of their ODA financing to
GPGs in 1995-1998 (Graph 4). This share reached its lowest values in Austria (3.6 per cent) and Portugal (1.2 per cent). Some countries (Ireland, Greece, Luxembourg, and New Zealand) had no financing of GPGs at the time. Eleven donors had shares of GPGs to bilateral ODA larger than 9.7 per cent, reaching the maximum values for the Nordic countries, Australia and the US (22 per cent). Twelve years later (Graph 5), in 2003-2006, we observe a general increase in bilateral ODA financing of GPGs. All countries, without an exception, devote part of their bilateral aid to GPGs. Six of them have decreased their financing, Belgium and the
US have kept their shares more or less constant and all the others have increased them14.
The ratios of GPGs financing to ODA change, when we correct ODA for debt forgiveness. The relevance of debt forgiveness is very uneven among DAC counties in the period. It is null for Luxembourg, New Zealand, Ireland, and Greece and almost insignificant for Norway, Finland, Netherlands, Portugal, and Sweden, while it represents a significant share of aid for some countries: 55 per cent of aid in Austria and 50.6 per cent for Italy in the years 2003-06. When we apply this correction, the shares of global goods financing increase for the countries that have significant values of debt forgiveness. Then, in 2003-06, about 10 per cent of Austria aid financing results to be devoted to GPGs, and also Italy’s tiny share on ODA increases from 4 to 6.3 per cent. Also UK, Belgium, France and Germany present increases in their shares of GPGs financing by 3-4 p.p.
14
Graph 4 – Bilateral aid financing of GPG_E (%, 1995-98)
-150 -100 -50 0 50 100 150
-50 0 50 100
under 4.479347
4.479347 - 9.735744
9.735744 - 12.746551
over 12.746551
Graph 5 – Bilateral aid financing of GPG_E (%, 2003-06)
-150 -100 -50 0 50 100 150
-50 0 50 100
under 8.014076
8.014076 - 12.5373
12.5373 - 13.718688
over 13.718688
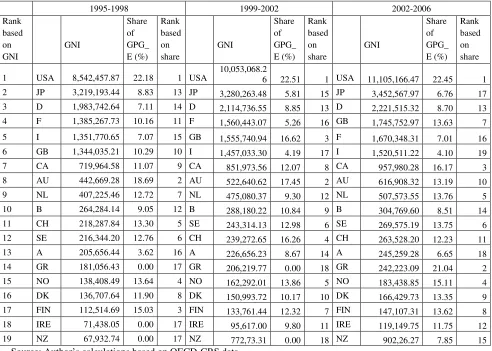
In order to better assess the position of each donor country in GPGs financing,
countries are first ordered in ascending order in terms of their average GNI15, a proxy not only
[image:20.595.60.552.324.675.2]for ability-to-pay but also for benefits from GPG provision, as in Barrett (2007). This ranking is then compared to the ranking according to the donors’ share of GPG_E on bilateral ODA (Table 6). An increasing gap between donors’ potential appropriable benefits and their contribution to GPGs can be observed, as we move from Anglo-Saxon countries and Northern Europe to Southern Europe. The Northern European countries’ contribution to GPGs exceeds their position as contributors and potential beneficiaries. Among the Anglo-Saxon countries, the US are characterized by a perfectly coherent relation of benefit-contribution, while Canada, Ireland and New Zealand tend to contribute more and the UK less than their rank in the GNI. Italy, instead, shows a downward trend in its share of global goods financing even if its average GNI would imply increasing benefits from GPGs.
Table 6 - Ranking over GNI vs ranking over the share of GPG_E on bilateral ODA
1995-1998 1999-2002 2002-2006
Rank based on GNI
GNI
Share of GPG_ E (%)
Rank based on share
GNI
Share of GPG_ E (%)
Rank based on share
GNI
Share of GPG_ E (%)
Rank based on share
1 USA 8,542,457.87 22.18 1 USA
10,053,068.2
6 22.51 1 USA 11,105,166.47 22.45 1 2 JP 3,219,193.44 8.83 13 JP 3,280,263.48 5.81 15 JP 3,452,567.97 6.76 17
3 D 1,983,742.64 7.11 14 D 2,114,736.55 8.85 13 D 2,221,515.32 8.70 13
4 F 1,385,267.73 10.16 11 F 1,560,443.07 5.26 16 GB 1,745,752.97 13.63 7
5 I 1,351,770.65 7.07 15 GB 1,555,740.94 16.62 3 F 1,670,348.31 7.01 16
6 GB 1,344,035.21 10.29 10 I 1,457,033.30 4.19 17 I 1,520,511.22 4.10 19
7 CA 719,964.58 11.07 9 CA 851,973.56 12.07 8 CA 957,980.28 16.17 3
8 AU 442,669.28 18.69 2 AU 522,640.62 17.45 2 AU 616,908.32 13.19 10
9 NL 407,225.46 12.72 7 NL 475,080.37 9.30 12 NL 507,573.55 13.76 5
10 B 264,284.14 9.05 12 B 288,180.22 10.84 9 B 304,769.60 8.51 14
11 CH 218,287.84 13.30 5 SE 243,314.13 12.98 6 SE 269,575.19 13.75 6
12 SE 216,344.20 12.76 6 CH 239,272.65 16.26 4 CH 263,528.20 12.23 11
13 A 205,656.44 3.62 16 A 226,656.23 8.67 14 A 245,259.28 6.65 18
14 GR 181,056.43 0.00 17 GR 206,219.77 0.00 18 GR 242,223.09 21.04 2
15 NO 138,408.49 13.64 4 NO 162,292.01 13.86 5 NO 183,438.85 15.11 4
16 DK 136,707.64 11.90 8 DK 150,993.72 10.17 10 DK 166,429.73 13.35 9
17 FIN 112,514.69 15.03 3 FIN 133,761.44 12.32 7 FIN 147,107.31 13.62 8
18 IRE 71,438.05 0.00 17 IRE 95,617.00 9.80 11 IRE 119,149.75 11.75 12
19 NZ 67,932.74 0.00 17 NZ 772,73.31 0.00 18 NZ 902,26.27 7.85 15
Source: Author’s calculations based on OECD-CRS data.
Note: Spain, Portugal and Luxembourg are excluded because of absence of GNI data. GNI data are averages in constant 2000 USD.
15
Even if Mascarenhas and Sandler (2006) suggest that donors’ decisions on how much aid to allocate are generally independent of the actions of other donors, we can detect groups of donors that display more homogeneous patterns of global goods financing (Table 7). Anglo-Saxon countries have lower than average values of aid and global goods financing, in terms of GDP and population, but they have the highest shares of global goods on total bilateral ODA and bilateral ODA transfers. These countries display an increasing uniform pattern in ODA and GPG financing. Northern European countries have higher than average values for both ODA and GPGs and the lowest dispersion for the share of global goods on total bilateral ODA and ODA transfers. These countries also show an increasing uniformity. Central European and Southern European countries are less homogeneous groups with respect to both ODA and GPGs provision. Central European countries and Japan have ODA values that are about or above the average, but they have lower than average shares of global goods to ODA. Southern European countries have the lowest average values for all variables. These countries are also relatively less homogeneous, especially with respect to their share of global goods to GDP and ODA.
Table 7 - Bilateral aid financing of GPG_E by groups of donors (1995-2006)
1995-1998 1999-2002 2003-2006
ODA/GDP (%)
GPG_E/ GDP (%)
Share of GPG financing on bilateral
aid (%)
GPG_E/ bilateral ODAT (%)
ODA/GDP (%)
GPG_E/ GDP (%)
Share of GPG financing on bilateral
aid (%)
GPG_E/ bilateral ODAT (%)
ODA/GDP (%)
GPG_E/G DP (%)
Share of GPG financing on bilateral
aid (%)
GPG_E/ bilateral ODAT (%)
All countries (22)
Average 0.296 0.035 10.882 11.443 0.352 0.040 12.472 13.578 0.432 0.049 11.812 13.278
Rel. Std. Dev. 0.816 1.022 0.572 0.543 0.732 0.823 0.709 0.657 0.708 0.840 0.505 0.436
Anglo-Saxon countries (6)
Average 0.164 0.025 15.089 16.121 0.202 0.031 15.611 16.256 0.273 0.038 14.173 15.575
Rel. Std. Dev. 0.550 1.202 0.545 0.495 0.361 0.482 0.385 0.391 0.368 0.432 0.365 0.389
Northern European countries (4)
Average 0.581 0.073 13.332 13.775 0.634 0.078 12.335 12.489 0.778 0.108 13.954 14.370
Rel. Std. Dev. 0.500 0.477 0.268 0.272 0.445 0.541 0.288 0.276 0.375 0.435 0.218 0.214
Central European Countries (7)
Average 0.296 0.030 9.175 9.835 0.413 0.039 9.426 11.162 0.533 0.049 9.161 11.548
Rel. Std. Dev. 0.554 0.854 0.501 0.465 0.574 0.723 0.523 0.452 0.552 0.670 0.523 0.452
Southern European countries (4)
Average 0.081 0.005 5.754 6.124 0.143 0.021 15.718 17.763 0.151 0.014 12.030 12.975
Rel. Std. Dev. 0.483 1.056 0.771 0.735 0.455 0.882 1.133 1.002 0.772 0.731 0.819 0.716
Japan
Average 0.360 0.032 8.829 9.013 0.274 0.016 5.813 6.044 0.415 0.028 6.765 8.456
Rel. Std. Dev. 0.030 0.000 0.205 0.200 0.142 0.221 0.246 0.240 0.135 0.168 0.131 0.184
Table 8 - The composition of GPG_E spending by groups of donors and sectors: 1995-2006 (%)
Knowledge generation and dissemination
Communicable disease
eradication Global governance
Crime control and peace building
Global commons and
sustainability Communications
1995-1998
1999- 2002
2003-2006
1995-1998
1999- 2002
2003-2006
1995-1998
1999- 2002
2003-2006
1995-1998
1999- 2002
2003-2006
1995-1998
1999- 2002
2003-2006
1995-1998
1999- 2002
2003-2006
Anglo-saxon
countries 5.33 4.28 4.00 14.10 24.68 36.42 36.96 18.41 18.85 3.47 34.54 29.62 34.90 16.77 7.99 5.24 1.31 3.12
Nordic
countries 12.53 21.59 22.13 6.95 14.48 16.41 13.20 12.29 10.21 5.18 7.13 10.92 51.33 38.15 34.46 10.80 6.37 5.87
Central European countries
22.36 9.53 25.84 8.93 11.70 12.53 9.00 15.16 16.01 1.73 8.88 10.83 46.49 49.83 31.83 11.48 4.91 2.97
Southern European countries
11.53 6.77 11.81 5.14 4.87 11.00 2.31 7.82 10.62 7.48 46.95 27.71 38.96 27.15 33.17 34.58 6.44 5.69
Japan 1.09 2.53 4.10 1.34 4.53 3.86 15.36 2.50 16.05 0.00 0.56 0.59 57.64 79.22 63.98 24.58 10.65 11.42
4.2 The international agencies financing of GPGs
Multilateral aid finances about 23 per cent of total global goods (definitions E) in 2003-2006, with a preference for Global governance (35.6 per cent), Communicable disease eradication (37 per cent) and, on a lesser scale, for Global commons (18.6 per cent) (Graph 3): these categories absorb 91.2 per cent of the total financing. The same categories, but with higher shares for the Global commons (39.7 per cent), were financed also in 1995-98. As the DAC countries in general, also international agencies have increasingly financed weakest-link GPGs (especially in the health sector ), but they have not stepped from summations GPGs, like Communications and Global governance.
As Graph 6 shows, multilateral aid financing to GPGs comes primarily from the European Commission (35.8 per cent) and the International Development Association (IDA) of the World Bank (28.8 per cent), which confirms the relevant position in the financing that was observed by te Velde et al.(2002). The Global Fund to Fight AIDS, Tuberculosis, and Malaria (GFATM) has also a relevant share of 19.8 per cent on the total financing.
Graph 6 - International agencies financing of GPGs (E) (av. 2003-06, %)
AfDB 0%
AfDF 6%
AsDB 0%
AsDF 2%
EC 36%
IBRD 0% IDA
29%
IDB 0% IDB Sp.Fund
1% IFAD
1% UNDP
0% UNICEF 1% UNAIDS
4% UNFPA0%
GFATM 20%
Source: Author’s calculations based on OECD-CRS data.
GPGs financing seen as a share of each organization’s total aid commitments amounts to about 12 per cent for the European Commission, IDA and the IDB special operations fund. The Joint United Nations Program on HIV/AIDS (UNAIDS) devotes almost its whole aid budget to Global disease control and GFATM a share of 56 per cent.
There are generally one or two leader donors in the provision of the different global goods (Graph 7): the EC for Knowledge and Crime control, GFATM for Communicable disease eradication, EC and IDA for the other goods. The European Commission has a much more diversified allocation of its funds to GPGs. It finances all categories, with a preference for Global governance and for Environmental goods. IDA finances the same global goods with a preference for Global governance.
Graph 7 - The contribution of multilateral agencies to different categories of GPGs (GPG_E, average 2003-06, %)
Source: Author’s calculations based on OECD-CRS data.
Legenda. AfDB: African Development Bank; AfDF: African Development fund; AsDB: Asian Development Bank; AsDF: Asian Development Fund; EC: European Commission; IBRD: International Bank for Reconstruction and development; IDA: International Development Association; IDB: Inter-American Development Bank; IDB Sp. Fund: Inter-American Development Bank Special Fund; IFAD: International Fund for Agricultural Development; UNDP: United Nation Development Program; UNICEF: United Nations Children's Fund; UNAIDS: Joint United Nations Programme on HIV/AIDS; UNFPA: United Nations Populations Fund GFATM: Global Fund to Fight AIDS, Tuberculosis, and Malaria.
each focused on one specific category. Kanbur et al. (1999) and Rajaraman and Kanbur (1999) suggest that aid should be channeled through a common pool mechanism. Kanbur (2001) favors a single global organization with several sector specialist sub-agencies.
5. Determinants of bilateral financing of aid and GPGs
This section focuses on the bilateral aid, trying to disentangle the factors that determine the donors’ decision of GPG financing. The empirical literature on the factors influencing aid
allocation16 provides two patterns of modeling: i) hybrid models and ii) donor interest/ recipient
needs models. In hybrid models the aid flows are explained by a combination of variables representing political, commercial, and humanitarian motives. In donor interest models and in
recipient needs models, the egoistic and altruistic side of the action of the donor are separated17.
We adapt the hybrid model, focusing on the donor, separating the two stages, how much to give
and how to allocate, and concentrating on the first one. The determinants of the financing flows are then to be found not just in the conditions of the recipient and among the hidden interests of
donors, but also in the preferences and conditions of the donors18. The result is that recipients are
considered as a unicum, which is consistent with our interest in global goods financing, where benefits of GPGs are potentially equal for all countries and the relevant role is that of the financer/producer.
5.1 Determinants of bilateral ODA
As in Reisen et al. (2004), we first analyze the source of GPGs financing, namely bilateral ODA, in total and as corrected by debt forgiveness. The variables considered can be roughly divided into two groups, i) indicators of preferences for bilateral aid and GPGs, and ii) indicators of
constraints. The first group includes variables that summarizes the country’s position with respect to: (a) the financing of public expenditure; (b) the degree of openness to the rest of the world; (c) the preference for redistribution both within the country and (d) between countries; (e) the importance given to country-specific gains from aid. The second group includes variables related to the state of the donor’s public finances. We expect that when the budgetary situation is under strain, less effort can be devoted to financing development abroad: ODA becomes one of the first items to be cut under a budget tightening, like public investment, and it is resumed when the state of public finances improves.
Table 9 presents the correlations between determinant variables, and the ratios ODA/GDP and ODA transfers/GDP, in the three sub-periods. There are other country-specific factors impact on the level of bilateral aid that we do not explicitly take into account. For example, some countries like Italy prefer to contribute to multilateral agencies rather than to bilateral aid, given the fact that multilateral programs are less labor-intensive and the structural
16
For a survey see McGillivray and White (1993).
17
The types of models appeared in literature are more than just the two types considered here: there are also bias models, stressing certain phenomena like the small-country effect or medium-income effect; developmental models, which, in a certain way, are similar to recipient needs model but with more stress on the role of developmental variables representing the ability to absorb aid; limited dependent variable models including the eligibility for aid choice.
18
and operational deficiencies of the departments in charge of bilateral flows (Maurini and Settimo, 2009).
[image:28.595.57.531.256.707.2]We don’t find any remarkable difference in the correlation strength for the two definitions of aid (ODA and ODAT), probably because the reasons for the expenditure are very similar. The three sub-periods present a certain stability in the significant variables, as if the variability of the composition of the aid could be explained by a constant set of reasons. In particular, among the variables related to openness, a large outward direct investment position (as in Reisen et al., 2004) and foreign direct investment outflow are significant and positively correlated with aid for all the sub- periods.
Table 9 - Correlation coefficients for the ODA to GDP ratio
1995-1998° 1999-2002 2003-2006
ODA/GDP ODA
transfers/GDP ODA/GDP ODA
transfers/GDP ODA/GDP ODA transfers/GDP
Outward direct investment position /GDP 0.6029* (0.0104) 0.5907* (0.0125) 0.7098* (0.0002) 0.7346* (0.0001) 0.6985* (0.003) 0.6793* (0.0005) O p en n es s to r es t o f th e w o rl d
FDI outflow %GDP- 2006 0.4265** (0.0878) 0.4706** (0.0566) 0.6680* (0.0007) 0.6770* (0.0005) 0.5438* (0.0089) 0.4726* (0.0263)
Gini index -0.7133*
(0.0092) -0.8322* (0.0008) -0.6000 * (0.0181 ) -0.5092** (0.0813) -0. 5845* (0.0174) -0.5476* (0.0281) A lt ru is m w it h in t h e co u n tr y
Social expenditure %GDP 0.2425 (0.3322 ) 0.3230 (0.1911) 0.3461 (0.1146) 0.1959 (0.3822) 0.4297* (0.0459) 0.2840 (0.2002)
CDI index av. - 2004-06 no data no data no data no data 0.5662* (0.0075)
0.5558* (0.0089 )
Tied aid (%) -0.2941
(0.2361) -0.2755 (0.2684) -0.2286 (0.3324) -0.1774 (0.4542) -0.3865** (0.0923 ) -0.4737* (0.0349) A lt ru is m b et w ee n co u n tr ie s
Effectiveness perceived of national aid (Eurobarometer) (a) 0.7255* (0.0033) 0.7630* (0.0015)
Public expenditure on Health 0.0052 (0.9838) 0.0010 (0.9968) -0.0474 (0.8339) -0.2016 (0.3682) -0.0689 (0.7605) -0.2181 (0.3296) Public expenditure on
Education 0.5209** (0.0562) 0.5033** (0.0666) 0.5421* (0.0165) 0.4158** (0.0766) 0.5860* (0.0084 ) 0.5509* (0.0145 ) General government final
consumption expenditure (%GNI) 0.8132* (0.0007) 0.8077* (0.0008) 0.6667* (0.0048) 0.5092* (0.0440) 0.5971* (0.0146) 0.5294 * (0.0350) P re fe re n ce f o r p u b li c g o o d s
Gross domestic expenditure on R&D 0.3583 (0.1443) 0.4812* (0.0432) 0.3970** (0.0674) 0.3936** (0.0700) 0.4320* (0.0447) 0.3811** (0.0801) General Government
financial balance (% GDP)
0.4964* (0.0361) 0.4716* (0.0482) 0.4128** (0.0562) 0.4952* (0.0191) 0.3710** (0.0892) 0.4387* (0.0411) General government gross
financial liabilities -0.0857 (0.7354) 0.0031 (0.9903) -0.2840 (0.2002) -0.2942 (0.1839) -0.2422 (0.2774) -0.3303 (0.1332)
Maastricht debt/GDP (a) 0.2238 (0.4845) 0.2937 (0.3541) -0.4676 ** (0.0678 ) -0.6059* (0.0129 ) -0.4059 (0.1188 ) -0.5529* (0.0263 ) E co n o m ic l ia b il it ie s Interest expenditure/GDP (a) -0.0364 (0.9155) 0.0727 (0.8317 ) -0.2622 (0.3267 ) -0.3358 (0.2035 ) -0.4061 (0.1331 ) -0.5868* (0.0215 )
Source: Author’s calculations based on OECD-CRS data.
The preference for domestic inequality, as summarized by the Gini index, is negatively related to aid financing, meaning that countries that do not allow for much domestic
redistribution are less involved in international redistribution. With regard to altruism in
international relationships, a larger share of tied aid19 is negatively and significantly correlated with aid giving in the last interval, 2003-2006. It could be that conditionality on aid is associated with weaker altruism and smaller aid flows. Alternatively. the explicit decision to finance more extensively international programs possibly goes hand in hand with the lower necessity to buy internal consensus by imposing conditionality on aid. Moreover, the concern for development and for better quality in the relationships with other countries, as captured by the Commitment to
Development Index20, is significantly associated with larger aid giving. Another variable related
to altruism in international relationships, Effectiveness of national aid, expressing a great support to aid by the vast majority of the EU citizens (above 70% on average since 1990s), is
significantly and positively correlated with ODA21.
Out of the indicators of preferences forpublic goods, all variables, except expenditure on
health, are significantly related to aid. As in Reisen et al. (2004), this supports the hypothesis that a larger government is associated with higher spending also on international programs.
Among the indicators for the state of public finances, the general government financial balance, the Maastricht debt (last two periods), and the interest expenditure (last period and only
for ODA transfers) are significant22. This supports the hypothesis that part of the generosity in
aid financing is explained by the availability of public saving: countries undergoing a period of public finance distress or reform tend to cut all more flexible budget items, including the support to international programs. This conclusion is shared also by te Velde et al. (2002).
5.2 Determinants of GPGs
The analysis above is performed for the three aggregates of GPGs, adding two variables, population and gross national income pro capita23, as representatives of the potential direct benefits from GPG provision. As in Barrett (2007), we expect that a larger income and a larger
19
Tied aid is defined as loans and grants which are tied to procurement of goods and services from the donor country and from a restricted number of countries. The literature estimates that tying raises the cost of aid projects a typical 15–30 percent and reduces the value of aid by 13–23 percent.
20
There are no data of the CDI for the first two sub-periods.
21
Hudson and Van Heerde (2009), over the period 1990-2007, consider both a strict (including only questions on development aid) and a relaxed (including even questions on poverty in general) measure of public support: they find non-significant relations (respectively a negative and a positive one) with ODA. The authors stress how, even if there is a sort of unanimous consent to public intervention, which is confirmed for national policies, it is less evident for foreign policies. Their finding suggests us to take both results with caution, considering the low level of information of the public and the vagueness and not explicitness of the surveys.
22
General government gross financial liabilities are not significantly correlated with aid, probably because gross debt data are not always comparable across countries due to different definitions or treatment of debt components. In particular, debt data include the funded portion of government employee pension liabilities in some OECD countries, including Australia and the United States. The debt position of these countries is thus overstated relative to countries that have large unfunded liabilities for such pensions, which according to ESA95 are not counted in the debt figures.
23