http://dx.doi.org/10.4236/fns.2013.412160
Development and Validation of a Single HPLC Method for
Analysis of Purines in Fish Oil Supplements
Liton Roy, Chad C. Harrell, Alan S. Ryan, Thorsteinn Thorsteinsson, Frederick D. Sancilio
Department of R & D, Sancilio and Company, Inc., Riviera Beach, USA. Email: [email protected]
Received September 24th, 2013; revised October 24th, 2013; accepted November 2nd, 2013
Copyright © 2013 Liton Roy et al. This is an open access article distributed under the Creative Commons Attribution License, which
permits unrestricted use, distribution, and reproduction in any medium, provided the original work is properly cited. In accordance of the Creative Commons Attribution License all Copyrights © 2013 are reserved for SCIRP and the owner of the intellectual property Liton Roy et al. All Copyright © 2013 are guarded by law and by SCIRP as a guardian.
ABSTRACT
Gout is one of the most common forms of inflammatory arthritis, affecting over 8 million adults in the US. Individuals with gout are advised to avoid the habitual intake of purine-rich foods such as meats, seafood, purine-rich vegetables, and animal protein. An increased risk of developing or having subsequent attacks of gout is particularly associated with the consumption of seafood. However, clinical studies have shown that certain seafood and fish oil supplements that contain large amounts of omega-3 fatty acids provide important cardiovascular benefits. Individuals who might benefit from omega-3 fatty acid supplementation may therefore avoid fish oil products because they contain purines. Currently, there are no distinct high-performance liquid chromatography (HPLC) methods available in the literature that are vali-dated as per the International Conference on Harmonisation (ICH) guidelines for the analysis of omega-3 fatty acid oils or fish oil containing products for purine content. A robust, fast, and efficient reversed-phase high-performance liquid chromatography (RP-HPLC) method was developed and validated for the specific analysis of the naturally occurring purines guanine, purine, theobromine, and adenine. These purines are often found in fish oil and seafood. The analytical method reported herein quantifies all four purines in fish oil in about 20 minutes.
Keywords: Purines; Chromatography; Gout; Uric Acid; Omega-3 Fatty Acids
1. Introduction
Gout is a type of inflammatory arthritis that is associated with the accumulation of uric acid, also known as hype- ruricemia [1]. If too much uric acid accumulates in the blood, crystals (monosodium urate) are formed, and the crystals deposit in joints, tendons, and surrounding tis- sues. These crystals cause joints to swell and become in- flamed [1]. Gout leads to substantial morbidity and se- vere pain [1]. The prevalence of gout in the US has more than doubled between the 1960s and the 1990s [2]. Based on data from the latest nationally representative sample of US adults (National Health and Nutrition Examination Survey, [NHANES, 2007-2008]) the prevalence of gout was 3.9% (8.3 million individuals) in 2007-2008 [1]. A western diet, sedentary lifestyle, increased prevalence of obesity and hypertension, and increased use of diuretics and aspirin have been linked to the growing prevalence of gout [3]. In particular, the dietary intake of purine-rich foods such as red meats, anchovies, sardines, beans,
peas, lentils, and spinach is associated with hyperurice- mia because the human body produces uric acid when it breaks down purines [4]. The risk of gout associated with seafood consumption is particularly high, especially among men [5]. As a result, individuals who are suscep- tible to gout are often careful to avoid dietary products that contain large amounts of purines.
terol, especially in individuals with high triglyceride lev- els who are taking statins [6]. As a result, numerous die- tary supplements available in the marketplace, including cod liver oil, contain fish oil with the omega-3 fatty acids EPA and DHA. Additionally, the Food and Drug Ad- ministration (FDA) has recently approved two drugs (Lo- vaza® and Vascepa®) that contain concentrated levels of
omega-3 fatty acids from fish oil. These drugs are in- dicated for individuals with severe hypertriglyceridemia or elevated triglyceride levels (>500 mg/dL).
Purines in fish oil used for drugs and some dietary omega-3 fatty acid supplements are typically eliminated during the purification and distillation process. However, not all dietary omega-3 fatty acids supplements have been evaluated for purine content; some may contain in- determinate levels of purine. Other commercially avail- able products such as sardines and cod liver oil also have not been evaluated for purine content. The primary ob- jective of the present study is to describe a new re- versed-phase high-performance liquid chromatography (RP-HPLC) method that allows the testing of purine lev- els in omega-3 fatty acid fish oils and other fish products.
2. Experimental Methods
2.1. Chemical and Reagents
Guanine, purine, theobromine, and adenine were pur- chased from Acros Organics, NJ (Purity: 99.9%). HPLC grade solvents used for the sample preparations and chromatography analyses were obtained from Fisher Sci- entific, Pittsburgh, PA. Pharmaceutical grade, super con- centrated omega-3 fatty acid fish oil samples (Ocean Blue® Professional Omega-3 2100™) were obtained from
Sancilio and Company, Inc., Riviera Beach, FL. Com- mercially available fish oil from sardines and cod liver oil (Nature’s Way) were obtained from the local super- market (West Palm Beach, FL).
2.2. Instrumentation
The Agilent 1100 series HPLC system equipped with multiple wavelength detector, on-line degasser, and col- umn compartment with temperature control was used for method development and validation. Data acquisition, analysis, and reporting were performed using ChemSta- tion (Agilent) software. The HPLC columns (250 × 4.6 mm ID) and Luna 5u Silica 100A were purchased from Phenomenex, Torrance, CA. The ODS Hypersil 5u 120A was obtained from Thermo Scientific, Waltham, MA. The detection wavelength of 270 nm and sample injec- tion of 10 µL with an auto sampler was used.
2.3. Sample Preparation
Purine stock solution was prepared by transferring 5 mg of each purine standard into a 50 mL volumetric flask.
The solution was diluted to volume with diluent (80:20 methanol: water) to achieve a stock concentration of 100 µg/mL. For method validation experiments, stock purine solution was diluted with diluent to achieve the desired concentration levels relative to the analytical concentra- tion (1 µg/mL is also referred as 100% level). All sam- ples and mobile phase were stored at ambient tempera- ture.
Omega-3 fatty acid oil samples were prepared by transferring 100 mg of the oil into a 50 mL volumetric flask and then diluted with 95% methanol. Volume was adjusted with water. The mixture was sonicated for 1 hour to obtain a homogenous mixture.
2.4. Method Development
High aqueous RC-HPLC with end capped reverse phase columns was utilized to retain and separate polar com- pounds. Absorbance of the eluent was measured at 270 nm. Different mobile phase gradients of water and me- thanol were used during method development to obtain separation between purines. Initial experiments were conducted on the ODS Hypersil C18 250 × 4.6 mm col- umn. However, the Phenomenex Luna C18 250 × 4.6 mm produced the desired separation with tailing factors less than 2.0 for all purines and resolution of more than 2.0 between peaks at concentration levels ranging from 0.05 µg/mL to 100 µg/mL.
2.5. Method Validation Studies
The chromatographic method was validated for sensitiv- ity, linearity, range, accuracy, precision, specificity, and robustness. The sensitivity of the method was determined by establishing the limit of detection (LOD) and limit of quantitation (LOQ) for each purine with signal-to-noise- ratios of 3:1 and 10:1, respectively.
3. Results
The resolutions and tailing factors for the 4 purines are shown in Table 1. The resolutions are all greater than 2, whereas the tailing factors are not more than 2, which are in accordance with United States Pharmacopeia (USP) criteria. Chromatographic conditions are summarized in Table 2. The injection volume of 10 µL represents an acceptable level of reproducibility while extending the longevity of the column. The mobile phases of water and methanol facilitate use of the HPLC.
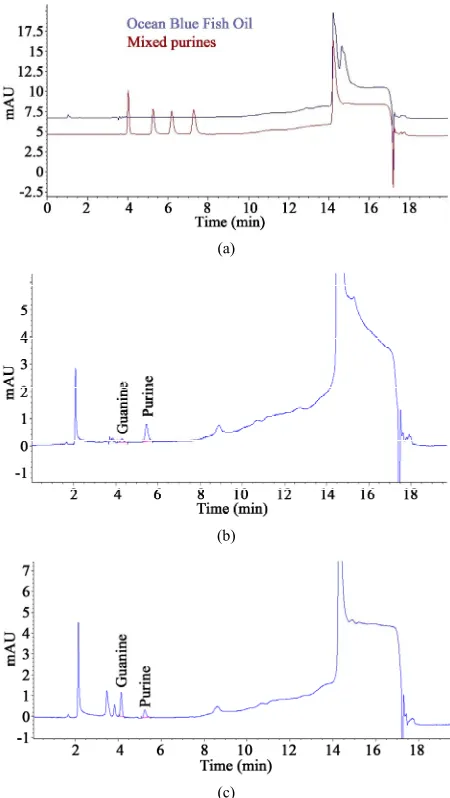
Figure 1 shows the representative chromatograms for each purine: guanine, purine, theobromine, and adenine at 10 µg/mL concentration, respectively. Since the method was conducted at 270 nm, the peaks of the chromato- grams for each purine are easy to distinguish.
Table 1. Resolutions (R) and USP tailing factors (TF) for the four purines evaluated.
Guanine Purine Theobromine Adenine Concentration
(µg/mL) R TF R TF R TF R TF
0.05 - 1.1 6.9 1.5 3.9 1.2 4.4 1.1
1 - 1.1 7.0 1.4 3.9 1.3 3.9 1.4
40 - 1.1 6.6 1.5 3.7 1.5 4.0 1.7
[image:3.595.56.286.235.397.2]100 - 1.1 4.6 1.6 3.4 1.8 3.2 2.0
Table 2. Chromatographic conditions.
Time (minutes) % MPB
0.0 1
3.0 1
10.0 35
10.10 85
13.0 85
13.1 1
20.0 1
Equipment: HPLC system with degasser, autosampler, and MWD detector. HPLC column: Phenomenex Luna Silica analytical column 250 × 4.6 mm 5 micron. Flow rate: 1.0 mL/min. Injection volume: 10 µL. Wavelength: 270 nm, 16 BW, Reference 360 nm. Mobile phase A: 100% Water. Mobile phase B: 100% Methanol. Column temperature: Ambient. Run time: 20 minutes.
Figure 1. HPLC chromatogram overlay of guanine, purine, theobromine, and adenine.
was free of purines. Fish oil obtained from sardines (Fig- ure 2(b)) contained 0.8 mg/g of guanine and 2.9 mg/g of purine. Cod liver oil (Figure 2(c)) contained 4.1 mg/g of guanine and 1.7 mg/g of purine.
3.1. Linearity and Range
Linearity of the assay was demonstrated by analyzing the peak responses against the analytical concentrations at various concentrations. The method was linear between the concentration ranges of 0.05 µg/mL to 1.00 µg/mL for all 4 purines, with the linear correlation coefficient ≥
(a)
(b)
(c)
Figure 2. (a) HPLC overlay of purine standards and omega- 3 fatty acid fish oil; (b) HPLC chromatogram of fish oil obtained from sardines. Fish oil from sardines contained 0.8 mg/g of guanine and 2.9 mg/g of purine; (c) HPLC chro- matogram of fish oil obtained from cod liver. Fish oil from cod liver contained 4.1 mg/g of guanine and 1.7 mg/g of purine.
0.9999. For all 4 purines, the limit of quantification (LOQ) ranged from 0.02 to 0.04 µg/mL and the limit of detection (LOD) was determined to be 0.01 µg/mL. For quantifying the contents of purines in the fish oil samples, the established sensitivity appeared to be sufficient.
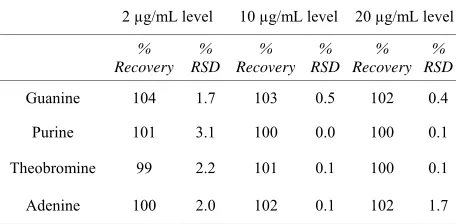
3.2. Accuracy and Precision
[image:3.595.61.285.466.558.2]Table 3. Accuracy and precision of HPLC method.
2 µg/mL level 10 µg/mL level 20 µg/mL level
% Recovery
% RSD
% Recovery
% RSD
% Recovery
% RSD
Guanine 104 1.7 103 0.5 102 0.4
Purine 101 3.1 100 0.0 100 0.1
Theobromine 99 2.2 101 0.1 100 0.1
Adenine 100 2.0 102 0.1 102 1.7
lyzed for the individual preparations against purine stan- dards solutions. The average (mean) percent recovery was between 99% and 104%, indicating excellent accu- racy. The percent standard deviations (% RSD) of three replicate preparations were between 0.1 and 3.1, showing good precision of the method used.
3.3. Robustness
Small and deliberate variations in HPLC parameters were made to verify the robustness of the analytical method. The HPLC parameter variations studied included flow rate (1.0 ± 0.1 mL/min), column temperature (25˚C ± 3˚C), wavelength (270 ± 2 nm), injection volume (10 ± 5 µL), and a different lot of column (Table 2). For all the HPLC variations, the chromatography was comparable to the procedural conditions in terms of peak resolution, peak tailing, and injection precision. The method was, therefore, considered to be robust.
3.4. Specificity
Method specificity was established by demonstrating that there was no interfering peak from the diluent or omega- 3 fatty acid fish oil free of purines. Peak homogeneity of the purine samples were evaluated using a HPLC with a photodiode array detector. No degradation was observed for the purine standards in solution stored at ambient conditions and exposed to light for up to 15 days. Figure 2(a) is a representative chromatogram of the omega-3 fatty acid fish oil sample and the four purine standards.
4. Discussion
Gout management requires a comprehensive strategy that considers the underlying causes of hyperuricemia [4]. Successful uric-acid lowering will prevent frequent goat attacks and disease progression. Uric acid-lowering drugs are usually prescribed concomitant with nonsteroidal anti-inflammatory agents (NSAIDs) to reduce inflamma- tion and pain [4]. For proper gout management, a dietary change involving the reduced intake of purine-rich foods is a prudent approach accompanied by regular monitor- ing of serum uric acid levels. For those with gout, it is
important to follow a strict, low-purine diet. Knowing the amount of purines in different food products may help reduce the risk of gout flare-ups induced by abrupt changes in serum uric acid levels.
This paper describes a simple, efficient, and repro- ducible RP-HPLC method specifically for the analysis of naturally occurring purines in fish oils and other food products. The resulting method has been fully validated as per ICH guidelines [7]. As the new method is a simple and reproducible approach, it can be easily implemented in a quality controlled laboratory. To the best of our knowledge, this is the first fully ICH validated RP-HPLC method that can be used as a single procedure to quantify accurately the amount of guanine, purine, theobromine, and adenine in fish oils in about 20 minutes. Three com- mercially available fish oil products were analyzed: a super concentrated omega-3 fatty acid fish oil sample (Ocean Blue® Professional Omega-3 2100™) and fish oil
from sardines and cod liver oil. While the Ocean Blue®
omega-3 fatty acid fish oil sample was free of purines, the fish oil from sardines and cod liver oil contained sub- stantial amounts of guanine and purine. Notably, this method can also be used to quantify the amount of purines in various other matrices provided that the purine peaks do not interfere with the matrix.
The ability to retain and separate polar and hydrophilic molecules such as purines was very challenging. When using conventional reverse phase liquid chromatography, it is necessary to use ion pair reagents, mobile phase pH modification, and concentrated buffers [8]. Such an ap- proach may have potential detrimental effects on method reproducibility and sample solubility. Using conventional techniques also result in poor retentions and separations. An optimized gradient chromatography system allows the detection of guanine, purine, theobromine, and ade- nine at very low concentrations [9]. As described in this paper, chromatographic peaks were identified via the retention times of known standards, with detection at 270 nm wavelength [10]. The Liquid Chromatography Mass Spectrometry (LC-MS) compatible mobile phase of the new method is useful in the identification of any future potentially unknown and or new chromatographic peaks that may be present in commercially available fish oil samples.
5. Conclusion
6. Acknowledgements
The authors thank our colleagues in the Analytical Re- search and Development Department at Sancilio and Company Inc. for their support during this study.
REFERENCES
[1] Y. Zhu, B. J. Pandya and H. K. Choi, “Prevalence of Gout and Hyperuricemia in the US General Population, the National Health and Nutrition Examination Survey 2007-2008,” Arthritis & Rheumatism, Vol. 63, No. 10, 2011, pp. 3136-3141. http://dx.doi.org/10.1002/art.30520 [2] R. C. Lawrence, D. T. Felson, C. G. Helmick, L. M. Ar-
nold, H. Choi, R. A. Deyo, et al. (For the National Arthri-
tis Data Workgroup), “Estimates of the Prevalence of Ar- thritis and Other Rheumatic Conditions in the United States, Part II,” Arthritis & Rheumatism, Vol. 58, No. 1,
2008, pp. 26-35. http://dx.doi.org/10.1002/art.23176 [3] J. D. Bieber, R. S. Terkeltaub, “Gout: On the Brink of
Novel Therapeutic Options for an Ancient Disease,” Ar- thritis & Rheumatism, Vol. 50, No. 8, 2004, pp. 2400- 2414. http://dx.doi.org/10.1002/art.20438
[4] H. R. Schumacher Jr. and L. X. Chen, “The Practical Management of Gout,” Cleveland Clinic Journal of Medi- cine, Vol. 75, Suppl. 5, 2008, pp. S22-S25.
http://dx.doi.org/10.3949/ccjm.75.Suppl_5.S22
[5] H. K. Choi, K. Atkinson, E. W. Karlson, W. Willett and G. Curhan, “Purine-Rich Foods, Dairy and Protein Intake,
and the Risk of Gout in Men,” New England Journal of Medicine Vol. 350, No. 11, 2004, pp. 1093-1103. http://dx.doi.org/10.1056/NEJMoa035700
[6] A. S. Ryan and F. D. Sancilio, “Prevention of Cardiovas- cular Disease with Omega-3 Polyunsaturated Fatty Ac- ids,” Journal of Clinical Studies,Vol. 4, No. 6, 2012, pp.
30-33.
[7] International Conference on Harmonisation Tripartite Guideline, “Validation of Analytical Procedures: Text and Methodology,” ICH Secretariat, Geneva, 2005. [8] L. A. Rogers, K. E. Crews, S. G. Long, K. M. Patterson
and J. E. McCune, “Evaluation of Chromatographic Me- thods for Drug Products Containing Polar and Non-Polar Molecules Using Reversed Phase, Hydrophilic Interaction, and Ion Exchange Chromatography,” Journal of Liquid Chromatography & Related Technologies, Vol. 32, No.
15,2009, pp. 2246-2264.
http://dx.doi.org/10.1080/10826070903163057
[9] N. Yamaoka, K. Kaneko, Y. Kudo, M. Aoki, M. Yasuda, K. Mawatari, et al., “Analysis of Purine in Purine-Rich Cauliflower,” Nucleosides, Nucleotides and Nucleic Acids,
Vol. 29, No. 4-5,2010, pp. 518-521.
http://dx.doi.org/10.1080/15257771003741372