Munich Personal RePEc Archive
Statistical analysis of accidents at work
in the international context
FRENDA, ANTONIO
Statistical Analysis of Accidents at Work in the International Context1
By Antonio Frenda2
Our research describes safety at work as an issue to be addressed in terms of legislation, with due statistical knowledge of the phenomenon. Through the application of multiple indicators while investigating the rate of homogeneity and non-homogeneity of available data, especially at international level, the concept at study can be analyzed using specific scientific methods.
The Total Frequency Rate of accidents could be influenced by a country’s industrial structure, so as the sectoral growth rate. The standardization of industrial structures into NACE divisions or sub-divisions ( and not only on an aggregate activity level), has proved very useful as an integral part of the statistical infrastructure used within the European statistical system for producing comparable statistics. Moreover, thanks to its relation to the International Standard Industrial Classification of all Economic Activities this framework is also an important tool for comparing statistical data on economic activities at an international level.
Looking at the distribution of the Total Frequency Rates of accidents in different world regions, the picture is quite different, as the phenomenon is by no means evenly spread across the globe. Fatalities are proportionately much higher in some regions than in others. Carrying out a
country-by-
1 The views expressed in this paper are those of the author and do not involve the responsibility of ISTAT or the University of Bergamo.
country analysis would in no doubt reveal greater variations. Occupational accidents and work-related diseases in some European countries are twice as high as in some others, while in the Middle East and Asia, these phenomena are the biggest component as fatality rates rise four times higher than those in the safest industrialized countries.
In Italy, however, thanks to progressive improvements in the last thirty years, injury levels have fallen considerably below the European average. However, the impact of an excessive economy and the influence of organized crime in the South, which could alter the basis for reporting work-related accidents and occupational safety performance indicators, has led to the consideration of the actual rate of accidents in Italy slightly higher than the European average.2
1. Introduction
The phenomenon of Total Frequency Rate of accidents seen among workers is a matter of "variable geometry,” an ethical code practiced by the media where intermittent media attention is high in the presence of one or more tragic events, and low in the prolonged absence of the same;3 a determining factor as to how the information is received.
In this paper, therefore, the phenomenon of work-related accidents and fatalities is approached from another angle, looking at reliable official data provided by the International Labour Organization (ILO) and Eurostat on health, safety and well-being of workers in Europe and the rest of the world.
The ILO provides particular data for the following variables: total employment, accidents in complex, fatalities. These indicators are disaggregated over the following geographic areas and interests: countries with market economies, former socialist countries, China, India, other Asian countries, Sub-Sahara Africa, Latin America, the Caribbean, Middle-east, and the world as a whole.
In Italy, Insurance to cover occupational accident, health and illness is handled through the National Institute of Occupational Insurance (INAIL). This government agency, designed to monitor occupational illness and injury, focusing in particular on emerging multifactor illnesses, provides periodic statistics from reports it receives. This information is grouped into provincial, regional and national levels and includes: insured activities, claims declared, claims compensated and the type of risk. The Institute of
3
Prevention and Safety at Work (ISPESL), on the other hand, through data retrieved from INAIL database, produces an annual historical series on injuries and fatalities.
Regarding the role of Eurostat, it is shown that in 1990 the harmonization project of European statistics was initiated on accidents at work (European Statistics on Accidents at Work - ESAW) to develop methodologies for the collection of comparable and significant data within the European Union. With the 2002-2006 European Strategy for Health and Safety at Work, member countries were invited to promote real well-being at work, in terms of physical, psychological and social well-being.
An ad hoc module, included in the Labour Force survey by EU Member States in the second quarter of 2007, with descriptive purposes, was a useful tool for the evaluation of the Community’s strategy, through the measurement of exposure to risk factors for the health of workers.4
The Italian Caritas, a Pastoral Body created by the Italian Episcopal Conference to promote charity commitment of the Italian ecclesiastical, through the Immigration Statistical Dossier, “Caritas / Migrantes,” outlines the characteristics of immigrant employment each year and processes data on accidents as well: approximately 40% of workplace fatalities concerning foreigners in Italy involves, predominantly, citizens from Morocco, Romania, Albania.
Other than data and analyses provided by the above-mentioned institutions, there is no vast literature on the phenomenon of workplace
4
injuries and fatalities. The subject is often treated within Commentaries to legislation on accidents.5
Safety at work is an issue that should be addressed not only from a legislative point of view, but also from a correct statistical perspective. By applying proper multiple indicators and investigating homogeneity and non-homogeneity levels of available data, especially at an international level, this phenomenon can be analyzed scientifically.
Among the most commonly used indicators for statistical and economic analysis (and which will be explained in the following paragraphs) are:
attendance rates by countries standardized on the basis of the NACE industrial structure
accident rates by region and country
composition of indexes by geographical areas and nationalities relative rates on non-registered workers
relative frequency of injuries based on the number of workers compensated
relationship between compensation and reported accidents fatalities not reported compared to company size
changes in commuting accidents
5
F. Carinci, "Habemus consolidared text for Safety and Health of workers: a legislative decree. April 9, 2008, No 81 ", in:
The new rules for health and safety of workers. Commentary on legislative decree. April 9, 2008, No 81, MILAN, IPSOA, 2008, pp. XXXIII - LIV (LAWS AND LABOUR) M.
Tiraboschi (ed.), "Consolidated text on health and safety in the workplace: commentary on the legislative decree of April 9, 2008," no.81, Milan, 2008, pg. 26, Giuffre Publisher. P. Tullin, "And the Safety falls down," in La Voce.info, March 31, 2009.
Legislation to protect safety and health at work in EU countries is represented mainly by EU directives; the Framework Directive No 391/89, specifically. This accident phenomenon, however, has a high degree of variability within the European Union, which is influenced by different social and legal practices.
Among the objectives of work are:
to briefly picture the phenomenon of safety at work in the world, Europe and among immigrants in Italy (through Eurostat, ILO, INAIL);
to consider the statistical phenomenon of accidents in Italy looking at the total indicators available (rates of irregularities, standardized and non-standardized accident rates, territorial variabilities). Considering them valuable clues for the understanding of the workplace fatality phenomenon is, in its complexity as revealed by INAIL, basically in line with the trend detected within the EU. However, there are some gray areas to be understood in greater detail, areas represented by the underground economy of Southern Italy and the need to make Eurostat indicators more comparable (as required by project ESAW);
2. Accidents at work in the world : ILO estimates and labor costs
According to ILO statistics, about 6,000 workers in the world die daily in workplace accidents and occupational diseases, and the figure is growing. The cost of accidents to society is approximately 4 percent of global GDP and is absorbed by direct and indirect costs.
Table 1 - Accidents at work in the world – 2006
COUNTRIES
Total
Occupation
A
Total
Accidents
B
Fatal
Accidents
Accident
Composition
% Index
B/A
Incidence
% Index
Countries with
market economy 380.833.643 12.340.216 16.170 4,68 3,24
Ex-Socialist
Countries 162.120.341 16.350.868 21.425 6,20 10,09
China 699.771.000 56.179.742 73.615 21,29 8,03
India 419.560.000 36.765.877 48.176 13,94 8,76
Other Asian
Countries &
islands
328.673.800 63.378.830 83.048 24,02 19,28
Sub-sahara Africa 10.540.604 41.748.723 54.705 15,82 396,08
Latin America
and the
Caribbeans
114.604.962 22.584.726 29.594 8,56 19,71
Middle-East
48.635.240 14.489.130 18.986 5,49 29,79
World total 2.164.739.590 263.838.111 345.719 100,00 12,19
Source: ILO data elaboration
about 60% of accidents at work occur in Asia
considering the number of employees, Africa has the most dramatic relative frequency of accidents: the rate of occurance of injuries in this continent is equal to 33 times6 the global market.
Data shown by INAIL7 in May 2008 indicate that the social cost of accidents at work in Italy is around forty-five billion and a half euros, 3.2% of Gross Domestic Product (GDP), and it is made up of expenditure for insurance (for 26%), cost of prevention (32%), indirect costs 8(42%), as shown in Table 2 below.
Table 2 - Social Cost of Accidents at work
Type of Cost Level (billions of euros) Composition % Index GDP %
Insurance 11760,19 26 0,83
Prevention 14377,50 32 1,01
In direct cost 19307,67 42 1,36
TOTAL 45445,36 100 3,20
Source: INAIL, May 2008
6
This value is calculated by dividing the incidence rate in Africa (396.08%) to global (12.19%). 7
Source: "Statistical Monitoring Accidents", INAIL, 1/5/2008. 8
3. Calculation methodologies of Eurostat data
Data cited in Table 3 below, based on occurance rate of injuries per 100,000 employees, are "standardized" by Eurostat for various economies in order to integrate technical data submitted by member countries absolute9. Some member States, in fact, do not have a specific insurance system and, according to Eurostat, only a part of workplace accidents is actually declared. Even in cases where statistics do exist, they may be compiled in a different way. Thus, such a system merely the registration of an average level of declaration of only 30% -50% per the total number of sectors of economic activities10.
Table 3 - Frequency rates standardized per every 100,000 employees in 2006
SECTORS UE at 15 Euro Zone at 12 Italy
9 sectors common to NACE 3.013 3.469 2.812
Agriculture 3.879 4.145 6.013
Manufacturing Activities 3.463 3.890 3.488
Electricity, Gas, Water 1.577 1.763 2.288
Construction 5.974 7.049 4.539
Trade and Commerce 2.096 2.386 1.551
Hotels and Restaurants 2.909 3.294 2.133
Transport and Communication 3.674 4.447 4.562
Financial Intermediation and
Real Estate Activities 1.464 1.760 1.184
9The EU countries provide their data not in the presence of a directive but a simple "gentlemen's agreement", ie an informal agreement. It may be useful to recall at this event that the application of the Treaty can usually take three directions: directly applicable legislation in all countries; directives that are translated into national laws, allowing individual states some discretion in the methods of application and decisions that apply to all countries for which they are issued. Other agreements or arrangements, such as recommendations, opinions, or gentleman agreements are not binding. 10
The ESAW methodology considers, essentially, two types of statistical indicators for the analysis of accidents at work: the number of accidents and their frequency (shown in Table 3). To define the frequency of accidents, it is necessary to define the relationship between the number of accidents and the population of employees referred to, calculated using the sample survey run by ISTAT Labour Force Survey in Italy.
It is important to note that this is a useful report that shows numerator data from administrative sources and denominator data from statistical source (the LFS). Therefore during their interpretation, the following should be considered:
the non-homogeneity of the sources of provenance the ability to have data underestimated.
In fact, while data on employment (the denominator) includes most of the non-regular workers, the accident (the numerator) should include injuries of legal workers and partly, "serious injuries" of non-registered workers11.
Eurostat statistics are compiled on the basis of reported injuries compensated by insurance benefit, and therefore require sufficient time for definition. Total Frequency Rate (TFR) is defined as the number of accidents per 100,000 employees, and it is given by the formula.
Frequency Rate =
esaminata e popolazion nella occupati di Numero mortali) non o (mortali infortuni di Numero
X 100.000 (3.1)
11
Based on one or more of the variables that classify the victims of the accidents (e.g. economic activities, age, etc.), it could be calculated for Europe, for a Member State or any other subdivision of the population, and the type of injury ( injured body part, etc.). For an over-three-day injury which results in the injured person being away from work or unable to do their normal work for more than three days, Total Frequency Rates (TFR) are calculated separately.
Deaths caused by road accidents are a significant percentage of the total number of fatalities, but are not included when calculating the frequencies, because they are not recorded as workplace accidents. And, in the absence of proper correction, the comparison between incidence rates of deaths would introduce a significantly distorted national data. For each Member State, in fact, an adjusted frequency of fatal accidents is used.
In some States, accidents at work leading to absence from work for more than three days are declared only partially. Based on these declaration levels, Eurostat could rectify data on accidents and carry out their evaluation based on deduction.
It is known that the frequency of accidents is much higher in some areas than others. The industrial structure of a country influences the total incidence rate of accidents based on the percentage of sectors with higher risks (eg agriculture, construction , transport).
standardized data of workplace accidents are shown in ESAW publications, attributing to every sector at the national level, the same relative total weighting as that of the European Union (Standardized Frequency Rate).
The following elements that could improve a comparison of European statistics could be delineated :
standardization of the industrial structure by sector (NACE subsection or division) and not only on aggregate activities level; standardization based on work : part-time work, contracts, legal working time, flexibility of employment;
standardization for age and sex;
more complete data from member countries on occupational diseases.
4. Injuries in the European Union
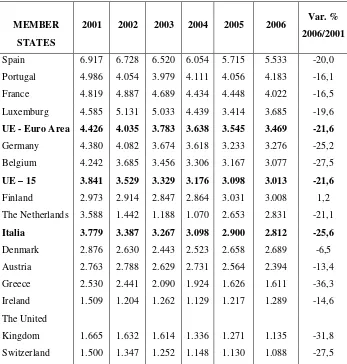
Tables 4 and 5 below, reproduced with data for year 2006 ( the latest made available by Eurostat) shows that Italy has, as per accidents at work, a "rate effect" of up to 2,812 accidents per 100,000 employee for the entire economy. Therefore, one injury every thirty-six employee. Below the average value calculated for the fifteen EU countries: (3013), and for the 12 Euro zone countries: (3469)12.
Based on data collected for year 2006, the rate of accidents at work Italy is in line with the European average, and rises slightly higher in the
12
case of deaths. It is seen, however, that within the agricultural sector, the overall rate of accidents is well above European average.
Table 4 - standardized accident rate per 100,000 employed
MEMBER
STATES
2001 2002 2003 2004 2005 2006 Var. % 2006/2001
Spain 6.917 6.728 6.520 6.054 5.715 5.533 -20,0
Portugal 4.986 4.054 3.979 4.111 4.056 4.183 -16,1
France 4.819 4.887 4.689 4.434 4.448 4.022 -16,5
Luxemburg 4.585 5.131 5.033 4.439 3.414 3.685 -19,6
UE - Euro Area 4.426 4.035 3.783 3.638 3.545 3.469 -21,6
Germany 4.380 4.082 3.674 3.618 3.233 3.276 -25,2
Belgium 4.242 3.685 3.456 3.306 3.167 3.077 -27,5
UE – 15 3.841 3.529 3.329 3.176 3.098 3.013 -21,6
Finland 2.973 2.914 2.847 2.864 3.031 3.008 1,2
The Netherlands 3.588 1.442 1.188 1.070 2.653 2.831 -21,1
Italia 3.779 3.387 3.267 3.098 2.900 2.812 -25,6
Denmark 2.876 2.630 2.443 2.523 2.658 2.689 -6,5
Austria 2.763 2.788 2.629 2.731 2.564 2.394 -13,4
Greece 2.530 2.441 2.090 1.924 1.626 1.611 -36,3
Ireland 1.509 1.204 1.262 1.129 1.217 1.289 -14,6
The United
Kingdom 1.665 1.632 1.614 1.336 1.271 1.135 -31,8
Switzerland 1.500 1.347 1.252 1.148 1.130 1.088 -27,5
Source: EUROSTAT - Excludes injuries leading to absence from work for less than 4 days and
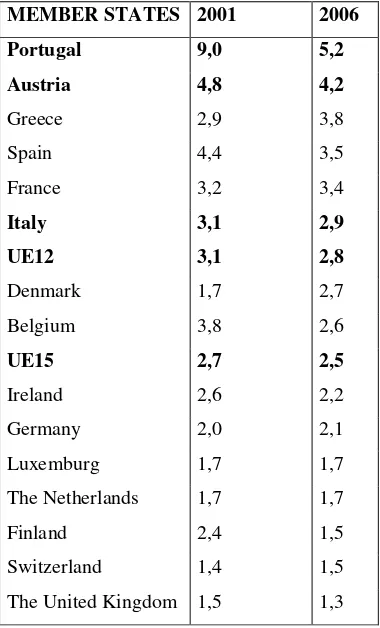
INAIL data indicate that in 2008, there was about 1120 fatalities, i.e. 130 less than the 1,250 of 2007, showing, therefore, a decline rate close to 10%. In fact, since 1966, there has been slow and continuous decrease of white deaths in Italy. In that year, there were 3,744, while 1,120 cases were detected in 2008; a decrease in 32 years by 70%
Table 5 - Deaths: rates standardized incidence per every 100,000 employee in EU
countries.
MEMBER STATES 2001 2006
Portugal 9,0 5,2
Austria 4,8 4,2
Greece 2,9 3,8
Spain 4,4 3,5
France 3,2 3,4
Italy 3,1 2,9
UE12 3,1 2,8
Denmark 1,7 2,7
Belgium 3,8 2,6
UE15 2,7 2,5
Ireland 2,6 2,2
Germany 2,0 2,1
Luxemburg 1,7 1,7
The Netherlands 1,7 1,7
Finland 2,4 1,5
Switzerland 1,4 1,5
5. Risk of accidents and the underground economy
The March 2004 Censis report titled: "The Value of Safety in Italy", stated that safety in Italy was not a social value yet. Indeed, Italian national data on injuries shows a certain variability at the regional level, explained through the following factors:
different sectoral specialization (calculation problems outlined in the previous paragraphs can be extended to EU countries at national levels, as well as regional levels);
the importance of underground economy and the presence of illegal migrant workers.
Regarding the latter, it is shown that available statistical data on accidents are influenced by the existence of an economy not directly observed13. It stems from an underground economy, illegal activities, informal activities and underground statistics.
Underground economy derives from the production of economic goods and services which, though legal, are not directly observable due to tax evasion phenomenon and lack of social security contributions. Informal economy is represented by the activities based on personal or family working relationships; casual jobs with no formal employment contract. While underground statistics relates activities not registered due to a lacking in the system of statistical data collection.
Thus, the concepts of legal and illegal employment are not necessarily related to those of registered and non-registered14 productive activities. A statistical analysis of accidents caused by illegal employment concerns :
the continuation of operations carried out not according to current legislation;
occasional work performed by students, retirees, housewives: a unit that is declared inactive
non-resident and illegal aliens
multiple activities not declared to Tax Office and more respect to the main.
The rate of irregularity, calculated as percentage ratio between units of illegal labour of a territorial area and the total units of work employed in it, in Italy in 2009 was equal to 12.2% for the entire economy ( the highest level since 2003). Thus, the following breakdown by macro areas could be considered:
24.5% in agriculture (compared to 18.3% in 2003) 6.2% in industry (5.7% in 2003)
13.7% in the services sector (13.5% in 2003).
The South has rates well above the national average and other geographical areas, close to 18% of the total economy15. The presence of
14
The Italian NC, at present, as well as other European countries, does not consider the illegal economy and therefore estimated the non-registered workers do not related to illegal activities.
15
economic phenomena developed, more or less, such as underground economies surely alter the analysis of data taken from the archives of an administrative nature (see archives INAIL, INPS)16.
Figures relating to accidents in the informal economy, as long as it has to do with an economy not directly observable, escapes the statistics of administrative bodies, (INPS, INAIL) and ad hoc surveys.
However, an attempt could be made for 2009 to give an assessment17 since ISTAT’s estimates for the said year sums up to 2,965,600 units of illegal work, approximately broken down to 2,653,800 in the industrial sector and 311,800 in the agricultural sector (on the basis of historical data available). Applying these Eurostat standardized frequency rates of accidents provided by INAIL (equivalent in 2006 to about 28 per every 1000 for the total economy, and 60 per every 1000 in agriculture) to the estimates, the accident that occurred in 2009 at irregular units should be approximately 74 million in the industrial and services sector, and 19 000 in the agricultural sector.
"The extent of the underground economy according to official statistics", Statistics in Focus, ISTAT, issued June 18, 2008.
"The measure of employment not covered by the national accounts estimates Reference period: Years 1980-2009 - Tables of data disseminated on: April 14, 2010.
16
One of the earliest works of ISTAT for the analysis of underground economy by integrating statistical and administrative sources is that related to the MURST project 'Employment and Unemployment: issues regarding measures and analysis', presented in Bressanone, 10-12 February 2000):
"The integration of information from the ISTAT Labour Force survey with information from the INPS Observatory: potentials for analysis and operational problems "by Raffaella Cascioli, Antonio Frenda, Pietro Gennari (Istat) Enrico Rettore (University of Padova);
17
Complessively, in 2009, the last year with irregularities made available by ISTAT, about 93 000 accidents could be estimated with results of more than three days.
Eurostat statistics are compiled on the basis of reported injuries compensated by insurance benefits. Therefore, considering the relationship between reported and compensated cases (thus including those with absence from work for three days or more), and including commuting accidents (Table 6) that in 2007 amounted to 97,278 (and considering an autoregressive logic equal to more than 100,000 in 2009), that occurred from home to work and vice versa, a hypothetical rough estimate could be made of 135,000 for default accidents occuring among illegal workers in 2009 (without considering the values of the illegal economy).
Table 6 - Types of accidents at work in Italy Type of Occurances Year 2001 Year 2002 Year 2003 Year 2004 Year 2005 Year 2006 Year 2007 Var % 2001- 2007
Workplace 965.093 920.299 898.121 881.849 850.589 835.661 815.132 -15,5
Commuting 58.286 72.356 79.073 84.880 89.432 92.497 97.278 66,9
Total 1.023.379 992.665 977.184 966.729 940.021 928.158 912.410 -10,8
It is important to note that accidents involving illegal workers often go unreported, especially when they relate to minor events. Placed under the so-called principle of automatic compulsory social security benefits (Article 2116 Civil Code), even workers for whom the employer does not comply with insurance obligations have rights to the provision of the law. It is conceivable that accidents giving rise to the most serious and permanent disabilities are reported by the workers themselves or by the judicial police. It is therefore possible to synthesize a formula for calculating injuries of non-registered workers as follows:
(5.1)
Infirr = ULAirreg*α + commuting * β + den den ind Inf Inf Inf ∗ −
1 = 93.000 +
97.000 *0,12 + 0,32*93.000 ≈ 135.000
Where ULAirreg is the unit of illegal work, α reppresents
standardized frequency rates of accidents, commuting indicates accidents while traveling for work, β is the rate of national irregularities, and (Infind/Infden) shows relationship between compensation and reported
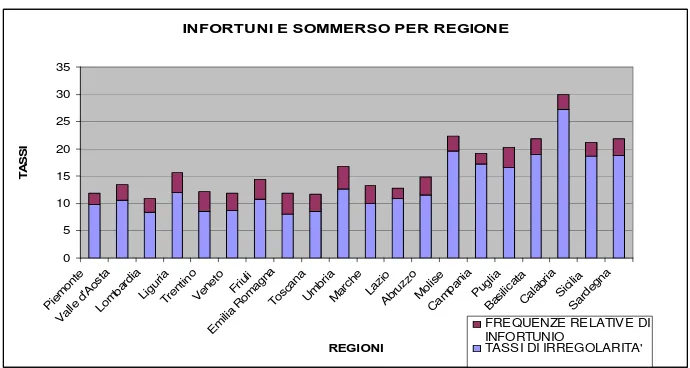
The Italian underground economy issue is very interesting. In fact, it shows (Figure 1) a slightly negative correlation between the level of irregularities (Source: ISTAT) and the relative frequency of injuries18 (Source: INAIL, calculated on the basis of accidents and workers compensation INAIL) . Regions where underground economy is most prevalent tend to have a slightly lower percentage of workplace accidents and injuries than the total national index.
And since it is conceivable that resorting to illegality has beneficial effects on quality of work, thus reducing the number of accidents, it is entirely legitimate to say that, although higher, accident rates in these areas of the country is lower due to failure to report the event to social security institutions and sometimes due to the influence of organized crime, particularly within the southern regions where there are large economic interests in underground economy. Figure 1 reproduced below makes it easier to understand this assumption.
18
Figure 1: Unobserved Economy and Risks of Workplace Accidents in Italy
INFORTUNI E SOMMERSO PER REGIONE
0 5 10 15 20 25 30 35 Pie mon te Val le d
'Aos ta Lom bar dia Ligu ria Tren tino Ven eto Friu li Em ilia R
om agna Tosc ana Um bria Mar che Lazi o Abr uzz o Mol ise Cam pani a Pug lia Bas ilica ta Cal abria Sic ilia Sar deg na REGIONI T A S S I
FREQUENZE RELATIVE DI INFORTUNIO
TASSI DI IRREGOLARITA'
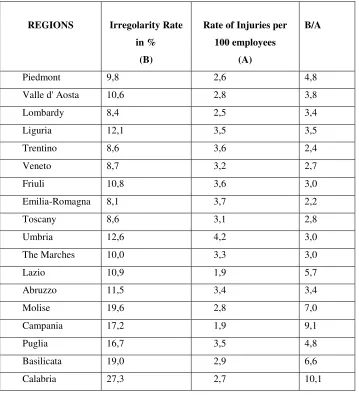
In Table 7 below, it is relevant to analyze the relationship between the rate of black labour and the rate of injuries (B / A):
It is well above the national average (4.2) for all regions of the South (with a maximum of 10.1 in Calabria). Within the entire Central and Northern regions (with the exception of Lazio and Piedmont), it is below national average. Southern regions having a higher level of irregularity based on estimates by ISTAT, should, logically, have higher accident rates, or at least equal to that of the northern regions, which have with lower prevalence of underground economy.
compensation not reported19 could be estimated, most of which happened to illegal workers, alongside with accidents reported and compensated.
Table 7 – Relationship between rate of black labour and injuries
REGIONS Irregolarity Rate
in %
(B)
Rate of Injuries per
100 employees
(A)
B/A
Piedmont 9,8 2,6 4,8
Valle d' Aosta 10,6 2,8 3,8
Lombardy 8,4 2,5 3,4
Liguria 12,1 3,5 3,5
Trentino 8,6 3,6 2,4
Veneto 8,7 3,2 2,7
Friuli 10,8 3,6 3,0
Emilia-Romagna 8,1 3,7 2,2
Toscany 8,6 3,1 2,8
Umbria 12,6 4,2 3,0
The Marches 10,0 3,3 3,0
Lazio 10,9 1,9 5,7
Abruzzo 11,5 3,4 3,4
Molise 19,6 2,8 7,0
Campania 17,2 1,9 9,1
Puglia 16,7 3,5 4,8
Basilicata 19,0 2,9 6,6
Calabria 27,3 2,7 10,1
19
Sicily 18,7 2,6 7,2
Sardinia 18,9 2,9 6,5
Italy 11,7 2,8 4,2
Elaboration on INAIL and ISTAT data
It is therefore possible to use a final formula, which also takes into account unreported accidents, to synthetize the calculation of accidents per illegal workers:
(5.2)
Infirr = ULAirreg*α + β * Itinere + den den
ind
Inf Inf
Inf
∗
−
1 + Infnonden= 93.000
+ 11.640 + 0,32*93.000 + 78.000≈ 210.000
These are estimates based on assumptions, that use variables sometimes measured through different methods or relative to periods (but close). Therefore, these figures should only be seen as approximate an measurement of the phenomenon. It is true, however, that more than 200,000 injuries, mostly involving illegal workers, represent almost 25% of the total injuries reported in 2008 by INAIL.
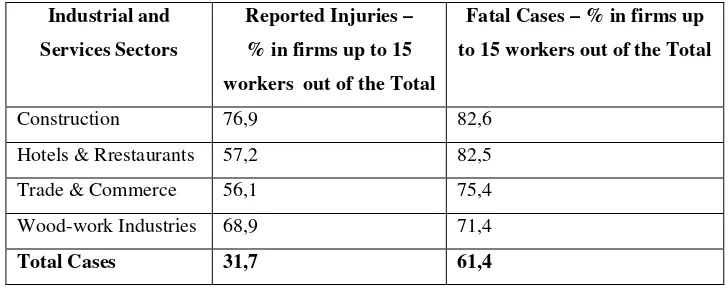
As per relationship between injuries and size of the company, it should be noted that in 2006, 31.7%20 of accidents within the industrial and services sectors reported to INAIL appeared to have occurred in companies with up to 15 employees (compared to the number of employees in small businesses. A sum of 15 employees, recorded by INAIL equals to 45% of the total number21). This percentage almost doubles (61.4%) for fatal
20
Source: INAIL Injury Statistical Centre, May 2008. 21
accidents. It can thus be argued that while small firms are more likely to report fatal accidents, it doesn’t occur at the same rate when it comes to minor injuries.
[image:25.595.115.479.253.398.2]Consequently, in Table 4 below, some economic sectors are identified with high percentage of reported workplace accidents and injuries that occurred in small business (e.g. in the costruction sector 76,9% of injuries and 82,6% of fatal injuries concern companies up to 15 workers).
Table 8 – Accidents in Small Business – Year 2006
Industrial and
Services Sectors
Reported Injuries –
% in firms up to 15
workers out of the Total
Fatal Cases – % in firms up
to 15 workers out of the Total
Construction 76,9 82,6
Hotels & Rrestaurants 57,2 82,5
Trade & Commerce 56,1 75,4
Wood-work Industries 68,9 71,4
Total Cases 31,7 61,4
6. Some Conclusions
An international comparison of data shows Africa as the continent where there is more to be done to create environment for decent work. Asia increasingly shows a percentage of workplace accidents similar to those of the Western world, including progress within the world of work that is taking place in India and China. Asia remains the continent where most accidents happen because of its high rate of employment.
Italy, on the other hand, having shown constant improvement in the last years, accident levels have apparently fallen below the European average. However, this excessive underground economy issue and organized crime in the South (particularly in Calabria, Sicily and Campania), lead to failure to notify the enforcing authorities of accidents, or perhaps the altering of details of notification. As a consequence, the Italian actual rate of accidents could be considered slightly higher than the European average.It is also seen that in the agricultural sector, the overall frequency rate of accidents is well above the European average.
The presence of an economic phenomena like the underground economy, where massive, certainly affects the analysis of events taken from the archives of an administrative nature: a comparison between socio-economic surveys, and such files could provide a measurement of events not declared correctly.
A balanced statistical-economic analysis on the trend of the injuries cannot depend on the following considerations:
the need for consistent temporary comparisons to analyze the evolution of the phenomenon in every territory in question;
computable statistical and economic indexes are clues and so should be considered together with appropriate qualitative and quantitative evaluations for the understanding of socio-economic phenomena. The following elements could improve comparison of European statistics:
higher completeness of data from member countries for occupational diseases;
standardization of the industrial structures in NACE subsection or division (not solely on the level of NACE aggregate activities); standardization by sex and age and by working hours: part-time work, short-term contracts, hours of legal work, flexibility in work relationship.
Bibliographic References
Bacchini F. (2009): "Risk and Culture of Prevention, Care, Security" ISL No 6, 2009, Publisher Ipsoa;
Cascioli, R., Frenda, A., Gennari, P., Rector, E. (2000) "The Integration of Information by the ISTAT Labour Force Survey with information from the INPS Observatory: Potential for Analysis and Operational Problems", submitted to the Days of Study on the MURST Labor project and Unemployment. Issues of measurement and analysis, held in Bressanone, 10-12 February 2000;
Carinci F. (2008), "Habemus text only for the Safety and Health of workers, Legislative Decree, April 9, 2008, No 81 ", in “The New Rules for Health and Safety of Workers;”
Commentary Leg. April 9, 2008, No 81, MILAN, IPSOA Ichino P., review (2008): "Commentary on job security, edited by F. Bacchini, with Introduction by F. Carinci, Milan, 2008, in RIDL No 3, p. 126;
Tiraboschi M. (Ed.) (2008), “text only” on Health and Safety in the Workplace. Commentary on the Legislative Decree 9 April 2008, n.81", Giuffrè Editore;
Tullin P. (2009), "And Safety Falls," in The Voce.info.
Eurostat (2001), the European Statistics on Accidents at Work (ESAW) –
Methodology INAIL Annual Report 2009 (December 2006)
Trends in Workplace Accidents; No. 12 ISTAT, "Measuring Illegal Employment in the Estimates of National Accounts," Statistics in Brief, released February 6, 2008. ISTAT. "The Extent of the Underground Economy According to Official Statistics", Statistics in Brief, released June 18, 2008.