Munich Personal RePEc Archive
Costs and benefits of trade liberalization
Hasan, Arsalan
Department of Economics University of Karachi
27 September 2010
Online at
https://mpra.ub.uni-muenchen.de/25657/
Term Paper for International Economics (612)
COSTS AND BENEFITS
OF
TRADE LIBERALIZATION
Submitted to Dr. Abdul Waheed Department of Economics
University of Karachi
Introduction
Before Adam Smith’s Wealth of Nations was published, Mercantilist
literature was available as a study into subjects like commerce and trade. The Mercantilists were the theoreticians of primitive economics. They advocated restrictions on imports and support to the exports by the government. The reason that they provided for their argument was that to increase the wealth of a nation the inflow of bullion was necessary. They argued that when exports are supported and imports are restricted, the exports will be greater than imports and hence the inflow of bullion. But after the advent of the theory of economics (now known as the Classical school) there was a paradigm shift in the study of international trade. The definition of wealth was changed and wealth was now regarded as the extent of availability of factors of production. Adam Smith, providing the first account of today’s theory of international economics, praised free trade as being better than restricted trade. International trade is said to be a positive sum game, because both sides of the transaction benefit and can achieve gains from trade. David Ricardo improved Smith’s theory by defining the concept of comparative advantage, further strengthening the belief in freer and unhindered trade. But this has been opposed by the NeoMercantilists and the Protectionists who are more inwardlooking. This means that they advocate opposition to free trade by focusing on the benefits and costs of trade on one side of foreign trade. But the grip of protectionist theories on the policymakers has been continuously loosening since World War II. The establishment of General Agreement on Tariffs and Trade (GATT) in 1947 to promote freer trade through multilateral trade organizations, and the resulting formation of World Trade Organization (WTO), have pushed the world into an increasingly liberalized pattern of trade. The developing countries are also told to liberalize trade so that reallocation of resources and specialization in commodities or sectors of comparative advantage can have their positive impact on the welfare of the nation and the world as a whole. The developing nations, led by countries like Mexico, have started to liberalize their trade with the world with rapid pace. But the question is that, are the benefits of trade liberalization worth its costs? In the following sections we will list the benefits of trade liberalization as put forward by the conventional theory and then we will see the costs. The final part of the
analysis is an empirical view over trade liberalization with the case of Pakistan.
Benefits of trade liberalization
total output will be produced by the agricultural sector and simple forms of services. The country’s agricultural sector will be using traditional methods and the income of the farmers will be very close to subsistence wage rate. Now, either acting on advice from developed countries and world organizations or due to excess domestic demand, the country will start opening its borders to foreign countries for trade. It will start lowering its tariffs and will try to remove any other trade barriers. Exports and imports will start rising. The country will start exploiting its untapped potential by allowing foreign firms to operate inside its borders. The foreigners will bring with themselves the technology and skills to produce a host of products that could not be produced by the country itself due to lack of these skills. The foreign firms will benefit from the cheap labor and the host country will benefit from increased production and employment. Gradually the country will experience sectoral transformation in favor of its sector of comparative advantage. The country will specialize in this sector, allowing it to expand and start exporting its produce. It will also be able to improve itself by using its high income on research and development. During this process of trade liberalization Foreign Direct Investment (FDI) will be attracted by the country’s sector of comparative advantage. This will cause physical capital formation in the country and will enable more expenditure on research and development. In other words, trade liberalization will accelerate the pace of industrialization in the country. This will cause new jobs to be created and employment to rise. The per capita income and consumption will rise, indicating the positive effects on the consumers. So we can list the following benefits from trade liberalization.
· Static gains from trade in the form of increased output, employment,
consumption and hence, increased output per worker;
· Dynamic gains from trade in terms of increased foreign investment,
increased expenditure on research and development, increased pace of
industrialization and hence, development.
Costs of trade liberalization
difficult to identify which industry will be able to provide external economies large enough to cover the costs of protection. Thirdly, once protection is given to domestic industry, it will be difficult to remove because local industries are likely to use extensive lobbying activities with the government so that protection remains. And finally, subsidy can be used instead of tariff more effectively. The last one is more important, given the fact that subsidies are easy to remove.
Other costs and reasons to oppose the liberalization of trade include some arguments that are questionable and are rejected as being ‘beggarthyneighbor’
arguments 1 . Two such arguments are that protection is needed (1) to reduce
domestic unemployment and (2) to cure a deficit in the nation’s balance of payments. But supporters of trade liberalization say that by protecting the industry (and labor force) from foreign competition, the labor force will be denied the opportunity to be employed in more efficient sectors and will cause them to remain employed in the inefficient sectors where the country does not have a comparative advantage. As for the second argument, if imports are restricted by the country, then it is possible that other countries might retaliate by restricting the country’s exports, so that the possible gains from trade will be forgone by the country itself as well as its competitors and the world as a whole, making everyone worseoff.
A more valid criticism on the theory supporting trade liberalization is targeted at the nature of analysis of the gains from trade. Here it is said that the idea of gains from trade is based on comparative static analysis and hence, any gains from trade will be fully utilized in one time. In other words, since a static free trade condition is compared with a static autarky condition, the gains from trade hence measured are also static. Thus the movement from autarky to free
trade is a onetime improvement 2 . But it should be kept in mind that there are not
only static gains from trade but also dynamic gains in the form of structural change and industrialization.
Empirical view of the case for trade liberalization
After we have looked at the benefits and costs from a theoretical standpoint it is necessary to observe the effects of trade liberalization in the real world. At first sight, there has been a mixed result. With some countries showing excellent performance as they further liberalize their trade and some countries not being able to achieve the perceived benefits completely. The case of China is one of the best possible, whereas countries like Pakistan are still not able to register any significant gains. In this section we will study the case of Pakistan.
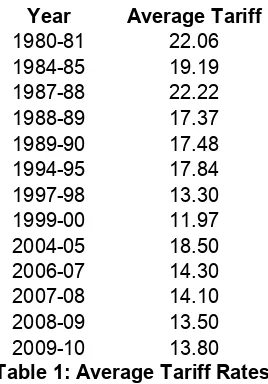
Pakistan has gradually been liberalizing its trade with the world over the previous years. The average rate of tariff during the year 198081 was 22.06 percent and reached 13.8 percent in 200910. Table 1 shows the average tariff rates for selected years. This reduction in the tariff rates has been in accordance with the agreements with the WTO which require gradual reduction in tariffs and
other barriers to trade by all the member countries.
[image:6.612.237.371.291.483.2]Year Average Tariff 198081 22.06 198485 19.19 198788 22.22 198889 17.37 198990 17.48 199495 17.84 199798 13.30 199900 11.97 200405 18.50 200607 14.30 200708 14.10 200809 13.50 200910 13.80 Table 1: Average Tariff Rates
Source: FBR; WTO World Tariff Profiles. 3
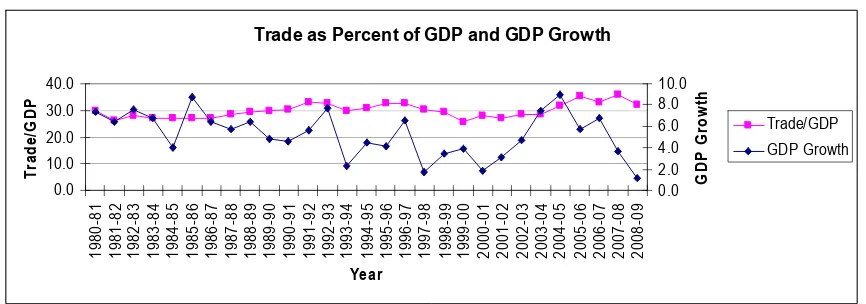
Trade as Percent of GDP and GDP Growth 0.0 10.0 20.0 30.0 40.0 19 80 8 1 19 81 8 2 19 82 8 3 19 83 8 4 19 84 8 5 19 85 8 6 19 86 8 7 19 87 8 8 19 88 8 9 19 89 9 0 19 90 9 1 19 91 9 2 19 92 9 3 19 93 9 4 19 94 9 5 19 95 9 6 19 96 9 7 19 97 9 8 19 98 9 9 19 99 0 0 20 00 0 1 20 01 0 2 20 02 0 3 20 03 0 4 20 04 0 5 20 05 0 6 20 06 0 7 20 07 0 8 20 08 0 9 Year Tr ad e/ G D P 0.0 2.0 4.0 6.0 8.0 10.0 G D P G ro w th Trade/GDP GDP Growth Figure 1: Trade as Percent of GDP and GDP Growth
Source: SBP, Statistical Handbook of Pakistan, 2005; Economic Survey of Pakistan, 200910.
[image:7.612.94.519.429.599.2]Increasing volume of trade is a positive effect of trade liberalization. It shows that as trade is opened further, more goods and services are exchanged with the world, hence more output is produced and more employment is created. This is as predicted by the theory that by liberalization of trade the volume of trade will increase, enhancing the growth in the GDP. But the other aspect of the matter is the terms of trade. The terms of trade for the same period are shown in figure 2. As observed at first sight, the terms of trade show a falling trend for the given period. This is the evidence of decreasing competitiveness of Pakistan’s exports in the world markets. Besides, it may also be because of the absence of any significant form of upward adjustment in terms of technology and it might be due to lack of expenditure on research and development. Terms of Trade 0.00 20.00 40.00 60.00 80.00 100.00 120.00 198 0 81 198 1 82 198 2 83 198 3 84 198 4 85 198 5 86 198 6 87 198 7 88 198 8 89 198 9 90 199 0 91 199 1 92 199 2 93 199 3 94 199 4 95 199 5 96 199 6 97 199 7 98 199 8 99 199 9 00 200 0 01 200 1 02 200 2 03 200 3 04 200 4 05 200 5 06 200 6 07 200 7 08 200 8 09 Year TOT
Figure 2 Source: SBP, Statistical Handbook of Pakistan, 2005; Economic Survey of Pakistan, 200910.
On the other hand the trend of decreasing terms of trade seems to support the protectionist argument that, in a situation of more liberalized trade, a developing country is doomed to export low value added or primary sector goods. In the year 200809 around 53 percent and 17 percent of total exports comprised of textile manufactures and food group respectively, both of which are
only 788 patent applications by Pakistani residents during the years from 1990 to
2006. 5 So, in this respect, trade liberalization is not having a positive impact on
Pakistani economy. But it remains to be judged whether same is the case as a whole or not.
The overall impact is ambiguous because the trade effect and the price effect are in the opposite directions. So it is necessary that we look at one or two more indicators of the impact of freer trade on Pakistani economy. The first that we choose is the current account balance. The current account balance is graphed in figure 3 for the same range of years. The current account has been in deficit for almost whole of the chosen period, with the exception of only three years, namely 2001, 2002, and 2003. These were the years when, after the events of September 11, the government of Pakistan received large amounts in foreign aid for help in the “war on terror”. In the remainder of years there has been a perpetual deficit which has deepened in recent years starting from 2004. The deepening of the current account deficit in recent years shows that the
impact of increase in the volume of trade is outweighed by falling terms of trade. Current Account Balance 19 80 8 1 19 81 8 2 19 82 8 3 19 83 8 4 19 84 8 5 19 85 8 6 19 86 8 7 19 87 8 8 19 88 8 9 19 89 9 0 19 90 9 1 19 91 9 2 19 92 9 3 19 93 9 4 19 94 9 5 19 95 9 6 19 96 9 7 19 97 9 8 19 98 9 9 19 99 0 0 20 00 0 1 20 01 0 2 20 02 0 3 20 03 0 4 20 04 0 5 20 05 0 6 20 06 0 7 20 07 0
8 2008
[image:8.612.95.519.310.511.2]0 9 16000 14000 12000 10000 8000 6000 4000 2000 0 2000 4000 6000 Year C ur re nt A cc ou nt B ala nc e
Figure 3 Source: SBP, Statistical Handbook of Pakistan, 2005; Economic Survey of Pakistan, 200910.
But it is important to observe a second indicator in order to view the whole picture. This indicator is the GDP per capita. GDP per capita can be used as a proxy variable for output per worker. For the 29 year period from 1980 to 2008,
there has been an average annual growth of 2.6 percent in GDP per capita 6 . This
GDP per capita (constant 2005 PPP $) 0 500 1,000 1,500 2,000 2,500 19 80 19 81 19 82 19 83 19 84 19 85 19 86 19 87 19 88 19 89 19 90 19 91 19 92 19 93 19 94 19 95 19 96 19 97 19 98 19 99 20 00 20 01 20 02 20 03 20 04 20 05 20 06 20 07 20 08 Year G DP pe r ca pi ta
Figure 4 Source: World Bank, Databank (online).
Even if we take GDP per person employed, we see the same positive trend in its growth as trade liberalization proceeds over the years. The next figure shows the GDP per person employed for the years 1980 to 2008. The terms of trade effect is negative but the wealth effect is positive. GDP Per Person Employed (constant 1990 PPP $) 0 2,000 4,000 6,000 8,000 10,000 19 80 19 81 19 82 19 83 19 84 19 85 19 86 19 87 19 88 19 89 19 90 19 91 19 92 19 93 19 94 19 95 19 96 19 97 19 98 19 99 20 00 20 01 20 02 20 03 20 04 20 05 20 06 20 07 20 08 Year G D P P er P erso n E m pl oy ed
Figure 5 Source: World Bank, Databank (online).
Conclusion
[image:9.612.92.521.356.532.2]industrialization and hence, development. The result is an increase in the welfare of the nation to an extent that is not possible without the liberalization of trade.
Although this chain of reasoning is supported by world agencies like the WTO, IMF and the World Bank, there has been strong opposition to it by the general public and protectionist thinkers. The most powerful argument that is put forward against trade liberalization is the InfantIndustry argument. This argument is valid for developing countries that do not have welldeveloped industrial base. Such countries, it is argued, cannot compete with highly developed industries of the advanced countries. Therefore their infant industries need protection from foreign competitors so that they get developed and become more efficient over time.
In the process of this discussion, we have seen that neither the theoretical analysis nor the empirical evidence from Pakistan’s economy provide enough reason that trade liberalization can be rejected categorically. And neither can it be accepted out rightly as being fruitful to a country. Subject to some qualifications, it is true that its benefits do outweigh its costs. Broadly speaking, liberalization of trade should be properly managed. Firstly, the reduction in tariffs and other restrictions should be very gradual and in accord with the pace of industrialization. This means that liberalization of trade should be linked with industrial policy so that it is allowed to fulfil its purpose of industrial competitiveness. Secondly, the focus should be on the achievement of the dynamic gains from trade rather than the static gains. So, the liberalization of trade desirable for a developing country is one that ensures transfer of technology to local producers, significant inflow of FDI, the establishment of research and development projects by foreign firms inside the country, and reinvestment of profits through the regulation of their repatriation by foreign firms. Finally, exchange rate controls should be used to ensure a stable exchange rate and alleviation of foreign exchange pressures that are necessary for controlling
FDI flows and subsidizing of capital imports.
Recommendations
As mentioned in the preceding section, there should be a managed liberalization of trade so that the dynamic gains from trade are experienced. Trade liberalization should be carried out within a strict framework of government supervision and policy. It should be gradual and it should be constantly adjusted according to the capabilities and needs of the economy. There is a tendency among developing countries to cede their policymaking to dictates from world agencies like the WTO, the World Bank and the IMF. The example of China should be followed because ‘despite its accession to the WTO, China has not forfeited its autonomy regarding policy to pursue growth and developmental
goals’ 7 , and still has been one of the best examples of successful trade
no guarantee that removal of restrictions will lead to a Pareto optimumlike situation as described above. The reason, probably, is the differences in the levels of development of various segments of the economy and the world as a whole. The experience of China supports this argument. So it becomes evident that government intervention and active presence in the processes of industrialization and development are necessary. The question is not whether the government should intervene; rather it is how government intervention can be used so that its benefits are over and above its costs. In this context, the following recommendations can be put forward for Pakistan and other similar countries.
Firstly, countries with less developed industrial sector should not try to enter into free trade with countries that are much more advanced. Instead, they should (at first) liberalize their trade with countries similar to themselves. For example, Pakistani industry can have a healthy competition with those in Bangladesh, Sri Lanka, Iran, Vietnam and Central Asian countries. It might be argued that this is not genuine free trade and benefits from trade with advanced countries might be forgone. Note that, ultimately, trade is to be completely liberalized but the beginning should be with nations of similar status and subsequently with nations that have more advanced economies. And it should be kept in mind that policymaking should be done with a dynamic perspective. Free trade with advanced countries may cause high gains to a country, but such gains will be static in nature and dynamic costs in the form of failing industrial sector may be experienced. It should also be noted that there is a significant trend observed in world trade: the division of the world into three or more large blocs of similar nations with large portions of their foreign trade with nations within the same bloc.
Secondly, the government attention toward the development of local market is necessary so that producers supplying to the local market are able to expand and subsequently rise as exporters. This could involve supplyside policies like expenditure on infrastructure, expenditure on higher education to support science and technology, encouragement of research and development activities by local producers, improvement in productivity through education and training of workers, and other such policies. This has to be accompanied with the establishment and maintenance of state owned enterprises in sectors where local investors are reluctant to step in.
Thirdly, foreign firms should be allowed to operate in the country on the condition of technology transfer and partnership with local firms. Else, they are likely to push local firms out of competition. It will cause greater amount of value addition and establishment of a higher level of industrial base. This will also make the problem of intellectual property rights a smaller one by allowing the import of technology. For the process of development and industrialization to be sustainable, advancement in technology should lead the path of growth. And the government should actively move to support the development of skill and technology.
environment. Prices, exchange rates and the stock exchange should also be stable. Any shocks in the form of high rates of inflation or speculative runs in the stock exchange and the foreign exchange market are likely to have negative effects on the competitiveness of local firms in the foreign market. Also, exchange rate stability is especially necessary for stability in the foreign capital flows. Therefore adequate monetary and fiscal policy measures should accompany trade liberalization measures for trade and industrialization to be stable.
References
1. Dominick Salvatore, International Economics, ninth edition, p 303;
2. Moritz Cruz, ‘Can Free Trade Guarantee Gains from Trade?’, United
Nations University World Institute for Development Economics Research (Research Paper No. 2008/97), p 3;
3. Rizwana Sidduqui and A. R. Kemal, Remittances, Trade Liberalization,
and Poverty in Pakistan: the Role of Excluded Variables in Poverty
Change Analysis, PIDE Working Papers (2006:1), p 5, and WTO World
Tariff Profiles, 2006, 2008 and 2009;
4. Government of Pakistan, Economic Survey of Pakistan, 200910, p 90,
table 7.1 (export performance, major categories);
5. World Bank, Databank (online);
6. World Bank, Databank, (online), average calculated using available
statistics;
7. Moritz Cruz, ‘Can Free Trade Guarantee Gains from Trade?’, United
Statistical Appendix
The statistics used for the analysis of Pakistan’s economy are provided in
this section.
Year Trade/GDP a GDP
Growth a Balance CA a TOT a GDP per person b GDP per capita b
[image:14.612.104.488.141.549.2]198081 29.8 7.3 873 100.00 4,020 1,191 198182 26.3 6.4 749 87.07 4,209 1,249 198283 28.1 7.6 1116 79.72 4,392 1,296 198384 27.2 6.8 178 79.82 4,705 1,346 198485 27.0 4.0 688 85.16 4,756 1,377 198586 27.3 8.7 1280 83.90 5,129 1,442 198687 27.2 6.4 758 80.60 5,464 1,482 198788 28.3 5.8 326 86.58 5,468 1,536 198889 29.3 6.4 1162 86.46 5,791 1,610 198990 29.8 4.8 1347 80.42 5,912 1,648 199091 30.2 4.6 1353 80.54 5,938 1,678 199192 33.3 5.6 1558 69.97 6,509 1,719 199293 32.7 7.7 896 74.26 6,731 1,806 199394 29.7 2.3 3327 72.33 6,682 1,792 199495 30.7 4.5 1651 81.56 6,805 1,813 199596 32.5 4.1 2163 82.69 7,123 1,856 199697 32.5 6.6 4348 80.49 7,414 1,899 199798 30.2 1.7 3557 81.80 7,105 1,873 199899 29.4 3.5 1701 99.48 6,999 1,875 199900 25.8 3.9 1866 78.91 7,129 1,898 200001 28.0 1.8 217 73.26 7,524 1,931 200102 27.2 3.1 1,338 73.16 7,533 1,923 200203 28.3 4.7 3,165 66.10 7,484 1,937 200304 28.4 7.5 1,314 63.37 7,682 1,983 200405 31.5 9.0 1,753 59.28 7,834 2,078 200506 35.5 5.8 5,649 52.36 8,378 2,184 200607 33.0 6.8 7,361 50.41 8,149 2,270 200708 36.0 3.7 14,302 44.64 8,589 2,348 200809 32.4 1.2 9,395 45.87 8,950 2,344 Table 2
Source: