N A N O E X P R E S S
Open Access
Spatial resolution of confocal XRF technique
using capillary optics
Maël Dehlinger
1, Carole Fauquet
1, Sebastien Lavandier
1, Orawan Aumporn
1, Franck Jandard
1, Vladimir Arkadiev
2,
Aniouar Bjeoumikhov
2and Didier Tonneau
1*Abstract
XRF (X-ray fluorescence) is a powerful technique for elemental analysis with a high sensitivity. The resolution is presently limited by the size of the primary excitation X-ray beam. A test-bed for confocal-type XRF has been developed to estimate the ultimate lateral resolution which could be reached in chemical mapping using this technique. A polycapillary lens is used to tightly focus the primary X-ray beam of a low power rhodium X-ray source, while the fluorescence signal is collected by a SDD detector through a cylindrical monocapillary. This system was used to characterize the geometry of the fluorescent zone. Capillary radii ranging from 50μm down to 5μm were used to investigate the fluorescence signal maximum level This study allows to estimate the ultimate resolution which could be reached in-lab or on a synchrotron beamline. A new tool combining local XRF and scanning probe microscopy is finally proposed.
Keywords:X-ray fluorescence, Polycapillary, Monocapillary
Background
X-ray fluorescence (XRF) is a highly sensitive, non-destructive technique that is able to detect element traces for material elemental analysis. It is now widely used in various fields of science such as material processing [1], cultural patrimony [2], archaeology [3], medical and biology [4], environment [5], etc. Two ap-proaches are possible to increase the XRF lateral reso-lution for chemical mapping. First, the primary probe diameter can be decreased as the detector aperture is in-creased to keep a significant signal-to-noise ratio. This is the general tendency both for in-lab classical XRF and in synchrotron environment where 30-nm resolution can be offered on few beamlines (see example in [6]). The second solution consists in keeping the primary beam diameter constant and decreasing the detector input aperture. In this latter case, it must be approached as much as possible towards the surface to keep a signifi-cant XRF signal detection. However, the detector steric
hindrance impedes approaching at sub-millimetre
distance from the surface without primary beam shadowing. A solution is to use a sharp monocapillary to
collect the XRF signal near the surface. The XRF signal is proportional to the primary source brightness and thus, in both modes, the higher is the brightness, the higher the signal-to-noise ratio can be expected.
Thanks to the development of new focusing optics like polycapillary lens [7,8], micro-XRF analysis became pos-sible using laboratory and even portable X-ray sources [9]. In this case, the lateral resolution of the technique is essentially provided by the primary beam geometry and still leads to numerous works in a huge variety of do-mains [1,10]. Later, equipping the detector with a second polycapillary lens, a new concept based on a confocal configuration was proposed. Indeed, the detected signal comes from the intersect between the volume excited nearby the source lens focal plane and the analyzed vol-ume in the vicinity of the detector lens focal plane [11-15]. The spatial resolution of the confocal micro-XRF technique is thus enhanced compared to the clas-sical configuration.
However, it is possible to further enhance the spatial resolution of the technique, further shrinking the de-tector acceptance, and approaching virtually towards the surface using a thin cylindrical capillary. In this work, we have built a test-bed for feasibility demonstration using single cylindrical glass capillaries of 50- down to * Correspondence:[email protected]
1CNRS, UMR7325, Aix-Marseille Univ., CINaM, Marseille 13288, France
Full list of author information is available at the end of the article
5-μm radius equipping an EDX detector. XRF escaping from a Co sample irradiated by a focused micro-X-ray source was measured by these means. From the detected flux values, extrapolation gave low flux values that should be realistically measurable with the same detector equipped with a 0.5-μm radius cylindrical capillary.
Methods
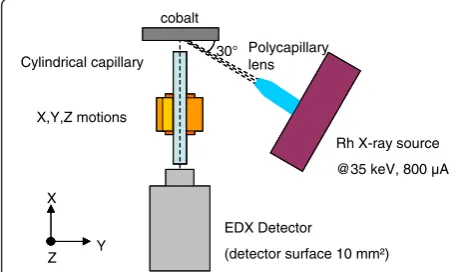
The experimental setup of the confocal XRF test-bed is shown in Figure 1. An X-ray beam provided by a low power Rh source operating at 35 kV and 800 μA is fo-cused on a sample using a 6-mm focal distance polycapillary lens [16,17]. The beam incidence angle is 30°. The source spectrum exhibits a wide Bremsstrahl-ung radiation, narrow Rh-Kα, Rh-Kβ1and Rh-Kβ2rays at 20.216, 22.074 and 22.724 keV, respectively, and X-rays from the L shell excitation at 2.697, 2.692, 2.834, 3.001 and 3.144 keV. Bremsstrahlung, Kα, Kβand sum of X-ray radiation from the L-edge is respectively 56.23%, 2.67%, 0.62% and 40.48% of the total photon flux at 35 kV elec-tron acceleration voltage on (using) a rhodium target [18]. The sample fluorescence is collected by SDD (sili-con drift detector, Brüker GmbH, Karlsruhe, Germany; surface 10mm2) and EDX (energy dispersive X-ray) de-tector through a 50-mm long and 1-mm outer diameter cylindrical X-ray monocapillary. The capillary inner ra-dius is 5, 10, 25 or 50 μm. The cylindrical capillary is placed on X, Y, Z piezo-stages allowing displacements with 30-nm step size while the detector remains in a fixed position. The capillary extremity to sample dis-tance (i.e. the working disdis-tance, WD) is fixed at 1 mm for all experiments. The signal collected depends on the solid angle under which the capillary aperture is seen from the fluorescence zone. Thus, this parameter has to be kept constant during capillary replacement proced-ure. The 1-mm value is controlled by placing the capil-lary in contact with the surface and by removing it using the Z-motion. One millimetre is a high enough WD to avoid primary beam shadowing effect by the capillary
nozzle. A cobalt sample, exhibiting a significant X-ray fluorescence yield under the Rh source excitation, is used to measure the fluorescence signal magnitude col-lected through the different cylindrical capillaries and to estimate the fluorescence flux which could be collected with thinner capillaries.
Results and discussion
In the first series of experiments, the primary spot was characterized. For that purpose, the detector is posi-tioned in direct view of the primary beam. The detector entry is shrunk using a 5-μm diameter lead pinhole placed on the X, Y, Z piezo stages. The pinhole is posi-tioned in the polycapillary lens focal plane and is displaced along the beam spot diameter in the same plane. For each pinhole position, a primary beam spectrum is acquired. Figure 2 shows the X-ray photon flux variations with the pinhole centre position within different incident energy ranges. The incident spot pro-file has a Gaussian shape, and the radius as well as the maximum flux depends on the photon energy. The lens providing the spot consists in a monolithic system made of a great number of monocapillary micrometric glass tubes bent together [10]. Because the Rh low power source is not monochromatized, the total external reflec-tion critical angle of glassθcshould vary with source en-ergyEin agreement with the following equation:
θc¼
0:02pffiffiffiρ
E ; ð1Þ
where ρis the glass capillary density. This is the reason why the incident spot radius provided by the poly-capillary lens depends on the photon energy range, as
Rh X-ray source @35 keV, 800 A Polycapillary
lens cobalt
30°
X,Y,Z motions Cylindrical capillary
EDX Detector
(detector surface 10 mm²) X
[image:2.595.307.540.506.703.2]Y Z
Figure 1Principle of the confocal XRF test bed used in this study.
0 5 10 15 20 25 30
-100 -50 0 50 100
Pinhole centre position (μm)
F
lu
x
(
p
h
o
to
n
s/
s.
μ
m
²)
x
10e-5 3 to 5 keV
[image:2.595.56.288.569.705.2]5 to 7 keV 7 to 9 keV 9 to 11 keV 11 to 13 keV 13 to 15 keV 15 to 17 keV 17 to 19 keV 19 to 21 keV 21 to 23 keV 23 to 25 keV 25 to 27 keV
can be seen in Figure 2. The average spot radius mea-sured at 1/e is 22 μm, and the total photon flux within this spot area is about 1.7 × 10⁹photons/s.
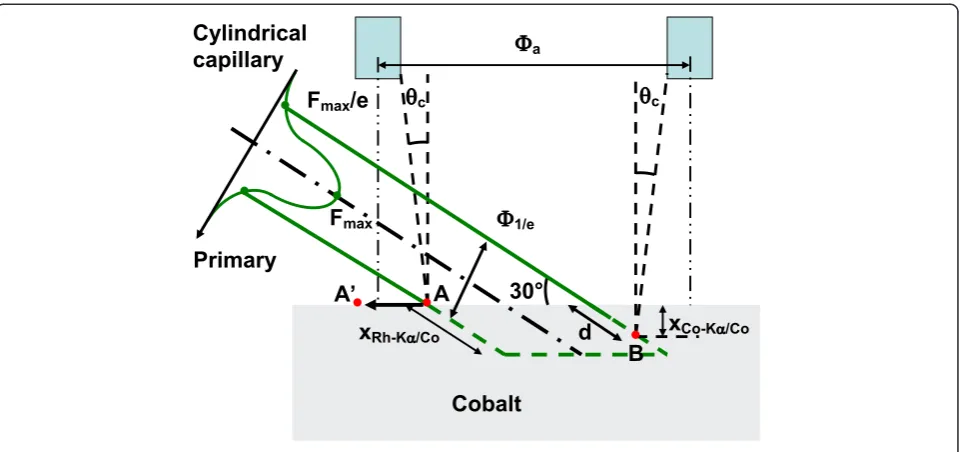
Then, the geometry of the fluorescence emitting vol-ume in the cobalt sample was defined using the confocal XRF configuration shown in Figure 1 by scanning the cylindrical capillary used for detection along the X-ray fluorescence emitting zone. At each cylindrical capillary position, an X-ray spectrum is acquired that exhibits the two characteristic Co-Kαand Co-Kβlines at 6.9 and 7.6 keV, respectively. We then reported in Figure 3 the Kα peak area measured for each capillary position using various capillary radii from 5 to 50 μm. All the curves exhibit identical shape which are not expected to be Gaussian. The primary beam is not perpendicular to the surface so that it penetrates inside the sample with an attenuation length xRh-Kα/Co = 43 μm [19] inducing X-ray fluorescence, itself reabsorbed and leading to sec-ondary emission. This means that the collected fluores-cence comes from a deep excited volume schematically shown in Figure 4. However, the fluorescence emitted within this deep volume cannot be entirely detected since the attenuation length of Co-Kα rays in Co (xCo-Kα/Co = 18 μm [19]) is shorter than the penetration depth of Rh-Kαrays in Co. From simple geometrical considerations, neglecting the secondary emission, a signal is detected over a capillary travelΦagiven:
Φa¼2WD tanð Þ þθc 2rspot=sinð30Þ
þxCo−Kα=Cocot 30ð Þ þ2rcap ð2Þ
whererspotis the primary spot radius measured at 1/e,rcap is the capillary radius and WD is the detection capillary working distance. However, as can be seen in Figure 4, the fluorescence magnitude collected from point A, located at
the cobalt sample surface, is obviously different from that collected from in-depth point B. This is due to the absorp-tion of the primary beam before reaching point B and to strong fluorescence reabsorption in the path through the sample. Thus, in order to compare the theoretical and ex-perimental values ofΦa, we must consider this discrepancy. Taking into account the actual value of the primary beam fluxFmax/e atrspotfrom the spot centre (see Figure 4),
the fluorescence maximum flux F (B) escaping from
the sample emitted at a depth of xCo-Kα/Co = 18 μm (point B)? should be given by:
F Bð Þ ¼Fmaxτ=e2exp −d=xRh−Kα=Co
ð3Þ
where dis the path length of the primary beam in Co till a depth of xCo-Kα/Coandτ is the total fluorescence yield of Cobalt. With the value of τ= 33% taken from [19] the value ofF(B) is expected to be about 0.02Fmax. From this, we arbitrary choose the significant fluores-cence flux above 0.02Fmaxto define the capillary travel
Φa along which fluorescence was detected from the
sample surface. Point A’must thus be chosen instead of point A, to fit with this condition:
F Að Þ ¼’ Fmaxexp− rA’2=rspot2
τ¼0:02 Fmax ð4Þ
Consequently, point A’in Figure 4 is positioned at a dis-tancerA’= 1.7rspotfrom the beam centre. To compare the expected and measured values ofΦa, we have thus replaced 2rspotin Equation 1 by distance A’B = 1.7rspot+rspot. With these considerations, Φa values of 258, 208, 178 and 168 μm are expected for a capillary radius of 50, 25, 10 and 5 μm, respectively. These values are in good agreement with the experimental values ofΦa= 240, 205, 172 and 168μm.
We have then reported in Figure 5 the variations of the maximum flux collected at the centre of the fluores-cent zone as a function of capillary radius for a constant WD of 1 mm. The maximum collected flux increases as rcap1.8. This variation has to be compared to the ideal case of fluorescence collection from a point source using a thin capillary of length L placed at a working distance WD from the emitter. Figure 6 clearly shows that the collected signal level should remain constant if the capil-lary radius is reduced, providing the WD is reduced by the same factor by increasing the capillary length and as-suming an ideal transmission coefficient of 100%. Obvi-ously, the capillary only collects a part of fluorescence, nearly proportional to its section. In our case, the ob-served variations of the signal magnitude with the capil-lary radius are due to the fact that the fluorescent zone has dimensions higher or of the same order of magni-tude than the capillary radius.
Is it possible to increase this signal by decreasing WD? It is well known that cylindrical capillaries allow to sig-nificantly increase the collected signal by comparison
0 100 200 300 400 500 600 700 800
-200 -150 -100 -50 0 50 100 150 200 Capillary centre position (μm)
)
s/
st
n
u
o
c(
l
a
n
gi
s
e
c
n
e
c
s
er
o
ul
[image:3.595.58.291.533.685.2]F
with a pinhole with the same radius placed at the
de-tector entry and positioned at the same WD + L
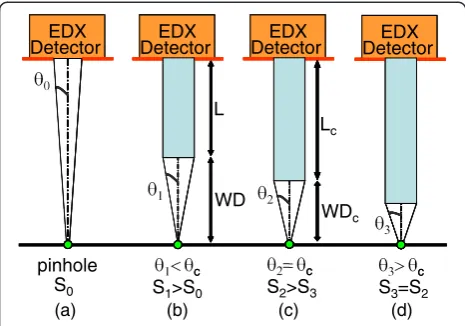
dis-tance (Figure 7a,b) [10]. At high WD, the capillary nozzle is seen under a solid angle θ1 < θc from a point source (Figure 7b). Thus, all X-rays emitted by the point source within this solid angle will be trans-mitted through the capillary, assuming a total reflec-tion of X-rays below the critical angle. The capillary gain Gregarding a pinhole of the same radius is given by the equation [10]:
G≈ θ1ðWDþLÞ=rcap
2
ð5Þ
If WD decreases, keeping WD +Lconstant, the collected signal magnitude first increases since the collection solid
angle increases until it reachesθ2=θcvalue. At this point (Figure 7c), WD reaches WDcvalue given by:
WDc¼rcap=tanð Þθc ≈rcap=θc ð6Þ
In this case, the capillary gain is given by:
G¼ θcðWDcþLcÞ=rcap
2
¼ 1þθcLc=rcap
2
ð7Þ
[image:4.595.59.540.88.314.2]If WD is further decreased, the solid angle θ3 under which the capillary nozzle is seen from the point source is higher than θc(Figure 7d). The collected signal is no Figure 4Sample excited volume geometry.
Fluorescene signal (counts/s)
0 20 40 60
Collect capillary radius ( m) 0.01
1 10,000
100
[image:4.595.304.539.495.694.2]____ simulation ____ experiments ____
Figure 5Maximum fluorescence flux dependence on the capillary radius during capillary scan.Experimental and simulated data.
c
c
EDX Detector
EDX Detector
Collected signal S Collected signal S’=S
[image:4.595.57.292.542.695.2]more limited by the capillary acceptance: the capillary gain as well as the collected signal remain constant. Be-cause the WDc value depends on the capillary radius and the smallest value of WDcis 1 mm for the capillar-ies tested in this work, this optimum value was chosen and taken constant in all these experiments.
Because the fluorescent emitting source in the experi-ments is not punctual, we have started simulations to es-timate the flux collected with a 0.5-μm radius capillary positioned at a WD of 1 mm. These simulations are based on a finite element method calculation from fun-damental parameter equations and will be presented elsewhere. Figure 5 shows the dependence of the col-lected signal with the capillary radius in the range of 0.5 to 50 μm. The calculated values are in good agreement with the experimental ones. The estimated flux with a 0.5-radius capillary is 0.07 photons/s. This value is obtained at 1 mm WD. However, the maximum signal should be reached at 100 μm WDc value. For this WDc value, about 0.7 counts/s flux can be expected. Note that increasing the acquisition time should lead to significant signal level enhancement with our EDX-SDD device. These results show that it is possible to collect the fluor-escence signal using a thinner capillary without any loss on the signal level if it is close enough to the surface. Of course, using a brighter primary source such as a rotat-ing anode or a liquid-metal jet anode electron-impact X-ray source [20], a significantly higher signal (up to 100 times) can be expected Moreover, replacing the cylin-drical capillary at the entry of the detector by an ellip-tical one would lead to an extra gain of 20 [21,22]. Thus sub-micro-resolution XRF would be possible with an
in-lab excitation source. Of course, working with a syn-chrotron source would lead to higher signal magnitude which could allow to further shrink the capillary radius, and a sub-100-nm lateral resolution could probably be reached. The short capillary-sample working distance suggests that the cylindrical capillary could act as a scanning probe microscope tip to acquire simultan-eously sample topography and chemical mapping by XRF analysis [23], as already demonstrated for simultaneous SNOM-XAS XEOL [17] apparatus. Moreover, within this perspective, the spatial resolution of the detection would not be limited by the critical angleθcbecause the extremity of the glass tube would be approached in mechanical near-field interaction with the sample.
Conclusions
In this work, we have developed a test-bed consisting in a low power Rh-source focused with a polycapillary lens on a cobalt sample and in a cylindrical capillary to col-lect the fluorescence signal at the vicinity of the surface. Both capillaries are positioned in a confocal-like config-uration. The primary beam has been first characterized, and the lateral profile of the X-ray spot was found to be a Gaussian which radius and magnitude depend on the X-ray energy range. The average radius measured at 1/e is 22 μm. Then, a cobalt sample was placed in the focal plane of the lens, and the generated fluorescence was collected through a cylindrical capillary fixed on a SDD EDX dectector. The thin detection capillary was then scanned across the sample fluorescence emitting zone. Significant signal was collected over a total capillary travel in very good agreement with what can be deduced from simple geometrical considerations. The fluores-cence signal magnitude increases asrcap1.8 wherercapis the capillary radius. The extrapolated value for a 0.5-μm ra-dius capillary suggests that sub-1-μm resolution XRF should be possible with a laboratory source. Of course, increasing the source brightness, i.e. working with liquid-metal or synchrotron sources could probably lead to reach 100-nm resolution. Operating at short working distances will allow the increase of the signal level detec-tion. Furthermore, it could lead to a new generation of instrument, coupling XRF and scanning probe micros-copy, allowing to simultaneously combine chemical ana-lysis of a sample and topography.
Competing interests
Patent concerning the detection of XRF through capillary optics is pending (European patent # PCT/IB2011/052423, 2011). The authors declare that they have no competing interests.
Authors’contributions
MD and OA carried out the experiments. SL and FJ were involved in instrument design, fabrication and calibration. MD, VA and DT carried out the simulations. CF, AB and DT participated in data interpretation and discussion. DT coordinated this study. MD, CF and DT drafted the manuscript. All authors read and approved the final manuscript.
EDX Detector
pinhole S0
(a)
WD L EDX Detector
c
S1>S0
(b)
EDX Detector
c
S2>S3 Lc
WDc
(c)
EDX Detector
c
S3=S2
(d)
EDX DetectorEDX
Detector DetectorEDX
c
EDX
Detector DetectorEDX
c
EDX
Detector DetectorEDX
c
[image:5.595.57.290.89.252.2]EDX Detector
Figure 7X-ray collection using cylindrical monocapillary. Dependence of the collected flux on capillary working distance WD at constant sample detector distance. The detection through a capillary increases the collection solid angle. (a) Detection through a pinhole. For short capillary length (b), the signal magnitudeS1is higher thanS0detected in case (a); (c) if WD is shortened until WDc,
the signal magnitudeS2increases untilθ2=θc; (d) for WD lower
Acknowledgements
This work was supported by the CEC EUREKA-EUROSTAR program (‘LUMIX’ project E4383) and by the French program CNano-PACA (‘nano-XRF’project).
Author details
1
CNRS, UMR7325, Aix-Marseille Univ., CINaM, Marseille 13288, France.
2IFG-GmbH, Rudower Chaussee 29/31, Berlin 12489, Germany.
Received: 15 November 2012 Accepted: 6 May 2013 Published: 7 June 2013
References
1. West M, Ellis AT, Potts PJ, Streli C, Vanhoof C, Wegrzynek D, Wobrauschek P:
Atomic spectrometry update-X-ray fluorescence spectrometry.J Anal At Spectrom2010,25:1503–1545.
2. Janssens K, Vekemans B, Vincze L, Adams F, Rindby A:A micro-XRF spectrometer based on a rotating anode generator and capillary optics. Spectrochim Acta1996,B51:1661–1678.
3. Cheng L, Ding X, Liu Z, Pan Q, Chu X:Development of a micro-X-ray fluorescence system based on polycapillary X-ray optics for
non-destructive analysis of archaeological objects.Spectrochim Acta2007,
B62:817–823.
4. Börjesson J, Isaksson M, Mattsson S:X-ray fluorescence analysis in medical sciences: a review.Acta Diabetol2003,40:39–44.
5. Kontozova-Deutsch V, Godoi RHM, Worobiec A, Spolnik Z, Krata A, Deutsch F, Grieken R:Investigation of gaseous and particulate air pollutants at the Basilica Saint-Urbain in Troyes, related to the preservation of the medieval stained glass windows.Microchim Acta
2008,162:425–432.
6. Winarski RP, Holt MV, Rose V, Fuesz P, Carbaugh D, Benson C, Shu D, Kline D, Stephenson GB, McNulty I, Maser J:A hard X-ray nanoprobe beamline for nanoscale microscopy.J Synchrotron Rad2012,19:1056. 7. Bjeoumikhov A, Bjeoumikhova S, Wedell R:New developments and
applications of X-ray capillary optics.Part Part Syst Charact2009,
26:97–106.
8. MacDonald A, Gibson WM:Applications and advances in polycapillary optics.X-Ray Spectrom2003,32:258–268.
9. Yonehara T, Orita D, Nakano K, Komatani S, Ohzawa S, Bando A, Uchihara H, Tsuji K:Development of a transportable mu-XRF spectrometer with polycapillary half lens.X-Ray Spectrom2010,39:78–82.
10. Kanngiesser B, Haschke M:Micro X-Ray Fluorescence Spectroscopy.In
Handbook of Practical X-ray Fluorescence Analysis.Edited by Beckhoff B, Kanngiesser B, Langhoff N, Wedell R, Wolff H. Berlin: Springer; 2006:433–474. 11. Kumakhov MA:Capillary optics and their use in X-ray analysis.X-Ray
Spectrom2000,29(5):343–348.
12. Kanngießer B, Malzer W, Reiche I:A new 3D micro X-ray fluorescence analysis set-up - first archaeometric applications.Nucl Instrum Meth Phys Res2003,B211(2):259–264.
13. Smit Z, Janssens K, Proost K, Langus I:Confocal mu-XRF depth analysis of paint layers.Nucl Instrum Meth Phys Res2004,B219–220:35–40. 14. Vincze L, Vekemans B, Brenker FE, Falkenberg G, Rickers K, Somogyi A,
Kersten M, Adams F:Three-dimensional trace element analysis by confocal X-ray microfluorescence imaging.Anal Chem2004,
76(22):6786–6791.
15. Tsuji K, Nakano K:Development of a new confocal 3D-XRF instrument with an X-ray tube.Anal J At Spectrom2011,26(2):305–309.
16. Jandard F, Fauquet C, Dehlinger M, Dahmani B, Bjeoumikhov A, Ferrero S, Pailharey D, Tonneau D:Mapping of X-ray induced luminescence using a SNOM probe.Appl Surf Sci2013,267:81–85.
17. Fauquet C, Dehlinger M, Jandard F, Ferrero S, Pailharey D, Larcheri S, Graziola R, Purans J, Bjeoumikhov A, Erko A, Zizak I, Dahmani B, Tonneau D:
Combining scanning probe microscopy and X-ray spectroscopy. Nanoscale Res Lett2011,6:308.
18. de Chateaubourg SP:La spectrométrie de fluorescence X et l'analyse quantitative de couches minces à l'aide d'échantillons massifs, Application au dosage des aérosols atmosphériques; 1995.PhD Thesis,Université Paris VII-Paris Diderot.
19. Henke BL, Gullikson EM, Davis JC:X-ray interactions: photoabsorption, scattering, transmission and reflection at E = 50-30000 eV, Z = 1-92. Atom Data Nucl Data Tables1993,54(2):181–342.
20. Hemberg O, Otendal M, Hertz HM:Liquid-metal-jet anode electron-impact X-ray source.Appl Phys Lett2003,83(7):1483.
21. Bjeoumikhov A, Bjeoumikhova S, Wedell R:Capillary optics in X-ray Analytics.Part Part Syst Char2006,22:384–390.
22. Bjeoumikhov A, Langhoff N, Bjeoumikhova S, Wedell R:Capillary optics for micro x-ray fluorescence analysis.Rev Sci Instrum2005,
76:063115-1–063115-7.
23. Tonneau D, Fauquet C, Jandard F, Purans J, Bjeoumikhov A, Erko A:Device for topographical characterisation and chemical mapping of surfaces; 2011. European Patent PCT/IB2011/052423.
doi:10.1186/1556-276X-8-271
Cite this article as:Dehlingeret al.:Spatial resolution of confocal XRF technique using capillary optics.Nanoscale Research Letters20138:271.
Submit your manuscript to a
journal and benefi t from:
7Convenient online submission
7Rigorous peer review
7Immediate publication on acceptance
7Open access: articles freely available online
7High visibility within the fi eld
7Retaining the copyright to your article