N A N O E X P R E S S
Open Access
Role of Surface Area, Primary Particle Size, and
Crystal Phase on Titanium Dioxide Nanoparticle
Dispersion Properties
Komkrit Suttiponparnit
1,2†, Jingkun Jiang
1†, Manoranjan Sahu
1, Sirikalaya Suvachittanont
2,
Tawatchai Charinpanitkul
3, Pratim Biswas
1*Abstract
Characterizing nanoparticle dispersions and understanding the effect of parameters that alter dispersion properties are important for both environmental applications and toxicity investigations. The role of particle surface area, primary particle size, and crystal phase on TiO2nanoparticle dispersion properties is reported. Hydrodynamic size, zeta potential, and isoelectric point (IEP) of ten laboratory synthesized TiO2samples, and one commercial Degussa TiO2sample (P25) dispersed in different solutions were characterized. Solution ionic strength and pH affect titania dispersion properties. The effect of monovalent (NaCl) and divalent (MgCl2) inert electrolytes on dispersion properties was quantified through their contribution to ionic strength. Increasing titania particle surface area resulted in a decrease in solution pH. At fixed pH, increasing the particle surface area enhanced the collision frequency between particles and led to a higher degree of agglomeration. In addition to the synthesis method, TiO2isoelectric point was found to be dependent on particle size. As anatase TiO2primary particle size increased from 6 nm to 104 nm, its IEP decreased from 6.0 to 3.8 that also results in changes in dispersion zeta potential and hydrodynamic size. In contrast to particle size, TiO2nanoparticle IEP was found to be insensitive to particle crystal structure.
Introduction
Nanotechnology is finding applicability in the field of environmental protection and has great potential in improving air, water, and soil quality [1]. For example, engineered nanoparticles can efficiently reduce toxic metal emissions from combustion systems and improve air quality by suppressing metal vapor nucleation and promoting metal nanoparticle condensation and coagu-lation [2,3]. Many nanomaterials, such as TiO2, carbon nanotubes, and dendrimers, have been designed to degrade or absorb pollutants in water and soil systems [4-7]. These applications are often determined by the properties of nanomaterials, such as size, surface proper-ties, crystal structures, and morphologies [8,9]. Although nanotechnology has the potential to improve the quality of the environment, there are also concerns that it can
generate a new class of hazards upon release to the environment followed by exposure of either the ecosys-tem or human beings that may result in potential adverse effects [1,10,11]. Toxicological studies with cer-tain engineered nanoparticles (e.g., fullerenes, quantum dots, and metal oxides) have confirmed that they can be potentially harmful due to their high surface molecule/ atom fraction and unique physicochemical properties [12,13]. The emerging discipline of nanotoxicology is aiming to establish the relationship between nanoparti-cle properties (e.g., size, surface properties, and crystal phase) and their toxic potential [14-16].
Titanium dioxide has been widely used in environ-mental photocatalysis, sunscreen, and coating industry [17-19]. However, a variety of detrimental pulmonary effects in rodents and antibacterial effects have also been associated with nanosized TiO2 particle exposure [20-22]. Both the functionalities and biological effects of titania nanoparticles are controlled by its physicochem-ical properties. Nanomaterials that are tested are often dispersed in aqueous systems; this can potentially result * Correspondence: pratim.biswas@wustl.edu
†Contributed equally
1Aerosol and Air Quality Research Laboratory, Department of Energy,
Environmental & Chemical Engineering, Washington University in St. Louis, St. Louis, MO 63130, USA.
Full list of author information is available at the end of the article
in physicochemical property changes, e.g., agglomeration state and surface charge variation [15,23,24].
The agglomeration behavior and surface charge varia-tion of nanoparticle dispersions can have a dramatic effect on both the reactivity of nanomaterials and their efficiency in contamination treatment [7,25,26]. It also affects the response of organisms upon exposure [27-30]. Therefore, accurate characterization of nanoparticle dis-persions becomes very important for its environmental applications and nanotoxicology investigations. Jiang et al. [15] characterized the state (such as the hydrody-namic size, surface charge, and the degree of agglomera-tion) of titania and other nanoparticle suspensions and tested the effect of solution pH and ionic strength (IS) on dispersion properties. However, this study involved only a single value of surface area, primary particle size, and crystal phase for examined dispersion state. It has been reported that these properties of TiO2nanoparticle can affect its photocatalytic activity [19,31] and toxicity [16,32-34]; however, little is known about their effect on the dispersion state and agglomeration behavior. There is evidence suggesting that the point of zero charge of hematite nanoparticle dispersion might change with vary-ing particle size [35]. However, systematic investigations for titania nanoparticle dispersions have not been done.
Recent developments in aerosol route synthesis of TiO2-based nanomaterials allow for greater and inde-pendent control of their physicochemical properties, such as size, crystal phase, and specific surface area [4,36-38]. In this study, the influence of particle surface area, primary particle size, and crystal phase on titania nanoparticle dispersion properties is investigated. TiO2 samples with well-controlled properties are synthesized using flame aerosol reactors (FLAR). Six anatase TiO2 samples with different sizes (6–104 nm) are used to study the size effect. TiO2 nanoparticles of different crystal phases with the same size are used to examine the crystal phase effect. Commercially available Degussa TiO2 (P25) sample is also tested. The effect of monova-lent and divamonova-lent electrolytes is examined using sodium chloride (NaCl) and magnesium chloride (MgCl2).
Materials and Methods
Several types of titania nanoparticles were used in this study. TiO2(P25) nanoparticle with a primary particle size of 27 nm, specific surface area of 57.4 m2/g, and the phase composition of 80% anatase and 20% rutile was purchased from Degussa Chemicals (Hanau, Germany). Anatase TiO2nanoparticles of 6, 16, 26, 38, 53, and 104 nm with specific surface areas of 253.9, 102.1, 61.5, 41.2, 29.7, and 15.0 m2/g, respectively, were synthesized using a flame aerosol reactor [16,36,39]. TiO2nanoparticles of 38 nm with different crystal structures (100% anatase, 49% ana-tase/51% rutile, and 36% anatase/63% rutile) and a specific
surface area of 41.2 m2/g were also synthesized in the flame aerosol reactor. The properties of these samples have been characterized using different techniques, includ-ing X-ray diffraction, transmission electron microscopy, and BET adsorption. They are reported in our previous studies [14,34] and are not repeated here. The precursor used to synthesize TiO2 particles was titanium tetra-isopropoxide (Sigma–Aldrich, St. Louis, Missouri). Rutile TiO2particle with the primary particle size of 102 nm and a specific surface area of 13.8 m2/g was prepared by annealing flame-synthesized anatase TiO2at size 53 nm in a furnace [16]. Other chemicals used in this study includ-ing sodium chloride (NaCl), magnesium chloride (MgCl2), sodium hydroxide (NaOH), and hydrogen chloride (HCl) were obtained from Sigma–Aldrich (St. Louis, Missouri).
The hydrodynamic size and surface charge (zeta potential) of nanoparticle dispersions were characterized using the ZetaSizer Nano ZS (Malvern Instruments Inc., UK), utilizing dynamic light scattering (DLS) and elec-trophoretic light scattering (ELS), respectively [40]. DLS measures the intensity of the laser light that is scattered from dissolved macromolecules or suspended particles. The dispersion hydrodynamic diameter is derived from the temporal evolution of the scattered light intensity using the Stokes–Einstein equation [15]. ELS measures the frequency or phase shift of an incident laser beam caused by electric field driven particle migration, reported as the electrophoretic mobility. Particle zeta potential is calculated from the measured electrophore-tic mobility using the Smoluchowski equation [15,41].
in the range of 15–500μg/ml. In all experiments, titania nanoparticle dispersions were sonicated for 15 min using a bath sonicator (40 W, 50 kHz, Fisher Scientific, Fairlawn, New Jersey) before the size and zeta potential measurement. All measurements were carried out at 25° C, which was maintained by the Zetasizer instrument. Repeatability of all hydrodynamic size and zeta potential was verified with more than five measurements.
Results and Discussion
Surface charge and hydrodynamic diameter are two important properties of nanoparticle dispersions. When a nanoparticle is dispersed in an aqueous solution, sur-face ionization and the adsorption of cations or anions result in the generation of the surface charge and an electric potential will be developed between the particle surface and the bulk of dispersion medium [42,43]. Depending on the measurement technique, surface charge can be represented by either the surface charge density (potentiometric titration) or the zeta potential (electrokinetic methods). The point where surface charge density equals zero is defined as point of zero charge (PZC), while the point where zeta potential equals zero is defined as isoelectric point (IEP) [41,44]. The surface of TiO2 nanoparticles dispersed in water is generally covered by hydroxyl group as shown in Eq. 1,
TiIV+H O2 →TiIV−OH+H+ (1)
The surface charge of titania is a function of solution pH, which is affected by the reactions that occur on the particle surface as shown in Eqs. 2 and 3,
TiIV−OH+H+ →TiIV −OH2+ (2)
TiIV−OH→TiIV −O−+H+ (3)
The pH at which the surface of titania is neutral is point of zero charge or isoelectric point. If no specific
adsorption of the ions presented in the solution takes place on the particle surface, the pH at PZC and IEP would be the same. When pH is less than pHPZC (pHIEP), Eq. 2 results in creation of the positive surface charge and positive zeta potential. When pH is larger than pHPZC (pHIEP), Eq. 3 results in creation of the negative surface charge and negative zeta potential [42,43,45]. The dispersion hydrodynamic diameter is controlled by nanoparticle agglomeration in the aqueous system. In the classical Derjaguin–Landau–Verwey– Overbeek (DLVO) theory, the agglomeration of nano-particles is determined by the sum of the repulsive electrostatic force (the interaction of electrical double layer surrounding each nanoparticle) and the attractive van der Walls force [46,47]. Increase in particle surface charge (zeta potential) can enhance the electrostatic repulsive force, suppress the agglomeration, and subse-quently reduce dispersion hydrodynamic size.
The effects of solution pH and ionic strength (IS) and electrolyte type on titania dispersion properties are pre-sented first, followed by discussion about the influence of particle surface area. Finally, both primary particle size and crystal phase effect on dispersion characteristics are examined.
pH and IS Effect
[image:3.595.56.537.99.240.2]The effect of solution pH and ionic strength (IS) on the zeta potential and hydrodynamic size is shown in Figure 1. The IEP for TiO2 (P25) is approximately 6.2, which is consistent with those reported in other studies [15,48,49]. Since NaCl is an inert electrolyte for TiO2 dispersion (no specific adsorption of Na+ or Cl-by the titania nanoparticle), the IEP remains the same at differ-ent ionic strengths obtained by varying the NaCl con-centration [41,50]. When pH is different from pHIEP, an increase in IS reduces the dispersion zeta potential by compressing the electrical double layer. This is consis-tent with previous tests [15,51,52] and predictions of classical colloidal theory [53]. Solution pH affects the dispersion hydrodynamic diameter by changing the Table 1 Summary of experiments performed
Case Nanoparticles Conditions Objective
1 TiO2(P25) Particle concentration: 50μg/ml; Three ionic strengths (0.001, 0.01, and 0.1 M)
and varying pH (3–11) by adding HCl, NaCl, and NaOH.
Determine the effect of solution IS and pH on dispersion characteristics
2 TiO2(P25) Particle concentration: 50μg/ml; NaCl and MgCl2with the same IS and with the
same molar concentrations.
Examine the effect of electrolyte type (monovalent vs. divalent) on dispersion characteristics
3 TiO2(P25) Particle concentration: 15, 25, 50, 150, and 500μg/ml; DI H2O; Solutions with pH
of 4 and IS of 0.001–0.1 M by adding HCl and NaCl.
Test the effect of nanoparticle surface area (mass concentration) on the dispersion properties
4 Anatase TiO2
(6–104 nm)
Particle concentration: 50μg/ml; DI H2O; Solutions with IS of 0.001 M and
varying pH (3–11) by adding HCl, NaCl, and NaOH.
Study the effect of primary particle size on dispersion properties
5 TiO2(varying
crystal phases)
Particle concentration: 50μg/ml; Solutions with IS of 0.001 M and varying pH
(3–11) by adding HCl, NaCl, and NaOH.
particle surface charge. Near IEP, significant agglomera-tion takes place; large flocs were observed, as the parti-cle surface charge is close to zero and attractive van der Waals forces are dominant. When the pH is significantly different from IEP for titania, the absolute value of zeta potential becomes higher and the hydrodynamic size becomes smaller. Solution IS changes the dispersion hydrodynamic diameter by changing both zeta potential and electrical double layer thickness. Higher solution IS leads to a smaller electrical double layer thickness, weaker electrostatic repulsive force, and subsequently larger hydrodynamic size. The smallest hydrodynamic size observed was ~200 nm, when the solution IS was 0.001 M and pH was lower than 4.0 or higher than 8.2.
If an electrolyte does not generate ions that can be specifically absorbed by titania nanoparticles, its influ-ence on dispersion properties can be quantified through its contribution to solution ionic strength. TiO2 (P25) was dispersed in both monovalent NaCl and divalent MgCl2 solutions either at the same ionic strength (Figure 2a) or at the same electrolyte molar concentra-tion (Figure 2b). The soluconcentra-tion pH (~5.5) was lower than TiO2 (P25) IEP such that positive zeta potentials were observed in both cases. When the same IS was used, dispersions using NaCl and MgCl2 did not show any
significant difference in zeta potential and hydrodynamic size. The trends of zeta potential and hydrodynamic size as a function of IS were the same as described earlier. When the same molar concentration was used, the solu-tion IS using divalent MgCl2was twice as high as the IS using monovalent NaCl. Consequently, titania dispersion using MgCl2 had lower zeta potential and higher hydro-dynamic diameter compared to a dispersion using NaCl of the same molar concentration.
Particle Surface Area Effect
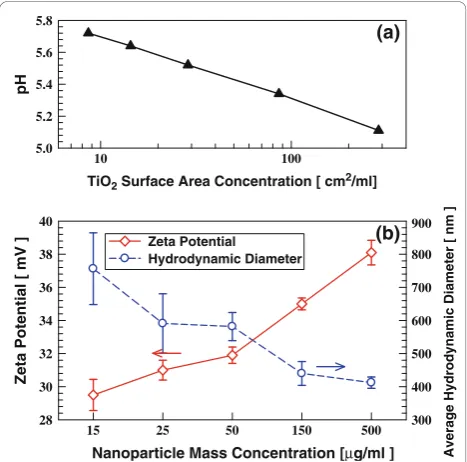
Titania nanoparticle surface area in the dispersion affects both solution pH and dispersion properties. TiO2 (P25) nanoparticles with mass concentrations of 15, 25, 50, 150, and 500μg/ml were dispersed in DI water. As the size of the particles in the sample is the same, the particle surface area is proportional to the particle mass concentration. As shown in Figure 3a, solution pH decreased as the particle surface area increased. When TiO2 nanoparticle is dispersed in water, its surface is covered by the hydroxyl group and extra hydrogen ions are produced (Eq. 1). Consequently, the solution pH decreases as more hydrogen ions are generated due to the increase in titania particle surface area. When parti-cle mass concentration was increased from 15 to
500μg/ml, the pH of the solution decreased from 5.7 to
pH
Zeta Potential [ mV ]
-40 -20 0 20 40
IS = 0.001M IS = 0.01M IS = 0.1 M
pH
8 10 12
2 4 6
2 4 6 8 10 12
A
v
er
age Hy
dr
ody
nami
c Di
ameter
[ nm ]
102 103
104
(a)
[image:4.595.307.538.86.358.2](b)
Figure 1The influence of solution ionic strength (IS) and pH on TiO2(P25) dispersion properties: a zeta potential;
b hydrodynamic diameter.
Ionic strength [ M ]
Zeta Potential [ mV ]
8 10 12 14 16 18 20
Average Hydrodynamic Diameter [ nm ]
103
104
Zeta Potential (NaCl) Zeta Potential (MgCl2) Hydrodynamic Diameter (NaCl) Hydrodynamic Diameter (MgCl2)
Electrolyte Concentration [ M ]
0.001 0.01 0.1
0.001 0.01 0.1
Zeta Potential [ mV ]
6 8 10 12 14 16 18 20
Average Hydrodynamic Diameter [ nm ]
103
104 (a)
(b)
[image:4.595.59.294.89.378.2]5.1. Solution pH also became farther shifted from the TiO2 (P25) isoelectric point (6.2). Therefore, the disper-sion zeta potential increased from 29 to 38 mV (Figure 3b). Though higher mass concentration often leads to larger hydrodynamic diameters, the average hydrody-namic diameter decreased from 756 to 412 nm, because the associated increase in the zeta potential (increase in repulsive force) prevented agglomeration. If the particle concentration is increased further, an increase in the average hydrodynamic diameter is expected, since the frequency of particle collision is a strong function of particle number concentration [54,55].
Particle concentration effect was further examined by fixing the solution pH at ~4. Three ionic strengths and five different mass concentrations were tested. As shown in Figure 4, the dispersion hydrodynamic diameter did not decrease with increasing particle surface area once the solution pH was fixed. At low solution IS, the disper-sion hydrodynamic size remained similar with increasing particle concentration, because the electrostatic repulsive force helped to prevent agglomeration. At high solution IS, the increased particle number concentration led to enhanced coagulation rates and larger hydrodynamic dia-meters. At solution IS of 0.1 M and particle mass concen-tration of 500μg/ml, the average hydrodynamic diameter was ~2,900 nm (large agglomerates).
Primary Particle Size Effect
The influence of primary particle size on the titania dis-persion isoelectric point was tested using laboratory
synthesized TiO2 nanoparticles. Anatase TiO2 samples of different sizes (6, 16, 26, 38, 53, and 104 nm) were tested using solutions with an IS of 0.001 M. As shown in Figure 5, the IEP of anatase TiO2 was found to be a function of primary particle size. When primary particle size increased from 6 to 104 nm, the IEP decreased from 6.0 to 3.8. It has been reported that different iso-electric points can be obtained for the same material depending on the synthesis method and experimental procedure [45,48,49]. This might explain why 27-nm TiO2 (P25) has an IEP of 6.2 while laboratory synthe-sized 26-nm TiO2has an IEP of 5.2 (their crystal phases are also different, which will be addressed later). How-ever, these six samples were prepared using the same TiO2 Surface Area Concentration [ cm2/ml]
100 10
pH
5.0 5.2 5.4 5.6 5.8
Nanoparticle Mass Concentration [μg/ml ]
15 25 50 150 500
Zeta Potential [ mV ]
28 30 32 34 36 38 40
Average Hydrodynamic Diameter [ nm ]
300 400 500 600 700 800 900 Zeta Potential
Hydrodynamic Diameter
(a)
[image:5.595.303.539.87.258.2](b)
Figure 3 The influence of nanoparticle surface area (mass concentration) on TiO2(P25) dispersion characteristics: a pH; b zeta potential and hydrodynamic diameter. Solvent is DI water.
Nanoparticle Mass Concentration [μg/ml ]
15 25 50 150 500
Average Hydrodynamic Diameter [nm] 0 500 1000 1500 2000 2500 3000 3500
[image:5.595.57.291.89.320.2]IS = 0.001M IS = 0.01M IS = 0.1M
Figure 4TiO2(P25) dispersion hydrodynamic diameter as a function of particle mass concentration at constant solution pH of 4 and different solution ionic strengths (0.001–0.1 M).
pH
2 4 6 8 10 12
Zeta Potential [ mV ]
-60 -40 -20 0 20 40
6nm 16nm 26nm 38nm 53nm 104nm
Primary Particle Size [ nm ]
0 20 40 60 80 100
Isoelectric Point 3.5 4.0 4.5 5.0 5.5 6.0
[image:5.595.305.539.496.681.2]synthesis technique, and the experimental procedures were the same. In addition, there was evidence suggest-ing that hematite nanoparticle IEP might vary with par-ticle size [33], though only three sizes were examined in that study.
[image:6.595.305.540.86.348.2]The size effect on dispersion isoelectric point might originate from size-related properties of nanoparticles. Several other activities of titania nanoparticles had been found to be size dependent. The photocatalytic activity of TiO2 nanoparticle was reported to be a function of particle size when the same total particle surface area was used [19,56]. Both in vitro and in vivo toxicities of anatase TiO2 (after normalized by surface area) were reported to be a function of particle size [16,32]. The adsorption affinity of metal (e.g., lead and cadmium) by TiO2 appeared to be size dependent [57,58]. As nano-particle size decreases, the percentage of surface atom/ molecule increases significantly. Particle electronic structure, surface defect density, and surface sorption sites also vary [7,59]. Consequently, both nanoparticle IEP and surface reactivity can become dependent on particle size. For instance, it has been observed that var-iations in the nanoparticle surface coordination environ-ment lead to changes in the surface acidity constants [60,61].
The effect of primary particle size on dispersion properties was examined by dispersing different sized anatase TiO2 in DI water. Since the same mass con-centration (50 μg/ml) was used for all samples with differing particle sizes, the TiO2 particle surface area increased dramatically as particle size decreased (Figure 6a). Solution pH decreased with increasing par-ticle surface area (as discussed earlier). Anatase TiO2 of 6 nm had the highest positive zeta potential due to its high IEP and low solution pH. A transition from positive to negative zeta potential happened between 16 and 26 nm. TiO2 of 104 nm has the highest nega-tive zeta potential due to its low IEP and high solution pH. The average hydrodynamic diameter is not only a function of zeta potential and solution IS, but also a strong function of primary particle size. If no agglom-eration occurs, i.e., the repulsive forces are completely dominant over the attractive forces, the hydrodynamic diameter should just reflect the primary particle size. The average hydrodynamic diameter increased from 67 to 490 nm as primary particle size increased from 6 to 104 nm (Figure 6b). The fact that the dispersion hydrodynamic diameter increment is not linearly pro-portional to primary particle size increment is due to particle–particle interaction that is affected by the dis-persion zeta potential and IS. A detailed discussion of the reasons for the dispersion hydrodynamic diameter being larger than primary particle size can be found elsewhere [15].
Nanoparticle Crystal Phase Effect
The influence of titania crystal phase on dispersion iso-electric points was also examined using laboratory synthesized samples. Three 38-nm TiO2 samples with different anatase percentages (100, 49, and 36%; remain-der being rutile) and one 102-nm rutile (100%) TiO2 sample were tested using solutions with IS of 0.001 M. For the three same sized TiO2 with different crystal structures, their dispersion isoelectric points (~4.8) were similar to each other (Figure 7). The IEP of 102-nm rutile TiO2 was lower than pH 3 such that the crossing point was not measured when pH range of 3–11 was used. The observation that the IEP of TiO2 at the same size is rather insensitive to the crystal structure is con-sistent with reports in the previous literature [49]. There are two possible factors accounting for the low IEP of the 102-nm rutile TiO2 sample. If the observed size-dependent IEP trend for anatase TiO2 is also valid for rutile TiO2, one would expect than 102-nm rutile has a lower IEP than that of 38-nm rutile. In addition, Figure 5 shows that 104-nm anatase TiO2 has an IEP of 3.8, while IEP of rutile with similar size (102 nm) is lower than pH 3. This might be related to the synthesis meth-ods used—anatase TiO2was directly synthesized using a flame aerosol reactor, while rutile TiO2 was prepared by annealing flame-synthesized 53-nm anatase TiO2at 850° C using a furnace. Other studies [41,45] also found that
Primary Particle Size [ nm ]
Zeta Potential [ mV ]
-20 -10 0 10 20 30 40
Average Hydrodynamic Diameter
[ nm ]
0 100 200 300 400 500 600 Zeta Potential
Hydrodynamic Diameter Primary Particle Size [ nm ]
0 20 40 60 80 100 120
0 20 40 60 80 100 120
pH
4.8 5.0 5.2 5.4 5.6 5.8 6.0 6.2
TiO
2
Surface Area Concentration
[ cm
2 /ml
]
0 20 40 60 80 100 120 140
pH
Nanoparticle Surface Area Concentration
(a)
(b)
metal oxides synthesized using different methods may have different isoelectric points.
Conclusions
The effect of particle surface area, primary particle size, and crystal phase on TiO2nanoparticle dispersion prop-erties was tested. Solution pH and ionic strength play important roles in dispersion zeta potential and hydro-dynamic size. Increasing titania particle surface area results in a decrease in solution pH. At fixed pH, an increase in titania mass concentration enhances the col-lision frequency between particles and leads to higher degree of agglomeration. In addition to synthesis method, TiO2 isoelectric point was found to be depen-dent on particle size. As anatase TiO2 primary particle size decreases, its IEP increases that also causes changes in dispersion zeta potential and hydrodynamic size. In contrast to particle size, it was demonstrated that TiO2 nanoparticle IEP is insensitive to crystal structure. These results have important implications both in developing nanomaterials for environmental applications and in performing nanotoxicological studies, because nanopar-ticle dispersion properties affect delivery and transport efficiency for both contamination remediation and for in vitro and in vivo toxicity tests.
Acknowledgements
The authors acknowledge the Thailand Research Fund (TRF) for Komkrit Suttiponparnit under the Royal Golden Jubilee Ph.D. Program (Grant No. PHD/0237/2004) accompanied with KU-ChE and Affiliation: Center of Excellence for Petroleum, Petrochemicals, and Advance Materials, PERDO, Thailand for partial funding. This work was partially supported by a grant from the US. Department of Defense (AFOSR) MURI Grant, FA9550-04-1-0430. TC also acknowledges the partial support from CU centennial fund.
Author details
1Aerosol and Air Quality Research Laboratory, Department of Energy,
Environmental & Chemical Engineering, Washington University in St. Louis,
St. Louis, MO 63130, USA.2Department of Chemical Engineering, Kasetsart
University, 50 Paholyothin Road, Jatujak, Bangkok 10900, Thailand.3Center of
Excellence in Particle Technology, Department of Chemical Engineering, Faculty of Engineering, Chulalongkorn University, Patumwan, Bangkok 10330, Thailand.
Received: 30 June 2010 Accepted: 18 August 2010 Published: 3 September 2010
References
1. USEPA:Science Policy Council.USEPA, Washington, DC; 2007, 20460.
2. Lee MH, Cho K, Shah AP, Biswas P:Environ Sci Technol2005,39:8481.
3. Biswas P, Wu CY:J Air Waste Manag Assoc1998,48:113.
4. Tiwari V, Jiang J, Sethi V, Biswas P:Appl Catal A: Gen2008,345:241.
5. Biswas P, Wu CY:J Air Waste Manag Assoc2005,55:708.
6. Savage N, Diallo MS:J Nanopart Res2005,7:331.
7. Waychunas GA, Kim CS, Banfield JF:J Nanopart Res2005,7:409.
8. Lee S, Cho IS, Lee JH, Kim DH, Kim DW, Kim JY, Shin H, Lee JK, Jung HS,
Park NG, Kim K, Ko MJ, Hong KS:Chem Mater2010,22:1958.
9. Zhong P, Que WX:Nano-Micro Lett2010,2:1.
10. NSTC: Washington, D.C., 2008.
11. Royal Society: London, 2004.
12. Oberdorster G, Maynard A, Donaldson K, Castranova V, Fitzpatrick J,
Ausman K, Carter J, Karn B, Kreyling W, Lai D, Olin S, Monteiro-Riviere N,
Warheit D, Yang H:Part Fibre Toxicol2005,2:8.
13. Wiesner MR, Lowry GV, Alvarez P, Dionysiou D, Biswas P:Environ Sci Technol
2006,40:4336.
14. Oberdorster G, Oberdorster E, Oberdorster J:Environ Health Perspect2005,
113:823.
15. Jiang J, Oberdörster G, Biswas P:J Nanopart Res2009,11:77.
16. Jiang J, Oberdörster G, Elder A, Gelein R, Mercer P, Biswas P:Nanotoxicology
2008,2:33.
17. Carp O, Huisman CL, Reller A:Prog Solid State Chem2004,32:33.
18. Chen X, Mao SS:Chem Rev2007,107:2891.
19. Almquist CB, Biswas P:J Catal2002,212:145.
20. Wei C, Lin WY, Zainal Z, Williams NE, Zhu K, Kruzic AP, Smith RL,
Rajeshwar K:Environ Sci Technol1994,28:934.
21. Warheit DB, Webb TR, Sayes CM, Colvin VL, Reed KL:Toxicol Sci2006,
91:227.
22. Oberdorster G:Phil Trans R Soc Lond A2000,358:2719.
23. Powers KW, Brown SC, Krishna VB, Wasdo SC, Moudgil BM, Roberts SM:
Toxicol Sci2006,90:296.
24. Maynard AD:Ann Occup Hyg2002,46:197.
25. Gilbert B, Ono RK, Ching KA, Kim CS:J Colloid Interf Sci2009,339:285.
26. Zeng H, Singh A, Basak S, Ulrich KU, Sahu M, Biswas P, Catalano JG,
Giammar DE:Environ Sci Technol2009,43:1373.
27. Choi HS, Liu W, Misra P, Tanaka E, Zimmer JP, Ipe BI, Bawendi MG,
Frangioni JV:Nat Biotechnol2007,25:1165.
28. Hoshino A, Fujioka K, Oku T, Suga M, Sasaki YF, Ohta T, Yasuhara M,
Suzuki K, Yamamoto K:Nano Lett2004,4:2163.
29. Lockman PR, Koziara JM, Mumper RJ, Allen DD:J Drug Target2004,12:635.
30. Wu B, Huang R, Sahu M, Feng X, Biswas P, Tang YJ:Sci Total Environ2010,
408:1955.
31. Jang HD, Kim SK, Kim SJ:J Nanopart Res2001,3:141.
32. Jiang J: Washington University in St. Louis: St. Louis; 2008.
33. Grassian VH:J Phys Chem C2008,112:18303.
34. Braydich-Stolle LK, Schaeublin NM, Murdock RC, Jiang J, Biswas P,
Schlager JJ, Hussain SM:J Nanopart Res2009,11:1361.
35. He YT, Wan JM, Tokunaga T:J Nanopart Res2008,10:321.
36. Jiang J, Chen DR, Biswas P:Nanotechnology2007,18:285603.
37. Worathanakul P, Jiang JK, Biswas P, Kongkachuichay P:J Nanosci
Nanotechnol2008,8:6253.
38. Dhumal SY, Daulton TL, Jiang J, Khomami B, Biswas P:Appl Catal B: Environ
2009,86:145.
39. Thimsen E, Biswas P:AICHE J2007,53:1727.
40. Delgado AV, Gonzalez-Caballero F, Hunter RJ, Koopal LK, Lyklema J:J Colloid
Interf Sci2007,309:194.
41. Kosmulski M:Surface Charging and Points of Zero Charge.CRC Press,
Boca Raton; 2009.
42. Stumm W, Morgan JJ:Aquatic Chemistry.Wiley-Interscience, New York;
1996. pH
2 4 6 8 10 12
Zeta Potential [ mV ]
-60 -40 -20 0 20
40 100% Anatase (38 nm)
[image:7.595.57.293.89.259.2]49% Anatase (38 nm) 36% Anatase (38 nm) 0% Anatase (102 nm)
43. Davis JA, James RO, Leckie JO:J Colloid Interf Sci1978,63:480.
44. Morrison ID, Ross S:Colloidal Dispersions: Suspensions, Emulsions, and
Foams.Wiley-Interscience, New York; 2002.
45. Parks GA:Chem Rev1965,65:177.
46. Derjaguin BV, Landau LD:Acta Physicochim URSS1941,14:733.
47. Verwey EJW, Overbeek JTG:Theory of the Stability of Lyophobic Colloids.
Elsevier, Amsterdam; 1948.
48. Kosmulski M:J Colloid Interf Sci2009,337:439.
49. Kosmulski M:Adv Colloid Interf Sci2002,99:255.
50. Grahame DC:Chem Rev1947,41:441.
51. Widegren J, Bergstrom L:J Am Ceram Soc2002,85:523.
52. Brant J, Lecoanet H, Wiesner MR:J Nanopart Res2005,7:545.
53. Hunter RJ:Zeta Potential in Colloid Science.Academic press Inc, London;
1981.
54. O’Melia CR:Aquatic Chemistry.American Chemical Society, Washington,
DC; 1995, 315.
55. Friedlander SK:Smoke, Dust, and Haze: Fundamentals of Aerosol
Dynamics.Oxford University Press, New York; 2000.
56. Sclafani A, Herrmann JM:J Phys Chem1996,100:13655.
57. Gao Y, Wahi R, Kan AT, Falkner JC, Colvin VL, Tomson AB:Langmuir2004,
20:9585.
58. Giammar DE, Maus CJ, Xie LY:Environ Eng Sci2007,24:85.
59. Gilbert B, Banfield JF:Mol Geomicrobiol2005,59:109.
60. Bickmore BR, Rosso KM, Nagy KL, Cygan RT, Tadanier CJ:Clays Clay Miner
2003,51:359.
61. Bullard JW, Cima MJ:Langmuir2006,22:10264.
doi:10.1007/s11671-010-9772-1
Cite this article as:Suttiponparnitet al.:Role of Surface Area, Primary Particle Size, and Crystal Phase on Titanium Dioxide Nanoparticle Dispersion Properties.Nanoscale Res Lett20116:27.
Submit your manuscript to a
journal and benefi t from:
7Convenient online submission
7 Rigorous peer review
7Immediate publication on acceptance
7 Open access: articles freely available online
7High visibility within the fi eld
7 Retaining the copyright to your article