BIROn - Birkbeck Institutional Research Online
Cocea, M. and Magoulas, George D. (2017) Design and evaluation of a
case-based system for modelling exploratory learning behaviour of math
generalisation. IEEE Transactions on Learning Technologies , ISSN
1939-1382.
Downloaded from:
Usage Guidelines:
Please refer to usage guidelines at
or alternatively
Design and evaluation of a case-based system
for modelling exploratory learning behaviour of
math generalisation
Mihaela Cocea
Member, IEEE
and George D. Magoulas,
Member, IEEE
Abstract—Exploratory learning environments (ELEs) promote a view of learning that encourages students to construct and/or explore models and observe the effects of modifying their parameters. The freedom given to learners in this exploration context leads to a variety of learner approaches for constructing models and makes modelling of learner behaviour a challenging task. To address this issue, we propose a learner modelling mechanism for monitoring learners’ actions when constructing/exploring models by modelling sequences of actions reflecting different strategies in solving a task. This is based on a modified version of case-based reasoning for problems with multiple solutions. In our formulation, approaches to explore the task are represented as sequences of simple cases linked by temporal and dependency relations, which are mapped to the learners’ behaviour in the system by means of appropriate similarity metrics. This paper presents the development and validation of the modelling mechanism. The model was validated in the context of an ELE for mathematical generalisation using data from classroom sessions and pedagogically-driven learning scenarios.
Index Terms— Intelligent/ Adaptive learning systems, learner modelling, case-based reasoning, mathematics, evaluation.
F
1
INTRODUCTION
T
HISpaper describes the development and validation of a user model for an Exploratory Learning Environment (ELE) allowing diagnosisduringa task rather than at the end of it; to this end, a case-based reasoning inspired approach is used. The link between pedagogical rationale and modelling process is highlighted, including how pedagogy informs the choice of modelling technique and its validation.ELEs promote constructivist learning [1], allowing learn-ers to explore and learn from constructing and exploring models. Deep conceptual and structural knowledge emerges from this way of learning [2], being particularly suitable for domains that allow multiple solutions or domains whose understanding would be facilitated by having different per-spectives on the same phenomena [3].
Simulations [4], [5] and cognitive tools [6] have been used to support exploratory learning. In computer simu-lations, models of a system or process are created and/or explored [2]; learners typically change the values of the input variables of the simulator and observe the results in the output variables of the simulated models, thus discover-ing the characteristics of the domain underlydiscover-ing the sim-ulation. Several processes were identified for exploratory learning [2], [7]: hypothesis generation, experiment design, prediction and data analysis. Cognitive tools have been proposed to support learners with some of these processes.
Despite having features that benefit learning, ELEs pose challenges for learners and their effectiveness is affected by learners’ activity level [8]. Research shows that learners have difficulties with choosing the right variables [7], making predictions and interpreting data [9], and generalising the
• M. Cocea is with the School of Computing, University of Portsmouth, Buckingham Building, Lion Terrace, Portsmouth PO1 3HE, UK. E-mail: [email protected]
• G.D. Magoulas is with the Knowledge Lab, Birkbeck College, University of London, Malet Street, London WC1E 7HX, UK.
Manuscript received July XX, XXXX; revised January XX, XXXX.
results [10]. Exploratory learning without guidance and support seems to be less effective than more constrictive en-vironments, where step-by-step guidance is provided [11].
In this paper, we present an approach for identifying when such difficulties occur through monitoring learners’ interactive behaviour. The aim is to model learners’ pro-gression during task exploration, build a model of their knowledge1and store a history of their learning trajectory. This has been developed in the context ofeXpresser, an ELE for the domain of mathematical generalisation. To meet this aim the work in the paper is organised as follows:
1) investigate what aspects of a learner’s activity are to be monitored to assess the learner’s progress within a task ineXpresser(the analysis process);
2) find an appropriate way to represent this knowledge and a mechanism for identifying these aspects when the learner is using the system (the mapping process); 3) provide evidence of the identification mechanism’s
va-lidity by means of scenario-based validation and real data from classroom sessions usingeXpresser, and from subject experts (validation).
This paper presents unpublished details of our approach for designing and evaluating the learner model focusing on: (a) a revised list of pedagogically-driven scenarios; (b) the evaluation of the modelling mechanism with domain ex-perts; (c) outlining the role of pedagogy and system design in informing the choice and details of the modelling tech-nique and its evaluation. The role of the learner modelling mechanism in supporting feedback prioritisation has been reported in [12], [13], [14], and a preliminary list of learning scenarios was mentioned in [15]. Issues of maintenance and enrichment of the knowledge representation in the system
over time were discussed in [16], [17], [18], and details on the overall methodology can be found in [19]. We argue that the proposed approach is particularly suitable for exploratory tasks and can offer a good balance between modelling under uncertainty and dealing with a wide solution space.
Section 2 overviews learner modelling in ELEs and Sec-tion 3 introduces mathematical generalisaSec-tion witheXpresser. Section 4 covers the analysis process (conceptual model and learning scenarios), Section 5 presents the mapping process (data representation and modelling mechanism), Section 6 covers the validation of the approach and the subsequent sections discuss the results and conclude the paper.
2
LEARNER MODELLLING IN
ELES
Exploratory/open/discovery/inquiry learning environ-ments are characterised by freedom and encourage learners to explore the learning domain rather than being guided in the structured manner typically used by Intelligent Tutoring Systems (ITS). In ITS, the learner is typically guided towards the solution of a problem, with clear steps to be followed. In ELEs, there is no linear structure and often there are several solutions to a problem that can be reached through various combinations of steps, which are not explicitly represented in a domain or solution space model. This different way of interaction requires a different approach for learner mod-elling compared with the traditional ITS approaches.
In the past decade there has been a significant growth in the development of exploratory environments used in education, of which some recent ones are: the Crystal Is-land educational game [20], BioLogica [21], [22], DC Circuit Construction Kit [23] and Fraction Lab [24].
Despite the increased numbers of ELEs, there are very few that employ user/learner modelling. A learner model is a representation of a learner and consists of data about the learner or about what the learner does using the system. Typically, a learner model stores data about a learner’s knowledge, preferences, goals, tasks and interests [25]. Learner modelling is the process of generating a learner model and typically includes three tasks [26]: (a) learner diagnosis: observing and interpreting user’s behaviour or preferences and updating the model; (b)model maintenance: encoding and integrating the information in the model; (c)
model employment: the usage of the model for various pur-poses, such as adaptive and personalised feedback, support for collaboration and support for the teacher.
In our work, learner diagnosis involves unobtrusive observations of user behaviour and its interpretation; we use information which is either collected directly by unob-trusive observations of the user behaviour (e.g. landmarks mentioned later belong to this category) or inferred through analysis (e.g. similarity-based technique). Model employ-ment is discussed only in terms of what information from the learner models can be used for feedback purposes or informing other pedagogical actions such as adapting the interface and altering the tasks given.
Although there are a variety of intelligent learning en-vironments that use learner modelling, there are only few reports in the literature that describe research in the area of
learner modeling in ELEs: (a) clustering and association rule
mining were used to identify an optimal representation of learner behaviour for circuit construction [23], (b) Bayesian networks were used for a mathematical functions do-main [27] and (c) a neuro-fuzzy system is used for student diagnosis in a physics domain [28]. The first one used a data-driven approach to investigate the trade-offs between low and high levels of detail in the representation on users’ interactions. The second approach uses a “classic” overlay model approach and discusses the difficulty of identifying what to model and of diagnosing the (in)correctness of user actions. The third approach employs expert knowledge from physics teachers which were encoded as fuzzy sets and rules; when the teachers’ knowledge was not well-defined, practical examples were used to train a neural network to represent the expertise reflected in those examples.
Unlike prior research, our approach operatesduringtask execution in the sense that it processes sequences of user data, improving learner’s diagnosis on-the-fly as more evi-dence is collected (see Section 6.1); this is different from the way ITS provide feedback during problem-solving and it is further discussed in Section 7. In addition, our approach and its evaluation are informed by pedagogical considerations.
3
LEARNING WITH
eXpresser
In this section, eXpresser is described, with details about the target users and the types of tasks they are asked to solve. We highlight how the system aims to address known problems in learning mathematical generalisation.
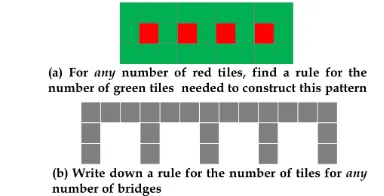
The tasks in eXpresser are about identifying structural relationships that underpin figural patterns [29], which are standard in the English mathematics curriculum for Grades 7 to 9 (11 to 14 year olds). Two examples, including the task instructions, typically given to students to do in class using pen and paper are given in Fig. 1 [30]. The students tend to think in terms of a specific pattern instead of thinking generally, which is partly attributed to the static nature of the figures [30] and partly to the use of the wordanyin the examples given in Fig. 1, and the link between ‘any value’, i.e. the general, and a particular value, i.e. the specific [30]. To overcome this, ineXpresserthe task figural patterns are
animatedwhen presented to students.
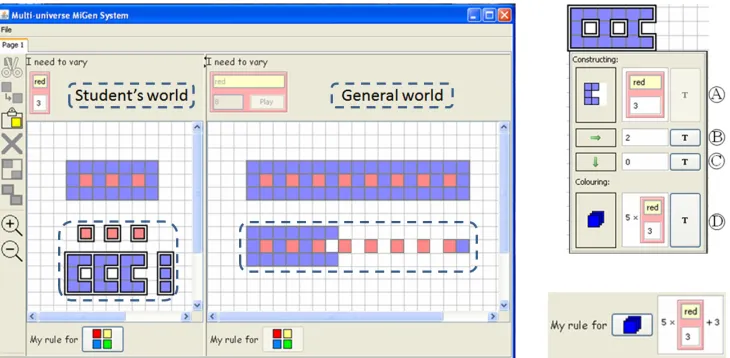
eXpresser(Fig. 2) was designed for classroom use, provid-ing a library of tasks and tools for teachers that enable them to see how students are progressing [30], [31]. Tasks can be set up by the teacher: the students are asked to construct
[image:3.567.312.504.613.711.2]models, i.e. structural descriptions of figural patterns [30] and algebraic rules that correspond to those models.
Fig. 2 illustrates the system, theproperty listof a pattern (i.e. a shape) linked to, and thus dependent on another
Fig. 2.eXpresserscreenshots: (1) left – the toolbar, the student’s world and the general world; (2) top right – the property list of a pattern; (3) bottom right – the corresponding rule. The text and constructions within the dashed lines are added for clarity; they are not part of the interface.
pattern, and a rule. The left screenshot includes: (a) the stu-dents’ world, where the students build their constructions; (b) the general world displaying the same construction with a different value for the variable(s) involved in the task (placed in the area ‘I need to vary’ in both worlds), and where students can check the generality of their construc-tion by animating their pattern (using the Play button). These spaces allow the learner towork on a specific case(in the student’s world)‘with an eye’ on the general(in the general world). Theproperty listof a pattern, i.e. a shape constructed in eXpresser, includes the following properties: iterations, move-right, move-down and colouring; to define a pattern, values need to be given for each property. A pattern can vary in complexity from one tile to the complete model.
We use the task in Fig. 1(a), called stepping-stones, to illustrate one of many ways in which a student could solve this task – see the student’s world in Fig. 2; the structure inside the dashed line rectangle is not displayed by the system in the normal course of the task but it is inserted here to illustrate the components of the construction and how this was created by the student. The student created a red (lighter colour) tile, which is the building-block (i.e. the basic unit of a pattern) for the stepping stones. The property list of a single tile includes the following values:
1 for iterations,0 for move-right,0 for move-down and 1
for colouring. To create the pattern of red tiles the students changed the values in the property list to: 3 for iterations, 2 for move-right (i.e. each tile is places 2 squares after the position of the previous one, including the square where the previous one is placed), 0 for move-down and 3 for colouring. He created a variable for iterations named ‘red’ – for this a T-Box is used, i.e. a representation that allows a variable to be displayed with its name only, its value only or both (as in Ain Fig 3). He also created 5 blue (darker colour) tiles which he grouped to construct a C-shaped building-block and repeated it for the number of times specified by variable ‘red’ (i.e. 3) by dragging the T-box from the iteration property of the red pattern into the iteration property of the C-shape pattern ( A). He specified that each building-block should be placed 2 squares to the right ( B) and 0 squares down ( C), and that 5 times the value of ‘red’ is needed to
colour the pattern ( D). He added 3 blue tiles in a vertical line to complete the construction (a step-by-step illustration of a similar construction is displayed in Table 1, Section 4). He defined the rule 5×red+ 3, by adding the number of tiles in the C-shaped pattern to the number of tiles of the vertical line at the end of the C-pattern, thussimultaneously constructing the model and analysing it.
The multiple representations allowed by T-boxesscaffold the route from numbers to variablesby emphasising that vari-ables represent values, but also, that the values do not need to be known. By using a T-box to define the values of several properties, these properties are made dependent, i.e. when the value in a T-box changes in one property, it also changes in the other one(s). For example, if the student changes the value of variable ‘red’ from 3 to 4, the C-shape pattern will be changed to have value 4 for iterations and value 20 (5×red) for colouring. Through these links/dependencies, a model can be made general. The prominent “T” buttons are due to their importance in creating general constructions and are a result of design studies with pupils and teachers.
The student can animate the model with the Play button, andreflect on his derived expressionsto validate the generality of both the model and the rule. If all the links are present, the model should be displayed correctly for different numbers of stepping stones, as in the top figure in the general world in Fig. 2, where ‘red’ has the value of 8. If in the C-shape pattern the value of 3 was used in place of the ‘red’ variable (i.e. no linking to the red pattern), the model would look like the bottom figure in the general world in Fig. 2, in which only the stepping-stones pattern changes.
The example above is one of many possible solutions. Although in its simplest form the rule is unique, there are several ways to build the model (called strategies) and infer a rule from its components – see Fig. 3. Another task example is pond-tiling, requiring to find the number of tiles to surround any rectangular pond – Fig. 4 shows the task figure and several strategies for this task. This task is more complex, involving two variables rather than one.
Fig. 3. Strategies for the stepping-stones task: (a) forward C; (b) HPar-allel (horizontally parHPar-allel); (c) VParHPar-allel (vertically parHPar-allel); (d) Squares.
Fig. 4. (a) the pattern for the pond-tiling task ; Strategies: (b) ‘Area’; (c) ‘I’; (d) ‘+4’; (e) ‘-4’; (f) ‘Spiral’.
relevant strategies are added to the knowledge base of valid solutions, we developed an approach which is described in [16], [18] and extended in [17].
To distinguish between student solutions and the so-lutions stored by the system, we refer to the former as constructions and the latter as strategies.
4
ANALYSIS
PROCESS: CONCEPTUAL
MODEL
AND
LEARNING
SCENARIOS
This section describes the conceptual model developed based on knowledge about the tasks and the way they can be solved by interacting with the system, and outlines pedagogical scenarios relevant for the learning process.
To illustrate the data generated as users work with
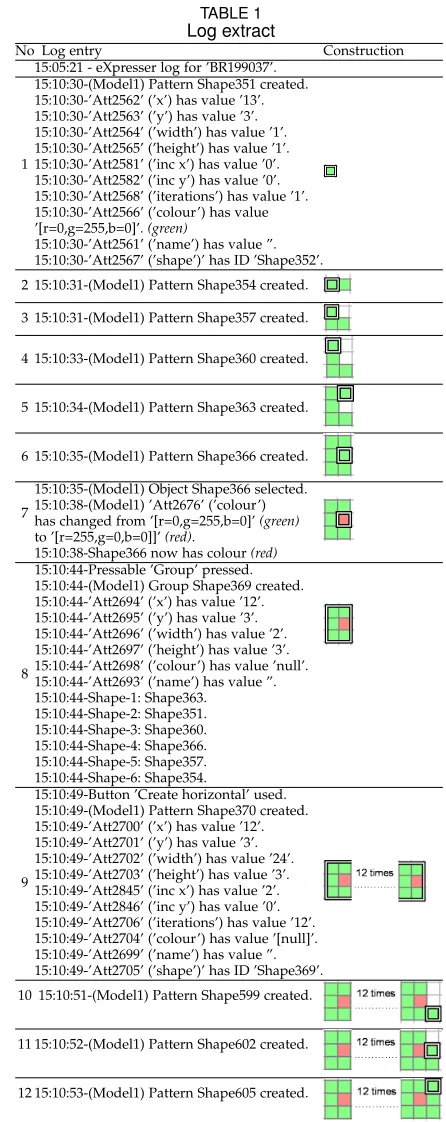
eXpresser, Table 1 presents a log file extract. This is crucial in informing the choice of modelling technique, which must diagnose what the learner is doing based on these data.
[image:5.567.28.277.44.256.2]The table presents the actions of one student when solv-ing the steppsolv-ing-stones task ussolv-ing the ‘forward C’ strategy. The corresponding constructions are also displayed, with the pattern of the current step highlighted; for example, Step 2 includes a construction with two tiles – the leftmost one is highlighted and the corresponding part of the log displays the information logged when that tile is created. To avoid unnecessary repetition, some of the steps for building one tile have only the first line from the log; the log details are similar to the previous steps, with the only variation in IDs of attributes/shapes and values of location coordinates. Steps 1 to 6 and 10 to 12 illustrate simple patterns, i.e. one tile. When a pattern is created, all its attributes are logged: location coordinates (x and y), width, height, ‘move right’ (inc x), ‘move down’ (inc y), number of iterations, colour and name (if one was given to it). Step 7 illustrates the change of an attribute: the colour changed from green to red. Step 8 illustrates a group; the attributes of the group are displayed, as well as the list of shapes that are part of the group. Step 9 illustrates the iteration of a pattern that is a group – the new shape created by repeating the previously created group is logged with all its attributes.
TABLE 1
Log extract
No Log entry Construction 15:05:21 - eXpresser log for ’BR199037’.
1
15:10:30-(Model1) Pattern Shape351 created. 15:10:30-’Att2562’ (’x’) has value ’13’. 15:10:30-’Att2563’ (’y’) has value ’3’. 15:10:30-’Att2564’ (’width’) has value ’1’. 15:10:30-’Att2565’ (’height’) has value ’1’. 15:10:30-’Att2581’ (’inc x’) has value ’0’. 15:10:30-’Att2582’ (’inc y’) has value ’0’. 15:10:30-’Att2568’ (’iterations’) has value ’1’. 15:10:30-’Att2566’ (’colour’) has value ’[r=0,g=255,b=0]’.(green)
15:10:30-’Att2561’ (’name’) has value ”. 15:10:30-’Att2567’ (’shape’)’ has ID ’Shape352’. 2 15:10:31-(Model1) Pattern Shape354 created.
3 15:10:31-(Model1) Pattern Shape357 created.
4 15:10:33-(Model1) Pattern Shape360 created.
5 15:10:34-(Model1) Pattern Shape363 created.
6 15:10:35-(Model1) Pattern Shape366 created.
7
15:10:35-(Model1) Object Shape366 selected. 15:10:38-(Model1) ’Att2676’ (’colour’) has changed from ’[r=0,g=255,b=0]’(green) to ’[r=255,g=0,b=0]]’(red).
15:10:38-Shape366 now has colour(red)
8
15:10:44-Pressable ’Group’ pressed. 15:10:44-(Model1) Group Shape369 created. 15:10:44-’Att2694’ (’x’) has value ’12’. 15:10:44-’Att2695’ (’y’) has value ’3’. 15:10:44-’Att2696’ (’width’) has value ’2’. 15:10:44-’Att2697’ (’height’) has value ’3’. 15:10:44-’Att2698’ (’colour’) has value ’null’. 15:10:44-’Att2693’ (’name’) has value ”. 15:10:44-Shape-1: Shape363.
15:10:44-Shape-2: Shape351. 15:10:44-Shape-3: Shape360. 15:10:44-Shape-4: Shape366. 15:10:44-Shape-5: Shape357. 15:10:44-Shape-6: Shape354.
9
15:10:49-Button ’Create horizontal’ used. 15:10:49-(Model1) Pattern Shape370 created. 15:10:49-’Att2700’ (’x’) has value ’12’. 15:10:49-’Att2701’ (’y’) has value ’3’. 15:10:49-’Att2702’ (’width’) has value ’24’. 15:10:49-’Att2703’ (’height’) has value ’3’. 15:10:49-’Att2845’ (’inc x’) has value ’2’. 15:10:49-’Att2846’ (’inc y’) has value ’0’. 15:10:49-’Att2706’ (’iterations’) has value ’12’. 15:10:49-’Att2704’ (’colour’) has value ’[null]’. 15:10:49-’Att2699’ (’name’) has value ”. 15:10:49-’Att2705’ (’shape’)’ has ID ’Shape369’. 10 15:10:51-(Model1) Pattern Shape599 created.
11 15:10:52-(Model1) Pattern Shape602 created.
12 15:10:53-(Model1) Pattern Shape605 created.
The log illustrates the data available to use for monitor-ing students’ behaviour when solvmonitor-ing a task. This was taken into consideration for the design of the conceptual model, which is presented in the next section.
4.1 Conceptual model
[image:5.567.300.523.45.606.2]patterns. To find the rule corresponding to the model, links between patterns need to be established. Consequently, the construction part of tasks defined in eXpresser can be de-scribed as a series of patterns with relations between them.
Based on this high-level description of tasks and the logged data, a conceptual model was developed to describe at conceptual level the constructions for eXpresser tasks reflecting different strategies. It includes: (a) parts of the constructions, i.e. patterns; (b) properties of each part; (c) relations within and/or between parts (see details in [19]).
Based on the conceptual model, we investigated knowl-edge representations and inference techniques suitable for our aim, i.e. to allow diagnosis even with incomplete con-structions. Case-based Reasoning (CBR) was identified as a good technique, storing only relevant information (from the conceptual model) and being able to diagnose learners even if they have not completed a task (see Section 5).
4.2 Learning Scenarios
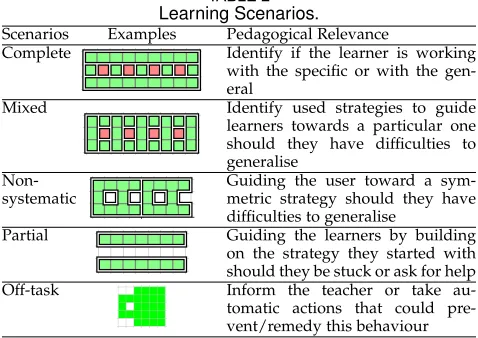
Different user behaviours in learning mathematical gener-alisation were observed in trials with pupils. These were analysed to identify aspects of pedagogical relevance in the ways pupils solve tasks in eXpresser and helped form categories of constructions that we call scenarios– see 1st column of Table 2. Example constructions are shown in column 2 and column 3 provides the corresponding ped-agogical relevance, e.g. appropriate scaffolding. Stepping-stone task examples were used; however, the scenarios were developed based on different tasks.
Complete constructions can indicate if users demon-strate learning behaviours leading to generalisation. In eX-presser learners can build constructions in a specific or a
[image:6.567.32.271.555.724.2]general way. A completely general construction has relations between all its variable parts. For the construction in Fig. 2, the variable parts are: the iterations and colouring of the red pattern, and the iterations and colouring of the C-shape pattern. The necessary relations for a general construction are: (a) the iterations of the red pattern, the colouring of the red pattern and the iterations of the C-shape pattern should be defined by the same variable (called ‘red’ in our exam-ple); (b) the colouring for the C-shape should be 5 times the variable mentioned previously. If none of the variable parts are linked, the construction is specific. If some parts
TABLE 2
Learning Scenarios.
Scenarios Examples Pedagogical Relevance
Complete Identify if the learner is working with the specific or with the gen-eral
Mixed Identify used strategies to guide learners towards a particular one should they have difficulties to generalise
Non-systematic
Guiding the user toward a sym-metric strategy should they have difficulties to generalise
Partial Guiding the learners by building on the strategy they started with should they be stuck or ask for help Off-task Inform the teacher or take au-tomatic actions that could pre-vent/remedy this behaviour
are linked, while others are not, the construction is partly general. Thus, the difference between specific, partly general and completely general is in the presence of relations; no difference can be observed by visually inspecting the construction, but it can be observed by looking at the property lists of the construction components.
We observed that learners first build specific construc-tions and only when completing them they attempt to make them general, especially at the very beginning of an exploratory learning task, i.e. when they are in a “novice state”. Moreover, in practice, after building a specific con-struction pupils find it challenging to create the first link between the components of that construction. Therefore, detecting if the learners are working towards a specific or a general construction is an important feature of the modelling approach, particularly in two situations: (a) when a learner makes the transition or ‘mental jump’ from a specific to a (partly) general construction, so that help with this transition can be provided if needed, and (b) when this transition has been made with at least one element of the construction (depending on the strategy, several parts of the constructions need to be made general), but the learner is unsure and reluctant to proceed without feedback.
When learners work with symmetric, ‘elegant’ construc-tions generalisation is easier as the dependency and value relations are the same for several components, facilitating the transition to an algebraic-like rule. Learners, however, use constructions reflecting mixed strategies, from now on referred to as mixed constructions, and generalisation becomes more difficult due to the added complexity of having, for example, four different expressions in a rule instead of two. Trials with pupils showed that although some learners could generalise from such structures, most learners faced additional difficulties. This relates to the so-called “novice” approach, as pupils with some experience take advantage of symmetry in their construction to gener-alise. Thus, identifying mixed constructions has a threefold pedagogical value: (a) support the learner in deriving a general expression if their arithmetic abilities are good; (b) guide the learners towards one of the strategies that is reflected in their construction if the learners’ arithmetic abilities are low and, therefore, the use of only one strategy will facilitate deriving a general expression; (c) point out that systematic and symmetric approaches are desirable.
Identifying strategies inpartial constructions is impor-tant when learners are stuck or request help. Identifying what strategy the learners are currently working with allows feedback related to that particular strategy, as guiding them towards other strategies has been shown to confuse learners. The last scenario coversoff-task behaviour, as an indi-cator of other issues such as lack of challenging tasks, lack of motivation or disliking of mathematics, the teacher or the system. It is important to detect off-task behaviour as it leads to poor learning [32], [33].
The scenarios could be considered equivalent to “correct solutions”2(i.e. complete general constructions) and several “misconceptions” (i.e. all the other scenarios, except the off-task one). The first three scenarios focus on generalisation and how to address difficulties learners face with this do-main. The fourth one is about helping learners reach one of the first three scenarios, as some learners get stuck at an early stage. The last scenario is about off-task behaviour, which is a problem in many learning systems, but even more so in ELEs due to the freedom of exploration [34].
5
THE MAPPING PROCESS:
REPRESENTATION ANDDIAGNOSIS
This section presents our formalisation for knowledge rep-resentation and the similarity metrics used for identifying the strategies followed by learners in their constructions.
In CBR knowledge is stored as cases, typically including a problem and a corresponding solution [35]. When a new problem is encountered, the case base is searched for sim-ilar cases and the solution is retrieved/adapted from one or more similar cases. The CBR cycle includes four pro-cesses [36]: (a)Retrievesimilar cases to the current situation; (b) Reuse the cases and adapt them to solve the current situation; (c) Revise the proposed solution if necessary; (d)
Retainthe new solution as part of a new case.
Although CBR has been used in a variety of contexts, there is relatively little research using CBR for interactive learning environments. For example, [37] used CBR for legal reasoning, [38] used CBR and genetic algorithms to construct an optimal learning path for each learner and [39] used CBR within a case-based instruction sce-nario. Moreover, there is very little research in the area of CBR for user modelling, in areas such as blood sugar level monitoring [40], management of experience [41] and user context [42]. For learner modelling, CBR was used in combination with a rule-based approach to model learners’ knowledge of programming; this is known as the ELM (episodic learner modelling) approach [43]; also, [44] used CBR in the learner modelling process and called this ap-proach case-based student modelling. To the best of our knowledge, there is no previous work in the area of user modelling for ELEs inspired by Case-based Reasoning.
CBR is employed in our monitoring process as it offers a flexible way to represent knowledge and can cope with uncertainty, e.g. the case structure allows the flexible rep-resentation of knowledge (including missing information)
2. This is the terminology used for a valid solution, although we would describe these as “potential pathways towards a solution”.
and there is no need to obtain a perfect match to identify what the learner is constructing ineXpresser. Unlike typical CBR applications, we use a modified version of CBR to fit our problem. In eXpresser the same problem has multiple solutions and the aim is to identify which one is used by the learner. To address this, each task has a case base of potential pathways towards a solution (i.e. strategies or composite cases). When a learner is building a construction, a sequence of actions is transformed into a sequence of simple cases, with each simple case corresponding to a pattern that is a component of the construction; for example, the construction illustrated in Fig 2 has 5 cases: the red tiles pattern, the C-shape pattern and the 3 individual tiles. This sequence of cases defines the learner’s construction (i.e. a composite case) and is compared with all the strategies in the case base for that task; the case base consists ofcomplete general strategies. To retrieve the strategy that is most similar to the one used by the learner, appropriate similarity metrics are employed, which are described further in this section.
The learner modelling mechanism uses just theretrieve
process of the CBR cycle and could be considered as a form of similarity-based classification; however, other pro-cesses of the CBR cycle are used to identify and store new strategies [16] and to provide adaptive feedback [45]. Con-sequently, for consistency with other work, the learner mod-elling mechanism is reported as a CBR-inspired approach.
The following subsections present the knowledge rep-resentation and the similarity metrics employed to identify the most similar cases from the case base.
5.1 Knowledge Representation
A case is defined as Ci = {Fi, RAi, RCi}, where Fi is a
set of attributes, partly corresponding to theproperty listof a pattern.RAiis a set of relations between attributes andRCi
is a set of relations betweenCiand other cases respectively.
Theset of attributesis defined asFi ={αi1, αi2, . . . , αiN}.
The set Fi includes two types of attributes: numeric and
variables. The variables refer to different string values (i.e. type) that an attribute can take. Some numeric attributes are boolean, indicating whether a case is a group of pat-terns, or can be considered in formulating a particular strategy through a “part of strategy” functionP artOf Su :
Ci → {0,1},P artOf Su = 1ifCi ∈ SuandP artOf Su = 0ifCi ∈/ Su, whereSu represents a strategy and is defined
further on. The complete list of attributes (i.e. 6) that have a type (variable) and a value (numeric) is: width, height, iterations, ‘move left’, ‘move right’ and colour. All except the first two are from the property list of a pattern. The list of attributes for 2 simple cases corresponding to step 1 (one tile) and step 8 (the C-shape) in Table 1 are given in Table 3. The first attribute is the colour, followed by 6 variables storing the types and 6 variables storing the values; next, the values indicate if the case is a group and the membership to strategies. Theset of relations between attributesof the current case and attributes of other cases is represented as
RAi ={RAi1, RAi2, . . . , RAiM}, where at least one of the
attributes in each relationRAim,∀m= 1, M, is from the set
of attributes of the current case Fi. Two types of relations
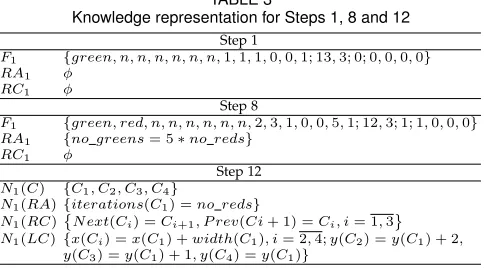
TABLE 3
Knowledge representation for Steps 1, 8 and 12
Step 1
F1 {green, n, n, n, n, n, n,1,1,1,0,0,1; 13,3; 0; 0,0,0,0} RA1 φ
RC1 φ
Step 8
F1 {green, red, n, n, n, n, n, n,2,3,1,0,0,5,1; 12,3; 1; 1,0,0,0} RA1 {no greens= 5∗no reds}
RC1 φ
Step 12 N1(C) {C1, C2, C3, C4}
N1(RA){iterations(C1) =no reds} N1(RC)
N ext(Ci) =Ci+1, P rev(Ci+ 1) =Ci, i= 1,3
N1(LC){x(Ci) =x(C1) +width(C1), i= 2,4;y(C2) =y(C1) + 2, y(C3) =y(C1) + 1, y(C4) =y(C1)}
Adependency relation(Dis) is defined as(αik, αjl) ∈ Dis ⇔ αik = DEP(αjl), where DEP : αik → αjl for αikandαjlwhich are attributes of casesiandj(wherei=j
or i 6= j). This means that αik depends onαjl (if i = j, k 6= l is a condition to avoid circular dependencies) (e.g. the number of iterations of a case is linked to the colouring of another case). The dependency relations are defined by the learners through the use of T-boxes. A value relation
(Vis) is defined as (αik, αjl)∈Vis ⇔ αik =f(αjl), where αikandαjlare numeric attributes andfis a (linear) function
and could have different forms depending on context (e.g. the iterations of a case arextimes the iterations of another case). For the examples in Table 3, the case corresponding to Step 8 has a value relation refining the number of green tiles (the C-shape) as 5 times the number of red tiles.
The set of relations between cases is represented as
RCi = {RCi1, RCi2, . . . , RCiP}, where one of the cases
in each relation RCij,∀j = 1, P is the current case (Ci).
The relations between cases are defined based on time; therefore, two time-relations are used: P rev and N ext. A
P revrelation indicates the previous case with respect to the current case, while aN extrelation indicates the next case with respect to the current case.
Astrategyis defined asSu={Nu(C),Nu(RA),Nu(RC),
Nu(LC)},u=1, r, whereNu(Ci)is a set of cases,Nu(RAi)
is a set of relations between attributes of cases, Nu(RCi)
is a set of relations between cases, and Nu(LC) is a set
of location constraints. These location constraints have the following form:xCi=f(xCj)andyCi=f(xCj), wherexand yare location coordinates,f andgare linear functions, and
Cjis areferential case(a reference for other cases).
The knowledge representation evolved from previous work [13], [16], [46], [47]. Examples of translating learners’ actions into formal definitions are given in Table 3 for Steps 1, 8 and 12 of the log shown in Table 1: a simple case (not a group), a simple case that is a group, and a composite case (a user construction). The construction (Step 12) includes indi-vidual simple cases, their relations and location constraints.
5.2 Similarity metrics
In CBR, retrieval is usually based on some metric that assesses the closeness between cases [35]. Typically, the attributes in the cases are numeric and therefore metrics for numeric data are used. In our situation, the cases include different types of data, each with different impact on the similarity between cases. For case retrieval, four similarity measures are defined:
(a) Numeric attributes - Euclidean distance: DIR = q
Pw
j=v+1×(αIj −αRj)
2(IandRstand for input and
retrieved cases, respectively); (b) Variables:VIR =P
v
j=1g(αIj, αRj)/v, wheregis defined
as:g(αIj, αRj) = 1ifαIj =αRj andg(αIj, αRj) = 0if αIj 6=αRj.
(c) Relations between attributes- Jaccard’s coefficient:AIR =
|RAI∩RAR|
|RAI∪RAR|. AIR is the number of relations between
attributes that the input and retrieved case have in com-mon divided by the total number of relations between attributes of the two cases;
(d) Relations between cases - Jaccard’s coefficient: BIR =
|RCI∩RCR|
|RCI∪RCR|, where BIR is the number of relations
be-tween cases that the input and retrieved case have in common divided by the the total number of relations between cases ofIandR.
To identify the closest strategy to the one employed by a learner, cumulative similarity measures are used:
(a) Numeric attributes - as this metric has a reversed mean-ing compared to the other ones, i.e. a smaller number means a greater similarity, the following function is used to bring it to the same meaning as the other three similarity measures, i.e. a greater number means greater similarity:F1 =z/P
z
i=1DIiRi if
Pz
i=1DIiRi 6= 0and F1=zifP
z
i=1DIiRi = 0;
(b) Variables:F2= (Pzi=1VIiRi)/z;
(c) Relations between attributes:F3= (P
z
i=1AIiRi)/y;
(d) Relations between cases.F4= (P
z
i=1BIiRi)/z.
where zis the minimum number of cases (from the user’s construction and the stored strategy) andyis the number of cases inRthat have relations between attributes.
The use of heterogeneous metrics [48] is justified for two reasons: (a) different types of data, i.e. numeric, string and sets, call for different metrics and (b) the four cate-gories (numeric, variables, relations between attributes and relations between cases) are valuable for providing per-sonalised feedback, e.g. if the learner needs to work on the structure of the strategy or on the relations between patterns. The overall similarity metric for strategies is:
Sim=w1∗F1+w2∗F2+w3∗F3+w4∗F4, whereF1is
the normalised value ofF1. To bring F1 in the same range
as the other metrics, i.e. [0,1], we applied linear scaling to unit range [49] using the functionF1=F1/z.
Weights are applied to the four similarity metrics to express the central aspect of the construction, thestructure. This is mostly reflected by the F1 metric and to a lesser
degree by the F3 metric as the structure of a
construc-tion is also reflected in the relaconstruc-tions between attributes of component cases. The other two metrics (F2 and F4),
although important for the generality of construction and the order of cases, respectively, have less impact on the structure. Therefore, the values of weights were set as fol-lows: w1 = 6, w2 = 1, w3 = 2, w4 = 1. This leads to the
range of[0,10]for the values ofSim.
6
VALIDATION OF THE MODELLING MECHANISM
various types of exploratory learning behaviour; (b) experts’ evaluation to compare the performance of the modelling mechanism with the diagnosis from several domain experts. The low-level validation focuses on the learner mod-elling mechanism rather than the entire system, as our aim is to evaluate the correctness of learner diagnosis, which is not visible to the learners, rather than the feedback (based on the diagnosis), which is visible to the learners. In an evaluation of the whole system, if problems arise with regard to feedback, it would not be possible to establish if those problems arise from a faulty diagnosis or from other issues such as feedback content, form or timing. Thus, the two need to be evaluated separately. Consequently, here we present the validation of the diagnosis mechanism.
Unknown test data were used from two classroom ses-sions using eXpresser to solve the stepping-stones task, in a secondary school in London. There were 18 Grade 7 students (11-12 years old) in each session (the same students took part in both sessions) who were previously familiarised with an earlier version of the software [50]. In addition, data from several smaller studies with 2 to 5 pupils working on the pond-tiling task were used. In total, 19 pupils partici-pated in these studies; they were Grade 7 and 8, and 11 to 13 years old. In both the classroom sessions and the smaller studies, the students spent 40 to 50 minutes on the given task. The 36 logs from the 2 classroom sessions and the 19 logs from the smaller studies were used to test the strategy diagnosis for the scenarios outlined in Section 4.2: gen-eral/partly general/specific complete,mixed,non-systematic, andpartialconstructions, andoff-taskbehaviour.
As only one student had a partial construction by the end of the session, to increase the data available for testing
partial constructions, the complete constructions logs were used to extract “intermediate constructions”. We chose two snapshots from 18 user complete construction employing each of the stored strategies of the 2 tasks, i.e. 8 for stepping-stones and 10 for pond-tiling (more details in the following section). For all other scenarios, each log/construction was assigned exclusively to one scenario.
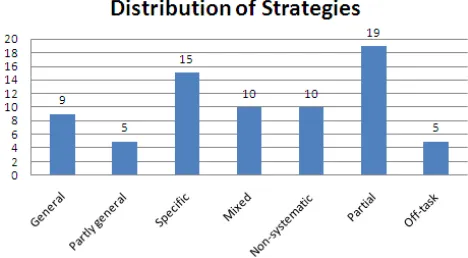
The constructions from the logs were labelled with the most similar strategy by one expert who watched the screen capture for each of the constructions that were used for testing. In the case of mixed strategies, the expert labelled the construction with all the strategies that were relevant for the particular construction and ranked them in order of similarity. For example, a construction of the stepping-stones task that had elements of the ‘HParallel’ and ‘VParal-lel’ strategies had both labels and the expert specified which of the two strategies was most similar; if the expert consid-ered that the 2 strategies were equally represented in the construction, ‘equally similar’ was used. The same process was applied if elements from more than 2 strategies were present in a construction. The labels (distribution in Fig. 5) were compared with the output of the strategy identification mechanism; the results are presented in Section 6.1.
[image:9.567.297.531.49.178.2]In addition, we presented five experts with a selection of constructions from the user studies reflecting situations that are difficult to diagnose. For each user construction, the experts were asked to rank three strategies in the order of
Fig. 5. Distribution of strategies according to the expert.
similarity to the user’s construction. These rankings were then compared with the outputs of the modelling mecha-nism; details and results are presented in Section 6.2.
6.1 Identification of strategies
This section presents the results on strategy diagnosis for the scenarios described in Section 4.2. For each category, one or more examples are presented and discussed, and statistics for all tested constructions are given.
Complete constructions.These refer to complete construc-tions built using one of several strategies. They could be
specific, general or partly general. The similarities between specific and general user constructions for the stepping-stones task and stored (general) strategies are shown in Table 4 – the rows are the student solutions (as labelled by the expert), the 1st column is the number of students per solution and the rest of the columns are stored solutions.
The similarity values are between 1 and 10. A perfect match is obtained for a complete general strategy: 10 when the strategy has at least 2 cases; 9 when the strategy has just one case, as in the ‘Squares’ strategy (due to no relations between cases which has a maximum value of 1). Generally, complete specific constructions have values greater than 8, and complete partly general strategies have values between 8 and 10 (depending on the number of cases in the strategy and the number of relations between them). The bold num-bers in Table 4 indicate high similarities for specific complete construction (values grater than 8) and perfect similarities for complete and general constructions (values of 10 and 9). All general (9), partly general (5) and specific construc-tions (15) were identified successfully by the CBR approach. Complete constructions (specific, partly general and gen-eral) are easy to identify due to their structure; consequently, the identification is successful in all cases.
Mixed constructions.For the stepping-stones task, only one student built a mixed construction and did not generalise it (no links between components) – see Fig. 6 and the
TABLE 4
Similarity metrics for complete constructions of stepping-stones task.
Constructions Freq. Forward C HParallel VParallel Squares Forward C specific 3 9.33 2.18 2.33 1.66 Forward C general 1 10.00 2.51 2.83 2.66 HParallel specific 2 2.18 9.33 2.34 1.34 HParallel general 1 3.18 10.00 3.34 2.34 VParallel specific 2 2.33 2.34 9.33 1.48 VParallel general 1 3.33 2.84 10.00 2.48 Squares specific 1 1.66 1.34 1.48 8.33
Fig. 6. Combination of VParallel and HParallel strategies. TABLE 5
Similarity of the construction in Fig. 6 to stored strategies
Forward C HParallel VParallel Squares Fig. 6 construction 2.28 2.37 3.14 1.48
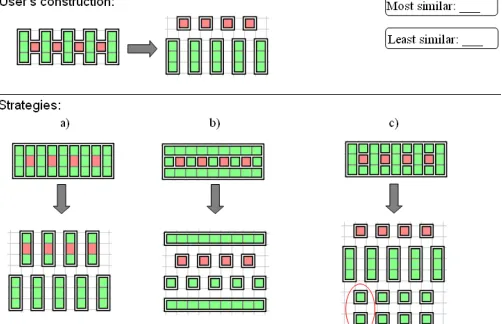
Fig. 7. Mixed constructions with: (a) three strategies (‘H’, ‘+4’ and ‘Spiral’; (b) 2 strategies (‘+4’ and ‘I’), of which one is dominant (‘+4’); (c) 2 strategies equally similar (‘Spiral’ and ‘H’).
similarity metrics in Table 5. The construction is adequately identified as most similar to the ‘VParallel’ and ‘HParallel’ strategies. On one hand, one could argue that this approach is a solution in its own right. On the other hand, this solution is not optimal, as some components of the construction can be combined to achieve a more simple and elegant solution. Simple, as well as elegant or systematic approaches, are easier to generalise. This aspect is further discussed under the following scenario, i.e. non-systematic strategies.
Nine mixed constructions from the pond-tiling task were also tested and correctly identified. Six of the nine construc-tions combined 2 strategies, while three had elements from 3 strategies. Three of the six constructions that mixed 2 strategies had a dominant strategy, while three were equally similar to both strategies (see Fig. 7).
Non-systematic constructions.Learners sometimes use ‘bits and pieces’ in their constructions, making generalisation more difficult. They may start with such an approach and gradually move towards a more systematic one; however, they do not always replace all the ‘bits and pieces’ they started with – see Fig. 8a; the overall approach corresponds to the ‘HParallel’ strategy, but the top row of green tiles is composed of ‘bits and pieces’: one row of six tiles plus one tile; also, the row of six tiles is composed as a group of three tiles repeated twice – see the property list in Fig. 8b.
For the student whose construction is presented in Fig. 8a, the values of the similarity metric with respect to stored strategies are shown in Table 6. The maximum value reflects the similarity in structure to the ‘HParallel’ strategy; however, the low value indicates the construction has parts that do not entirely correspond to the ‘HParallel’ strategy.
All 10 tested non-systematic constructions had a ‘dom-inant’ strategy with only one or occasionally two compo-nents of the construction built in a non-systematic way and all were identified as most similar to a stored strategy.
Partial constructions. For each strategy two partial con-structions are illustrated in Fig. 9, corresponding to different stages in the building process. They are essentially snap-shots of learners’ constructions at different points in time, where the first snapshot, corresponding to version 1 is taken fairly early (and contains one component), while the second
Fig. 8. Construction with non-systematic parts: (a) the structure of the construction; (b) the property list of the top component.
TABLE 6
Similarities of the construction in Fig. 8 to stored strategies
Forward C HParallel VParallel Squares Fig. 8 construction 2.09 4.31 2.30 1.32
one, corresponding to version 2, is taken later, but before the learners have completed the construction (and contains two or three components). The purpose is to test the metrics in relation to how early they can reliably detect similarity to a particular strategy. The metrics are displayed in Table 7.
The construction in Fig. 9e has a low similarity to all stored strategies, as it could be the starting point for three of them: ‘forward C’, ‘HParallel’ and ‘VParallel’. Table 7 shows that ‘forward C’ and ‘HParallel’ strategies have a higher similarity than the ‘VParallel’ strategy. On the other hand, the similarity metrics show very close values for all strate-gies, which could be an indication that with the available information no strategy can be considered most similar to the learner’s construction. Consequently, an assessment of learners’ constructions should not be made too early and if help is requested at such an early stage, the students should be encouraged to continue with building the construction.
To assess the likelihood of identifying the strategy the learners are working with at different stages in their par-tial constructions we used 24 parpar-tial strategies from the stepping-stones task and 71 from the pond-tiling task. These constructions were extracted from the logs and represent in-stances of constructions at different time steps. We used
con-Fig. 9. Partial strategies: (a) partial forward C v1; (b) partial forward C v2; (c) partial HParallel v1; (d) partial HParallel v2; (e) partial VParallel v1; (f) partial VParallel v2.
TABLE 7
Similarities of the construction in Fig. 9 to stored strategies
Fig. 10. Average probability of identifying a dominant strategy from partial constructions with 1, 2 and 3 components.
structions with one component3(7 from the stepping-stones
task and 21 from pond-tiling), two components (10 from stepping-stones, 30 from pond-tiling) and three components (7 from stepping-stones and 20 from pond-tiling). Similarity metrics were computed for all partial constructions and the probability of identifying a unique ‘dominant’ strategy was calculated as follows. If a construction is most similar to a strategy, the probability is 100%; if the construction is equally similar to two strategies, the probability is 50%, and so on. A construction was considered similar to a strategy if the similarity metric had a value higher than 3.50, which was identified as a minimal value for indicating structural similarity [17], [47]. The average probabilities per number of components in the partial constructions (one, two or three) for the two tasks, as well as overall, are displayed in Fig. 10. Fig. 10 shows that the more components a construction has, the easier it is to identify its most similar strategy. A construction with one component can be identified in some cases, with a higher probability for constructions with a lower number of components per strategy (as for stepping-stones) than for constructions with a higher number of com-ponents per strategy (as for pond-tiling). Similarly, when a construction has two components, the probability is higher, with the same tendency as for one component. From three components onwards the strategy is identifiable in all cases. Consequently, 2 components can be used as the minimum requirement for applying the identification mechanism.
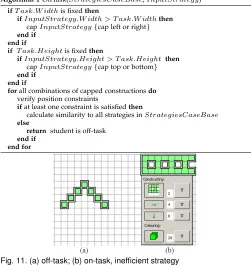
Detecting off-task exploratory behaviour.The case base of solutions and a rule-based approach are used to identify off-task behaviour. Two sources of information are used: (a) the characteristics of the task in terms of variations of width and height, and the relation between them, if any, and (b) the relative position of patterns. The information about the task acts as a valuable filter when random tiles are left on the pattern construction area along with a construction that is related to the task. For example, in the stepping-stones task these characteristics are: height is three, width can vary, with a minimum of three, and there is no particular relation between the height and the width. The relative positions are mapped to the position constraints of the stored strategies and if there is at least a partial correspondence, the similarity metrics are calculated. If there is no correspondence, no met-rics are computed. Algorithm 1 formalises this approach.
3. this excludes the pond component for the pond-tiling task, as the pond is present in all strategies and all students started their constructions with the pond
Algorithm 1OffTask(StrategiesCaseBase,InputStrategy)
ifT ask.W idthis fixedthen
ifInputStrategy.W idth > T ask.W idththen
capInputStrategy{cap left or right} end if
end if
ifT ask.Heightis fixedthen
ifInputStrategy.Height > T ask.Heightthen
capInputStrategy{cap top or bottom} end if
end if
forall combinations of capped constructionsdo
verify position constraints
ifat least one constraint is satisfiedthen
calculate similarity to all strategies inStrategiesCaseBase
else
return student is off-task
end if end for
Fig. 11. (a) off-task; (b) on-task, inefficient strategy
We use an off-task example observed in the second classroom session, and compare it with a behaviour which, although on-task, is inefficient in terms of its generalisation potential – see Fig. 11. The construction in Fig. 11b looks very much like the ‘forward C’ strategy, but it is constructed from a group of ten individual tiles that are repeated twice which makes it difficult to generalise. Nevertheless, unlike the construction in Fig. 11a, this construction is task-related. From the construction in Fig. 11a two different construc-tions can be obtained by filtering out the top or the bottom row to satisfy the ‘height equals 3’ characteristic; these two constructions do not map the position constraints of any stored strategy. Therefore, using both sources of informa-tion the algorithm outputs that the learner is off-task. The height of the construction in Fig. 11b corresponds to the task characteristics and the relative positions of the patterns partly map the position constraints of two strategies. Thus, the similarity metrics are computed and ‘forward C’ is identified as the most similar strategy.
We also tested four off-task constructions from the pond-tiling task. These occurred after the students finished their task constructions and were ‘playing’ with the system. The algorithm labelled all these constructions as off-task.
6.2 Experts’ evaluation
[image:11.567.31.274.50.169.2]Fig. 12. Example of a group of a user’s construction and three strategies that was presented to the experts.
Fig. 13. Squares strategy with a typical mistake of 2 green tiles (instead of one) between the red tiles.
experts, academics and teachers, had expertise in mathe-matical generalisation and were familiar witheXpresser; the authors were not among the experts in this study.
Five experts were involved, evaluating between them 25 groups: 12 from the stepping-stones task (five experts) and 13 from the pond-tiling task (four experts). One expert for the stepping-stones task disagreed with the others in 5 out of 12 cases. This expert did not provide an answer for 3 of the groups and was the least familiar witheXpresser. We would argue that the answers of this expert should be considered as outliers and eliminated from the analysis; however, we report the results with and without this expert.
The experts’ answers were compared with the output of the modelling mechanism. Indicators of agreement were calculated for the following categories: mixed (7 groups), non-systematic (5), partial (9) and wrong (4). The last one includes constructions with typical mistakes for particular strategies, e.g. the ‘Squares’ strategy of the stepping-stones task with 2 green tiles (instead of one) between the red tiles (see Fig. 13). These are special cases of non-systematic con-structions as the mistakes introduce distortions to the struc-ture – they are associated with particular misconceptions and could be used for generating more specific feedback. Consequently, they are reported as a different category.
[image:12.567.27.278.50.212.2]We calculated two agreement indicators: percent agree-ment and Fleiss’ kappa [51]. We used 0/1 coding: 0 indicates the expert disagreed with the strategy identification output and 1 indicates the expert agreed with it. This was applied for all experts and all groups (25). The percent agreement is an average of all pairwise percent agreements, i.e. it is calculated for each pair of experts and then averaged (e.g. for 4 experts there are 6 pairs which are averaged). This indicator does not account for agreement by chance, potentially leading to overestimations. For this reason we also report Fleiss’ kappa, as this indicator accounts for it. Values above 90% for percent agreement and above 0.8 for Fleiss’ kappa indicate that the results are reliable.
TABLE 8
Agreement indicators per category
Mixed Non-systematic Partial Wrong Overall All (5) experts % agreement 80% 67% 79% 84% 78%
Fleiss’ kappa 0.63 0.334 0.48 0.87 0.58
[image:12.567.288.542.53.156.2]4 experts % agreement 100% 60% 94% 100% 90% Fleiss’ kappa 1 0.52 0.84 1 0.83
Fig. 14. Non-systematic construction with ‘bits and pieces’ and structure that could belong to several strategies.
The indicators in Table 8 for the 4 experts show that the results are reliable for all categories, except non-systematic constructions. This is not surprising, as non-systematic con-structions have some structure, but also ‘bits and pieces’ distorting that structure and making it more difficult to identify a dominant strategy. From the 5 groups, all experts agreed with the strategy identification output only on one group; for two groups, 2 experts agreed and 2 disagreed and for the remaining two, 1 expert agreed and 3 disagreed. The difficulty lies in identifying a strategy when parts of the construction could belong to several strategies – see an example in Fig 14. The construction has elements of ‘H’, ‘I’ and ‘+4’ strategies. The output of the strategy identification is that the ‘H’ strategy is the most similar with a value below 3.5; however, the values for the other two strategies are very close. This is a similar situation to the partial constructions when it is too early to identify a ‘dominant’ strategy.
7
DISCUSSION
The validation results indicate the CBR-inspired model is able to identify situations of pedagogical importance, such as working in a specific or a general way, working with several strategies at one time, working with non-systematic approaches, having partial constructions and going off-task. This shows that, despite the challenges raised by the nature of interaction in ELEs [52], monitoring learners’ activity and identifying particular situations that carry pedagogical meaning is possible. Moreover, learner diagnosis is possible
during the process of solving a task rather than at the end, opening possibilities for more effective personalised intelligent support.
Our approach assesses a student’s construction in term of the closeness to one of many solutions, rather than identifying the step in the solution and its corresponding feedback. The key difference is the lack of steps, i.e. there is no explicit model of the solution space defining the steps towards a solution.
Instead of relying on a detailed knowledge model of a problem domain, or on static constraints [53], the case-based system is able to utilise the knowledge of past problem situations or cases, represent solutions quality implicitly in cases, adapt cases to new experiences, or add new cases to accommodate new problems. CBR can produce good
quality solutions in areas where it is not possible to model the knowledge domain or the constraints completely or consistently, or when features affecting solutions quality are difficult to formalise. Thus our approach instead of modelling constraints, for example, identifies what rela-tions or structural properties are missing from a student’s construction by comparing it to several possible solutions. This comparison identifies the aspects to give feedback on, which, at the conceptual level, share analogy with the constraint-based approach to feedback provision. However, the proposed case-based system can interpret open-ended and ill-defined student constructions.
Previous educational applications employing CBR used it as a way of selecting relevant examples (e.g. [39], [54]) that may help students solve the current problem. In contrast, our CBR-inspired approach is used for learner diagnosis, i.e. to identify what approach the learner is using from a number of options. In this sense, our approach is driven by domain-specific knowledge, unlike [23] and [55], who focus on a data-driven approach to user modelling for supporting exploration in Massive Open Online Courses (MOOCs). While the data-driven approach may be suitable for MOOCs, our approach was designed for 11 to 14 year old students with the purpose of addressing particular known issues in the domain of mathematical generalisation.
Our work also addresses other issues generally encoun-tered in exploratory learning environments such as inactiv-ity, working with the right variables, interpretation of data and generalisations.
As learners’ actions are monitored continuously, inactiv-itycan be easily detected. A further assessment of the stage within a task when inactivity occurs could indicate its possi-ble causes, e.g. if the learner built a specific construction and then is inactive, two causes are likely: (a) the learner does not know what to do next in terms of the requirements of the task; (b) the learner understands that the next step is to generalise his/her construction but does not know how to do it. The former is a conceptual problem, while the latter is pragmatic: knowing what one needs to do, but not knowing how to do it using the tools of the system. If the learner is inactive from the very beginning, it is very difficult to infer any possible causes. Other reasons for inactivity may be linked to motivation [56] and attitudes to subject matter [57]. Our strategies definition makes it possible to detect if the students are choosing theright variablesto works with. For example, in the ‘forward C’ strategy of the stepping-stones task, there are one or more “correct” – or rather useful – variables: the number of iterations of the C-shape pattern and the number of colour allocations for the red tiles.
Interpretation of data in exploratory learning is associ-ated with experiments: by looking at the various results of several experiments the students are to accept or re-ject a hypothesis. For eXpresser, the high level hypothesis corresponds to the algebraic-like rule the learners need to find, which is built from the relations between patterns; the interpretation of data corresponds to observing changes in their construction when they vary the values of the patterns’ properties, and the effects of their changes on the algebraic-rule, i.e. is the rule still valid or not? Moreover, lower
level hypotheses are tested before extracting the algebraic-like rule, when the learners are ‘figuring out’ the relations between patterns that lead to constructions that ‘looks right’, in which case the hypotheses correspond to the relations between patterns. For example, learners may test numerical relations such as ‘for a stepping-stones of 3 red tiles I need 4 iterations of the vertical bar of 3 green tiles’ for the ‘VParallel Strategy’ (Fig. 3c) or general relations such as ‘the iterations of the vertical bar of 3 tiles need to be the number of red tiles plus 1’ for the same strategy. This is tightly related to
generalisation. The monitoring mechanism can identify if the learner’s construction is specific, general or partly general, thus allowing personalised feedback related to interpreta-tion of data and generalisainterpreta-tion.
Although it has limitations, the monitoring mechanism can detect off-task and inform the teacher who can take finer-grained decisions depending on whether the learner is really off-task or just off-track. This information can be given to the teacher through a visualisation tool such as the one in [58]. The off-task detection could be improved by incor-porating in the algorithm other factors such as the colours used in the construction, the number of cases in the learner’s construction with respect to the minimum and maximum number of cases of the stored strategies for that task, and the speed at which the cases are constructed. For example, if a learner is quickly building many ‘bits and pieces’ of many different colours (as opposed to fewer colours in the task specification), the learner may be constructing something for their own amusement rather than for solving the task.
A limitation of our approach, which is common in ELES, is its dependency on the activity of the learner. A construction of at least 2 components, as suggested by our experiments with partial constructions (Section 6.2), is needed to infer what strategy the learner is using, if a learner works with the specific or the general and if a learner is off-task. Although inactivity can be detected, its causes are difficult to find without a minimal construction.
Currently, the similarity metric for strategies has fixed weights that maximise identification of structural similarity; however, depending on the stage within a task, these could vary to maximise identification of other aspects such as the generality of construction. This is part of our future work, along with Open Learner Models, as reflection is an important part of discovery learning [7] and the open learner models have been shown to encourage it [59].
This paper focused on the development and validation of the user modelling component of a more complex sys-tem. Trials with the latest version of the system evaluated students’ learning and showed that students developed an understanding of structural reasoning and learned how to explicitly express relationships [30]. Also, after 3-4 lessons using eXpresser, students were able to apply mathematical generalisation knowledge to conventional tasks [30], [31].