A Framework for Qualifying and Evaluating Smart Grids
Approaches: Focus on Multi-Agent Technologies
Gillian Basso, Nicolas Gaud, Franck Gechter, Vincent Hilaire, Fabrice Lauri
IRTES-SET, UTBM, Belfort Cedex, France.
Email: [email protected], [email protected], [email protected], [email protected], [email protected]
Received November 19th, 2012; revised January 2nd, 213; accepted January 14th, 2013
Copyright © 2013 Gillian Basso et al. This is an open access article distributed under the Creative Commons Attribution License, which permits unrestricted use, distribution, and reproduction in any medium, provided the original work is properly cited.
ABSTRACT
New needs and emerging societal constraints have put the emphasis on the inadequacy of the actual electrical grid. In-deed, it is impossible, or at least very hard, to 1) integrate renewable energy sources at a great scale within the actual electric grid, 2) enable communications between the various power suppliers and consumers, 3) design several different services that meet the needs of a wide range of end users. A key solution to these issues consists in using Smart Grids (SG). SG can efficiently control power flows by means of Information Technology (IT). Technically, a SG consists of a power system and a bidirectional communication system. Multi-Agent Systems (MAS) constitute a possible technology that can be applied to control and monitor the operation of power grids. Moreover, MAS exhibit distribution, adaptive and intelligent features. The goal of this paper is to propose a framework of qualification and evaluation for comparison SG approaches. First, a set of features of importance for smart grids definition is identified. Then, in a second step, some criteria are given to evaluate the impact of SG on the society. Finally, these features are applied to existing MAS approaches addressing SG in order to understand and compare their different contributions.
Keywords: Smart Grids; Qualification and Evaluation; Multi-Agent Systems
1. Introduction
Nowadays, a paradigm shift occurs within energy sys-tems [1]. New needs and constraints emerge, such as: reduced carbon dioxide emissions, greater introduction of renewable energy, diversification of power transactions, etc. These new needs and constraints have put the em-phasis on the inadequacy of the actual electrical grid. Indeed, it is impossible, or at least very hard, to 1) inte-grate renewable energy sources at a great scale within the actual electrical grid, 2) allow communications between the various power suppliers and consumers, 3) design several different services that meet the needs of a wide range of end users.
A key solution to these issues consists in using Smart Grids (SG). SG can efficiently control power flows by means of Information Technology (IT), integrating not only the supply side but also the demand side and all the devices that allow the distribution of power. Technically, a SG consists of a power system and a bidirectional communication system. It mainly focuses on applying IT to the distribution and customer sides.
As defined in [2] smart grid is the term commonly
used to refer to an electrical grid whose operation has been transformed from a twentieth-century analog tech- nology based on the pervasive use of digital technology for communications, monitoring (e.g. sensing), computa- tion, and control.
Emerging smart grid technology allows for fine- grained sensing and control. This enables highly flexible, efficient, and optimized operation, including full support for market-based, demand-side management and the ac- commodation of alternative generation sources, including sources of consumer-generated electricity. A smart grid is defined as having the following seven principal char- acteristics, as specified by the US Department of Energy’s National Energy Technology Laboratory in its modern grid strategy [3]. A smart grid:
enables active consumer participation
accommodates all generation and storage options enables new products, services, and markets provides power quality for the digital economy optimizes asset utilization and operates efficiently anticipates and responds to system disturbances operates resiliently against attack and natural disaster
document European Smart Grids Technology Platform- Vision and Strategy for Europe’s Electricity Networks of the Future [4].
Over the past ten years, many research projects have addressed the smart grids and the number of projects tackling smart grids increases every year.
The goal of this paper is to propose a framework of qualification and evaluation for a comparison of every approach for smart grids. The evaluation and comparison are based on the feature analysis approach [5]. First, a set of features of importance for smart grids is identified and defined. Then, in a second step, criteria is given to evalu-ate the impact of the grid on the society. Finally, these features are applied to existing MAS approaches ad-dressing smart grids in order to understand and compare their different contributions. Among the heterogeneous approaches, some are based on the Multi-Agent Systems (MAS) paradigm. MAS are a good candidate to model and implement the intelligent components of a smart grid as they exhibit autonomy, reactivity, pro-activeness and collaborative capabilities [6,7]. A workshop dedicated to agent-based approaches for energy systems (ATES) has even been created as a forum of discussion for this re- search since 2010. That is why authors decide to com- pare only MAS approaches.
This paper is organized as follows: Section 2 presents an overview of an evaluation framework for smart grids, Section 3 details the qualification framework, Section 4 presents the evaluation framework and Section 5 pro- vides a study of the main multi-agent approaches for smart grids.
2. Evaluation Framework Overview
Significant investments have been made, especially in European Union and United States, in order to develop, demonstrate and deploy smart grids technologies. Some recent works are trying to assess the costs, performance and benefits of smart grid technologies. There is cur-rently no established standard in this area. Among the recent initiatives, we may notably mention:
The 2nd EU-US workshop1 on Smart Grid
Assess-ment Methodologies jointly organized by the Joint Research Centre and the Department of Energy on the 7th of November 2011 in Washington DC.
The Evaluation Framework for Smart Grid Deploy-ment Plans [8].
The smart grid scorecard2 that provides a listing of
the required features a product must have to be com-pliant with a smart grid.
The incentives to determine reliable metrics, costs, and benefits from projects related to smart grids, like in [9] and [10].
The present article is part of this effort by providing an evaluation framework. The study focus on multi-agent approaches for smart grid. Though we decided to study multi-agent approaches for expertise reasons, it is worth noting that the proposed evaluation framework could also be used for approaches belonging to any other para- digms.
In the following two sections, we define a framework that decomposes the analysis and the comparison of smart grids into two steps. The first step aims at position- ing the evaluated approaches and understand them. This step is divided into two dimensions:
Structural dimension represents the physical
infra-structure of the smart grid. Family problem dimension
defines the different classes of problems solved by the smart grid.
The second step, aims at evaluating quantitatively and qualitatively the different approaches by assessing the societal impacts of these approaches. The proposed crite-ria for evaluating the societal impacts are defined ac-cording to the main challenges of smart grids3:
Greenhouse gas reduction: How to reduce the carbon
footprint of the overall supply chain? (addressed by En-vironmental dimension of the proposed framework)
Energy security: How to increase the network’s
ca-pacity in order to manage a potentially diverse set of new requirements? How to provide interruption-free reliable power accommodating all generation and storage options, especially wind and solar power? (addressed by Struc-tural and QoS dimensions)
Economic competitiveness & affordability: How to
cost-effectively transition to a low-carbon energy system, increasing affordability? How to enable the new products, services, and markets through a flexible market to pro-vide cost-benefit trade-offs to consumers and market participants? (addressed by Economic dimension)
Human integration: How to enable the consumers to
actively participate by providing them with the choices and the incentives to modify their electricity purchasing patterns and behaviors (Smart metering, Advanced Me- tering Infrastructure)? (addressed by Human dimension) For each of these challenges a set of indicators is pro- posed. It is not always possible to test each approach with every indicator or to obtain resources from the lit- erature that provide results of such analysis.
3. Qualification Framework Definition
In the following, the different aspects of the framework are defined. These aspects are composed by the first (qualification) and second (evaluation) steps. The first step is detailed through two viewpoints or dimensions (structural and family problems) and the second step is 1See http://ses.jrc.ec.europa.eu/node/69
detailed through the societal dimension. A list of criteria (written in bold face) is presented thereafter for each di- mension (structural and family problem) with the corre- sponding definitions and explanations.
3.1. Structural Dimension—Industry Focus
The structural dimension defines the energy infrastruc- ture of the smart grid. The energy infrastructure consists of two highly-interrelated and complex systems: the en- ergy physical network and the energy market [11]. These two systems and their relationships are precisely describ- ed by the ontology in [12].
First, we briefly explain the main concepts of the elec- tric power delivery system described in the ontology.
Second we highlight questions must be answered for completely describing a power grid.
The producers are responsible for generating energy. The transmission system operators are responsible for operating the transport of energy on the high-voltage interconnected system, called the transmission net-work, in order the ensure long-term services, like the balance of supply and demand, for instance.
The distributed system operators are responsible for operating the transport of energy on medium-voltage and low-voltage energy systems in given areas. They ensure the connections of the medium-voltage and low-voltage energy networks, called the distribution networks, to the high-voltage distribution network. They also ensure the energy delivery to customers, but without including supply.
The suppliers are responsible for the sale of energy to customers. In a liberalized energy infrastructure, a supplier can be a wholesale customer who purchases a commodity (for instance energy) with the purpose to sell it subsequently.
The households (or customers) purchase energy for their own use.
Physical Is the network for physical delivery taken into account?
Size What is the physical network size (network volt-ages, number of devices, power capacity)?
The size of a network is an intricate concept and can-not be defined precisely by a single value. For complete-ness, a network size must contain the different voltage of the network, and the number of devices present in the network.
Storages Which types of storage systems are used (total energy, power capacity, power variation)?
Sources Which types of sources are used (renewable, capacity factor, other characteristics defined by the onto- logy)?
Loads Which types of loads are used (predictable, disconnectable, other characteristics defined by the on-
tology)?
Scalability Is the physical network scalable in real- time?
Communication Is communication between devices possible?
The new energy infrastructures have to offer a com-munication between distributed appliances (for example, for a demand response [13]), that is they could allow to take into account priorities on load demands or could increase the balance between consumption and produc-tion.
Microgrids Is the physical network composed of mi-crogrids?
Microgrids [14] can be defined as parts of the energy network that comprise intermittent sources.
This approach allows for local control of distributed generation, thereby reducing or eliminating the need for central dispatch.
Islanded Is the physical network islanded?
Network type Which type of physical network is used? The proposed approaches are validated on the basis of experiments carried out on a simulated physical network, a real network or a combination of both.
Models If simulated, which models are used for the appliances?
Timescales If simulated, which timescales are taken into account in the energy network?
Managing energy in this system implies to take into account several strong constraints.
Besides, supply and demand occurring within the physical network must always be balanced on a short timescale (milliseconds or seconds).
Commodity trade Is the network for commodity trade taken into account?
Dynamic prices Are the prices allocated dynamically between actors?
Time frames Which timescales are taken into ac-count in the energy market?
Depending on the possible control actions, the energy balance has to be maintained at the different time frame [15]. The wholesale market and the retail market ensure energy balance at medium time frame (minutes or hours) and long time frame (days, months or years). The balanc- ing market ensures energy balance at small time frame (milliseconds or seconds) and medium timescale.
3.2. Family Problem Dimension—Domain Focus
Energy Renewables (DER) management, heterogeneous and distributed actors, self-healing networks, ···
Follows some already well-identified problems. Unit commitment The problem of unit commitment (UC) aims at finding the dispatch of available generation sources that meet the electrical load with the minimum cost. In other words, the aim is to determine the combi- nation of available generating sources or units and to schedule their respective outputs to satisfy the forecasted demand with the minimum total production cost under the operating constraints enforced by the system [17].
Demand side management Energy demand manage- ment, also known as demand-side management (DSM) or Load Management [18], is the modification of consumer demand for energy through various methods such as fi- nancial incentives and education. Usually, the goal of demand-side management is to encourage the consumer to use less energy during peak hours, or to move the time of energy use to off-peak times such as nighttime and weekends. Peak demand management does not necessar- ily decrease total energy consumption, but could be ex- pected to reduce the need for investments in networks and/or power plants by reducing demand peaks.
Demand Response The demand response (DR) is an extension to DSM problem. The difference lies in that demand response mechanisms respond to explicit re- quests to shut off, whereas DSM passively shut off when stress in the grid is sensed.
Supply and demand matching Supply and Demand Matching (SDM) is concerned with optimally using the possibilities of electricity production and consumption devices to alter their operation in order to increase the overall match between electricity production and con-sumption.
Vehicle to Grid The idea behind the Vehicle-to-Grid (V2G) concept, is to use the flow of power (both in input and output) of an electric vehicle. These flows can be real add-on for the electrical power grid. Indeed, these vehicles, either electric cars (BEVs) or plug-in hybrids (PHEVs), have the capability to produce AC electricity. The challenge raised by this idea is to provide electricity precisely when needed and recharge these vehicles effi- ciently. By communicating with the electrical power grid BEVs and PHEVs could then implement a Demand Re- sponse service.
Virtual Power Plant A Virtual Power Plant (VPP) is a cluster of distributed generation devices (such as mi- croCHP, PV, wind-turbines, small hydro, etc.) which aggregate themselves to sell electricity. The goal of VPPs is to maximize the value for both the end user and the distribution utility by using software systems. They are dynamic, deliver value in real time, and can react quickly to changing customer load conditions. A VPP matches up a variety of distributed energy systems with intelligent
demand response capabilities and aggregates those re- sources into an asset that acts like a centralized power plant. VPPs are similar to microgrids; however, while microgrids are very local in scope, VPPs can theoreti- cally be deployed on a wide scale at the utility level with the ability to tap resources in real time, and with enough granularity, to control the load profiles of customers, aggregate these resources, and put them up on a trader’s desk.
Self-Healing Network One of the major advantages of smart grids is to allow self-healing of the network with- out the intervention of technicians. This will ensure more reliable supply of electricity, and reduced vulnerability to natural disasters or attack.
4. Evaluation Framework
The points described in 3 present the upstream work for smart grid analysis. However, the objectives of the smart grids are to help companies and individuals to solve the problems due to the daily energy production and man- agement. In order to evaluate the impact of the incoming smart grids, concepts must be defined, we integrate the concept of sustainability usually considered as a compo- sition of Environment, Economy, and Society [19] and we also add a human dimension representing system's control and supervision capabilities.
We tried to collect them within an assessment frame- work combining these 4 different perspectives grouped under the umbrella term societal dimension.
4.1. The Environmental Approach
The most significant environmental impact of power generation is in the form of emission to air, ground and water. Of those emissions, the most significant in terms of impact are emission to air of carbon dioxide
CO2
, nitrogen oxides
NOx
, sulfur dioxide
SOx
, meth-ane
CH4
, nitrous oxide and particulates. The impact on water is more complicated, involving heat, volume and emissions. The objective of this part of our framework mainly consists in determining the benefits of a smart grid’s model to reduce its carbon footprint. How- ever, the objective can be extended to nuclear wastes or other discharges influencing environment. To reduce sig- nificant environmental impact, two main goals are easily focused:
N O2
Reduce pollutants’ emissions and wastes’ production (reducing oil usage, reducing nuclear power plants, etc.).
Lower transmission and distribution losses
The Global Warming Potential (GWP)
tal impact (e.g. [20, Chapter 11]). To estimate the green- house gases’ emission impact, the United Nations Frame- work Convention on Climate Change4 (UNFCCC) sets
up a cost measure, based on the environment impact of the 2, the Global Warming Potential (GWP) [21].
With this cost measure, one can easily evaluate the greenhouse effect of every generator on the environment, given the amount of emitted gases during production, and thus it will be easier to compare them.
CO
The difficulty of the usage of this cost measure re-mains in evaluating the amount of greenhouse gases’ emission, but some research has been made in this prob-lem, and it is currently possible to find the quantity of
emitted per kWh (as [22] or in [23]).
2
CO
4.2. The Economic Criteria
As an economic aspect is already included in an energy network (see 3.1), it is important to define all costs, such as investments (CAPEX), ongoing costs (OPEX) but also the revenues implied by the investments to establish the interest of the problem to be resolved.
All costs and revenues are depending on the problem to be solved. As described in 3.1, the energy market con-tains 3 main kinds of actors with different goals. The producer side is the well-known part of the economic approach. The pertinent elements for this actor are the cost operation and the investments of energy generators. The distribution of the energy created by the new devices also implies a cost which has to be taken into account. Adding an intelligence into a grid implies potentially a communication infrastructure. It can be interesting to manage the energy loss during the transportation. For the consumer side, the main aspects are subscription, taxes and a price of the kWh. The first and the second can vary depending on the location of the consumers, while the third also varies during time.
In [24], the authors precisely describe costs and reve- nues of the electricity market.
The Asia Pacific Energy Research Centre [25] pro- vides some indicators to assess of energy efficiency from an economic perspective. They propose economic value based energy-efficiency indicators measuring the quan- tity of energy consumed relative to the economic/one- tary value of the activity generated, denominated in a currency-related unit. This is an extension of the study published by the French Agency for Environment and Energy Management (ADEME) [26], who suggests three alternatives for comprehensively reviewing trends in energy efficiency at a sectoral or sub-sectoral level:
1) Energy Intensity
Considers whether energy, as an input to production, is used efficiently. Energy intensity’s analysis is generally
based on relative comparisons with established bench- marks, historical trends, or other comparable energy in- tensities.
2) Techno-Economic Ratios
Calculate, from an engineering perspective, the eco- nomic production associated with the unit or specific consumption of energy.
3) Energy Savings Indicators
Endeavor to measure energy savings achieved by con- sumers over a period. These “techno-economic effects” essentially analyze changes in the techno-economic ra- tios.
In [27], authors provide a step-by-step assessment framework based on the work performed by the Electric Power Research Institute (EPRI) for conducting cost- benefit analyzes of smart grid projects.
4.3. The Quality of Service Criteria
Nowadays, it would be impossible to imagine daily life without having a continuous access to energy. Offering this service to a growing number of persons and needs is very challenging. For instance, the transportation of the energy must meet numerous constraints in order to en- sure power quality. Among these constraints, one can cite: nonzero frequency impedance, harmonic variations, etc.
Some statistical indicators of transmission and distri- butions circuits exist [28,29] for assessing the quality of such services, among the best known, we can mention:
1) MAIFI
Momentary Average Interruption Frequency Index measures the weighted average number of outages that last less than ten minutes, which occurred in a year and with reference to the total connected load.
2) ASIDI
Average System Interruption Duration Index measures the weighted average number of outages equal to or more than ten minutes, which occurred in a year and with ref- erence to the total connected load.
3) ASIFI
Average System Interruption Frequency Index meas- ures the weighted average number of outages equal to or more than ten minutes, which occurred in a year and with reference to the total connected load.
4) SAIDI
System Average Interruption Duration Index is the av- erage outage duration for each customer served.
5) SAIFI
System Average Interruption Frequency Index is the average number of interruptions that a customer would experience.
6) CAIDI
Customer Average Interruption Duration Index (SAIDI divided by SAIFI).
7) SISI
System Interruption Severity Index measures the ratio of the unserved energy to the system peak load.
8) FOT
Frequency of Trippings per 100ckt-km measures the number of forced line outages (transient and permanent or sustain) initiated by automatic tripping of relay.
9) FLC
Frequency Limit Compliance refers to the percentage of time during the rating period that the system frequency is within the allowable range of 60 ± 0.3 Hz.
10) VLC
Voltage Limit Compliance refers to the percentage of the number of voltage measurements during the rating period that the voltage variance did not exceed ±5% of the nominal voltage.
Furthermore, some standards exist such as [30], which offers practice developed out of an increasing awareness of the difficulty in comparing results obtained by re-searchers. The Council of European Energy Regulators provides an extensive analysis on the quality of energy supply throughout Europe [31]. It provides a collection of indicators monitoring continuity of supply (interrup-tions), voltage quality and commercial quality used to develop a complete benchmark.
4.4. The Human Integration Criteria
From a consumer’s point of view, power grid remains a black box, an unlimited amount of energy. Unfortunately, unlike fossil-fuel or nuclear based power generation, most renewable-energy sources depend upon generally unpredictable environmental factors (solar, wind, etc.). Thus, it does not suffice to replace coal or nuclear plants with solar power plants to ensure a reliable and stable energy production as consumers are now accustomed. The advent of smart grid will also require the change in consumer behavior.
This change in behavior especially requires new inter-face design and new ways to present information about energy usage to the user. Numerous studies have shown the impact of how to present information about energy usage impacts consumer behavior [32-37]. It appears that human behavior with respect to energy cannot be mod-eled only in terms of cost-effectiveness. It is directly in-fluenced by the following factors [32]:
Personalized information according to a user specific configuration.
Goals and commitments.
Constant feedback, particularly with measures of pro- gress toward goals.
Financial Incentives to encourage consumers to par- ticipate
Supervisory Control And Data Acquisition (SCADA) are a first step towards a monitoring interface that could
participate in user behavior change.
IEC PC 1185 is working on a standard covering the
architecture of smart grid user interface, function and performance requirements of demand side systems, in- formation exchange interfaces among demand side sys- tems/equipment, with the aim to support applications, such as a demand response.
4.5. Summary Statement
This evaluation Framework gives 4 criteria to evaluate the impact of smart grid on the society. In this section, we will describe numerical criteria to evaluate and com- pare approaches solving the same problem in the same structure. The criteria defined below are not the only to evaluate a grid but they represent the improvement of the future grid as defined in the Section 2.
The Global Warming Potential (GWP) appears to be the best existing factor to evaluate the environmental aspect of a smart grid.
The economic factor is depending of the vision of the future grid, but all aspects rely on the price of the en- ergy. The money (dollar, euro, etc.) is thus the obvi- ous factor to compare several grids.
The Quality of Service (QoS) has two perspectives, the first is the feeling of the end-users about the grid (with MAIFI, CAIDI, etc.) and the second is the net- work stability (with FLC, VLC, etc.). These perspec- tives are linked, as the first can be seen as the result of the second.
The Human Integration (HI) is the hardest criterion to quantify. The simplest way to evaluate the human in- teraction with the grid is the number of settings that users can modify.
Smart grids of the same domain (see Section 3) can be evaluated quantitatively and qualitatively following these criteria to offer a comparison of the result.
5. MAS Approaches
In this section, we conduct a comparative study of the main multi-agent approaches for smart grids using the qualification and evaluation framework previously de- fined. After over ten years of research, indisputable pro- gress has been made. Indeed, recent approaches are more and more efficient but the benchmark results show that many efforts are still required to offer a truly compre- hensive toolbox of approaches for smart grids.
The qualification of the framework can globally be set even if the structural dimension is not completely defined. On the other side, the evaluation framework cannot be used with the current analysis of the studied technologies because of the lack of numerical data. This is one of the 5International Electrotechnical Commission, see http://www.iec.ch/
point highlighted by this paper.
5.1. GridAgent
Developed by Infotility, the Grid Agent [38,39] Enter-prise Agent Manager (EAM) Suite is the main user in-terface which provides centralized management and works in conjunction with a suite of pre-configured agent types, specialized editors, applications, and reporting alerting tools, including: An out-of-the-box, complete agent management collection included specialized prop-erty editors: RateEditor, ModelEditor, and RuleEditor, PlanningEditor Preconfigured visual information and analytic tools include: EventManager, Smart Dashboard, Resource Viewer, SmartFilter, Cost Manager.
The GridAgent framework implements several types of agents: “Sense and Control” and “Resource” Agents who have analytic methods to calculate optimal response based on pricing signals. “Planning and Optimization
Agents manage Distributed Energy Resources (DER) devices under various operational scenarios such as op- timal microgrid control strategies. “Blackboard” Agents can store databases (from several media, like Internet or the MAS).
GridAgent also offers human interactions and network protection.
This Suite is developed for managing distributed en- ergy resources and can be used for large-scale integration of distributed energy and renewable-energy resources into real distribution systems.
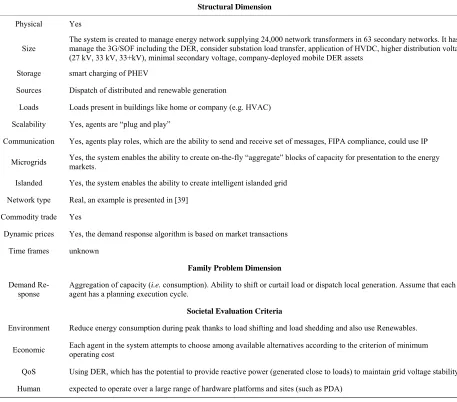
Its evaluation following the given criteria are in Table 1.
5.2. Homebots
[image:7.595.63.520.338.740.2]Homebots [40,41] is an approach that deals with the smart distributed equipment management in a house. It is based on a multi-agent system, the agents of which are
Table 1. Grid agent evaluation.
Structural Dimension
Physical Yes
Size
The system is created to manage energy network supplying 24,000 network transformers in 63 secondary networks. It has to manage the 3G/SOF including the DER, consider substation load transfer, application of HVDC, higher distribution voltage (27 kV, 33 kV, 33+kV), minimal secondary voltage, company-deployed mobile DER assets
Storage smart charging of PHEV
Sources Dispatch of distributed and renewable generation
Loads Loads present in buildings like home or company (e.g. HVAC)
Scalability Yes, agents are “plug and play”
Communication Yes, agents play roles, which are the ability to send and receive set of messages, FIPA compliance, could use IP
Microgrids Yes, the system enables the ability to create on-the-fly “aggregate” blocks of capacity for presentation to the energy markets.
Islanded Yes, the system enables the ability to create intelligent islanded grid
Network type Real, an example is presented in [39]
Commodity trade Yes
Dynamic prices Yes, the demand response algorithm is based on market transactions
Time frames unknown
Family Problem Dimension
Demand Re-sponse
Aggregation of capacity (i.e. consumption). Ability to shift or curtail load or dispatch local generation. Assume that each
agent has a planning execution cycle.
Societal Evaluation Criteria
Environment Reduce energy consumption during peak thanks to load shifting and load shedding and also use Renewables.
Economic Each agent in the system attempts to choose among available alternatives according to the criterion of minimum operating cost
QoS Using DER, which has the potential to provide reactive power (generated close to loads) to maintain grid voltage stability
directly linked to one specific equipment. The manage-ment process is based on a computational market, which can be considered as a multi-agent systems sub-field, involving specific agents.
In this context, every load is represented by an interac-tive load agent, the preference and needs of which are translated into a utility function. The agents are grouped taking into account the topology of both the electrical grid and the communication system.
The utility function is embodied by a utility interface agent. This helps to provide an interface between the utility and the load management system even if the time scales for the different kind of agents (load and utility) are not necessarily the same. In the market management paradigm, the utility interface agents can be considered as a local utility salesperson. This utility agent can thus be directly manipulated in order to make the system go in
on a specific way. The utility function is computed tak-ing into account several elements such as: load model, load’s current state, utility contract, user model, expected evolution of the local market.
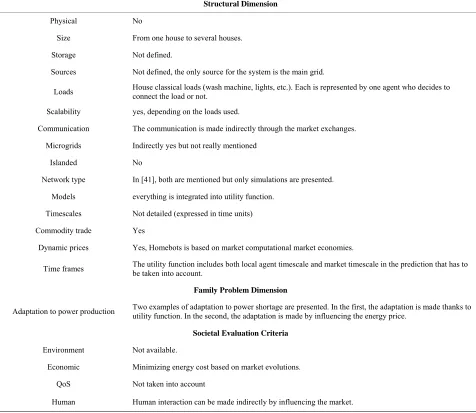
The Homebots evaluation following the defined crite-ria is made in Table 2.
5.3. IDAPS
IDAPS [42] is a distributed smart grid concept proposed by Advanced Research Institute of Virginia Tech. The agents in the IDAPS MAS work in collaboration to de- tect upstream outages and react accordingly to allow the microgrid to operate autonomously in an islanded mode. The proposed MAS consists of:
[image:8.595.57.533.324.737.2] A control agent who monitors the system voltage, de- tects problems and sends signals to the main circuit.
Table 2. Homebots evaluation.
Structural Dimension
Physical No
Size From one house to several houses.
Storage Not defined.
Sources Not defined, the only source for the system is the main grid.
Loads House classical loads (wash machine, lights, etc.). Each is represented by one agent who decides to connect the load or not.
Scalability yes, depending on the loads used.
Communication The communication is made indirectly through the market exchanges.
Microgrids Indirectly yes but not really mentioned
Islanded No
Network type In [41], both are mentioned but only simulations are presented.
Models everything is integrated into utility function.
Timescales Not detailed (expressed in time units)
Commodity trade Yes
Dynamic prices Yes, Homebots is based on market computational market economies.
Time frames The utility function includes both local agent timescale and market timescale in the prediction that has to be taken into account.
Family Problem Dimension
Adaptation to power production Two examples of adaptation to power shortage are presented. In the first, the adaptation is made thanks to utility function. In the second, the adaptation is made by influencing the energy price.
Societal Evaluation Criteria
Environment Not available.
Economic Minimizing energy cost based on market evolutions.
QoS Not taken into account
A DER agent who is responsible for storing associ-ated DER information and monitoring and controlling DER power levels.
A user agent who acts as a customer (user or load) gateway.
A database agent who is responsible for storing sys-tem information.
IDAPS is realized with Zeus [43] multi-agent system platform, which is FIPA-compliant.
This work aims at demonstrating a practical imple-mentation of multi-agent systems in a smart grid located at a distribution level. It also demonstrates that the agent’s capability can be considered as a software alter-native to a traditional hardware-based zonal protection
system for isolating a microgrid. IDAPS separates the multi-agent system (developed with Zeus) and the mi-crogrid hardware (developed with Matlab/Simulink).
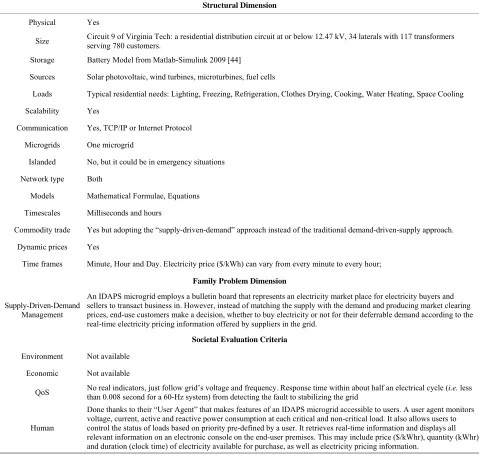
The evaluation of IDAPS is presented in Table 3.
5.4. IDEaS Project
The IDEaS Project has been focusing on the following problem families since its advent:
Adaptive Home Heating ([45]) Demand Prediction ([46,47]) Demand-Side Management ([48,49]) Electric Vehicles ([50-52])
[image:9.595.58.537.283.741.2] Energy Exchange ([53-55])
Table 3. IDAPS evaluation.
Structural Dimension
Physical Yes
Size Circuit 9 of Virginia Tech: a residential distribution circuit at or below 12.47 kV, 34 laterals with 117 transformers serving 780 customers.
Storage Battery Model from Matlab-Simulink 2009 [44]
Sources Solar photovoltaic, wind turbines, microturbines, fuel cells
Loads Typical residential needs: Lighting, Freezing, Refrigeration, Clothes Drying, Cooking, Water Heating, Space Cooling
Scalability Yes
Communication Yes, TCP/IP or Internet Protocol
Microgrids One microgrid
Islanded No, but it could be in emergency situations
Network type Both
Models Mathematical Formulae, Equations
Timescales Milliseconds and hours
Commodity trade Yes but adopting the “supply-driven-demand” approach instead of the traditional demand-driven-supply approach.
Dynamic prices Yes
Time frames Minute, Hour and Day. Electricity price ($/kWh) can vary from every minute to every hour;
Family Problem Dimension
Supply-Driven-Demand Management
An IDAPS microgrid employs a bulletin board that represents an electricity market place for electricity buyers and sellers to transact business in. However, instead of matching the supply with the demand and producing market clearing prices, end-use customers make a decision, whether to buy electricity or not for their deferrable demand according to the real-time electricity pricing information offered by suppliers in the grid.
Societal Evaluation Criteria
Environment Not available
Economic Not available
QoS No real indicators, just follow grid’s voltage and frequency. Response time within about half an electrical cycle (than 0.008 second for a 60-Hz system) from detecting the fault to stabilizing the grid i.e. less
Human
Exposure in Auction Markets ([56]) Micro-storage ([57,58])
Virtual Power Plants ([59])
As examples, only two articles proposed within the IDEaS Project will be evaluated below using our frame-work. The first article tackles a problem of demand-side management. The second article deals with virtual power plants.
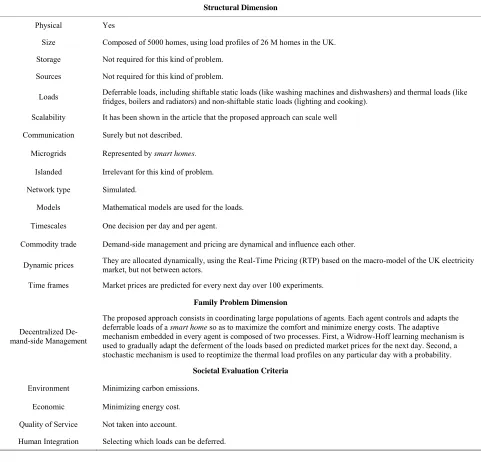
Demand-Side Management: A decentralized demand- side management model is proposed and evaluated in [48]. Such a model aims at optimizing the deferment of loads so as to maximize the comfort in the home and minimize energy cost. The proposed method can be evaluated on the basis of the criteria shown in Table 4.
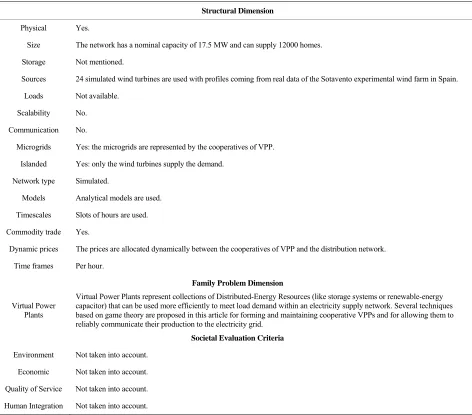
[image:10.595.57.538.285.747.2]Virtual Power Plants: Although the production of en-ergy with Distributed Enen-ergy Resources could potentially reduce reliance on conventional power plants, they lack the capacity, flexibility and controllability to participate in a cost-efficient way for demand supply, both in the physical electricity network and in the electricity market. The creation of Virtual Power Plants (VPP), that is enti-ties that manage a set of DERs, has been suggested in recent years to cope with the previous quoted drawbacks. In [59], the emergence of cooperatives of VPP composed of small-to-medium size renewable electricity producers is controlled with a game-theoretic approach using a pricing mechanism and a scheme allocating payments within the cooperatives. Table 5 evaluates the proposed
Table 4. IDEaS project evaluation: demand-side management.
Structural Dimension
Physical Yes
Size Composed of 5000 homes, using load profiles of 26 M homes in the UK.
Storage Not required for this kind of problem.
Sources Not required for this kind of problem.
Loads Deferrable loads, including shiftable static loads (like washing machines and dishwashers) and thermal loads (like fridges, boilers and radiators) and non-shiftable static loads (lighting and cooking).
Scalability It has been shown in the article that the proposed approach can scale well
Communication Surely but not described.
Microgrids Represented by smart homes.
Islanded Irrelevant for this kind of problem.
Network type Simulated.
Models Mathematical models are used for the loads.
Timescales One decision per day and per agent.
Commodity trade Demand-side management and pricing are dynamical and influence each other.
Dynamic prices They are allocated dynamically, using the Real-Time Pricing (RTP) based on the macro-model of the UK electricity market, but not between actors.
Time frames Market prices are predicted for every next day over 100 experiments.
Family Problem Dimension
Decentralized De-mand-side Management
The proposed approach consists in coordinating large populations of agents. Each agent controls and adapts the deferrable loads of a smart home so as to maximize the comfort and minimize energy costs. The adaptive
mechanism embedded in every agent is composed of two processes. First, a Widrow-Hoff learning mechanism is used to gradually adapt the deferment of the loads based on predicted market prices for the next day. Second, a stochastic mechanism is used to reoptimize the thermal load profiles on any particular day with a probability.
Societal Evaluation Criteria
Environment Minimizing carbon emissions.
Economic Minimizing energy cost.
Quality of Service Not taken into account.
Table 5. IDEaS project evaluation: virtual plants.
Structural Dimension
Physical Yes.
Size The network has a nominal capacity of 17.5 MW and can supply 12000 homes.
Storage Not mentioned.
Sources 24 simulated wind turbines are used with profiles coming from real data of the Sotavento experimental wind farm in Spain.
Loads Not available.
Scalability No.
Communication No.
Microgrids Yes: the microgrids are represented by the cooperatives of VPP.
Islanded Yes: only the wind turbines supply the demand.
Network type Simulated.
Models Analytical models are used.
Timescales Slots of hours are used.
Commodity trade Yes.
Dynamic prices The prices are allocated dynamically between the cooperatives of VPP and the distribution network.
Time frames Per hour.
Family Problem Dimension
Virtual Power Plants
Virtual Power Plants represent collections of Distributed-Energy Resources (like storage systems or renewable-energy capacitor) that can be used more efficiently to meet load demand within an electricity supply network. Several techniques based on game theory are proposed in this article for forming and maintaining cooperative VPPs and for allowing them to reliably communicate their production to the electricity grid.
Societal Evaluation Criteria
Environment Not taken into account.
Economic Not taken into account.
Quality of Service Not taken into account.
Human Integration Not taken into account.
technique using our framework.
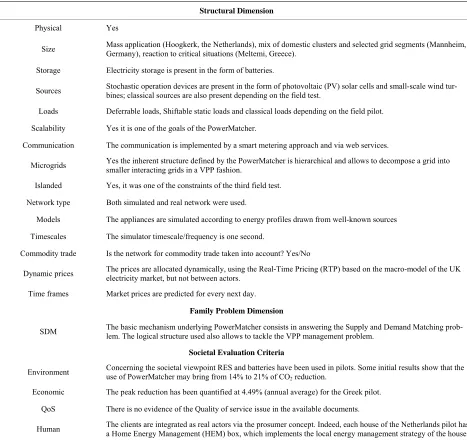
5.5. PowerMatcher
The PowerMatcher [11] is one of the outcomes of the Smart House/Smart Grid European FP7 project6. It
con-sists in a coordination mechanism that aims the balancing of demand and supply in (possibly multi-level) micro-grids integrating Distributed Energy Resources. These microgrids are defined as clusters of sources and loads. The PowerMatcher mechanism implements supply and demand matching (SDM) using a multi-agent system and a market-based control approach. The PowerMatcher technology can be the basis of a Virtual Power Plant (VPP). The qualifying and evaluation of PowerMatcher is presented in Table 6.
Within a PowerMatcher cluster, the agents are organ-ized into a logical tree. The leafs of this tree are a number of local device agents and, optionally, a unique objective agent. The root of the tree is formed by the auctioneer agent, a unique agent who handles the price forming, i.e., the search for the equilibrium price.
Follows a description of the three pilots. Netherlands
Table 6. Power matcher evaluation.
Structural Dimension
Physical Yes
Size Mass application (Hoogkerk, the Netherlands), mix of domestic clusters and selected grid segments (Mannheim, Germany), reaction to critical situations (Meltemi, Greece).
Storage Electricity storage is present in the form of batteries.
Sources Stochastic operation devices are present in the form of photovoltaic (PV) solar cells and small-scale wind tur-bines; classical sources are also present depending on the field test.
Loads Deferrable loads, Shiftable static loads and classical loads depending on the field pilot.
Scalability Yes it is one of the goals of the PowerMatcher.
Communication The communication is implemented by a smart metering approach and via web services.
Microgrids Yes the inherent structure defined by the PowerMatcher is hierarchical and allows to decompose a grid into smaller interacting grids in a VPP fashion.
Islanded Yes, it was one of the constraints of the third field test.
Network type Both simulated and real network were used.
Models The appliances are simulated according to energy profiles drawn from well-known sources
Timescales The simulator timescale/frequency is one second.
Commodity trade Is the network for commodity trade taken into account? Yes/No
Dynamic prices The prices are allocated dynamically, using the Real-Time Pricing (RTP) based on the macro-model of the UK electricity market, but not between actors.
Time frames Market prices are predicted for every next day.
Family Problem Dimension
SDM The basic mechanism underlying PowerMatcher consists in answering the Supply and Demand Matching prob-lem. The logical structure used also allows to tackle the VPP management problem.
Societal Evaluation Criteria
Environment Concerning the societal viewpoint RES and batteries have been used in pilots. Some initial results show that the use of PowerMatcher may bring from 14% to 21% of CO
2 reduction.
Economic The peak reduction has been quantified at 4.49% (annual average) for the Greek pilot.
QoS There is no evidence of the Quality of service issue in the available documents.
Human The clients are integrated as real actors via the prosumer concept. Indeed, each house of the Netherlands pilot has a Home Energy Management (HEM) box, which implements the local energy management strategy of the house.
all-electric Volkswagen Golf car. One house has a stan- dard lead-acid battery to store solar energy for later use. Germany
The installation of the smart meters has been done during spring 2010. The installation of first system pro- totypes at the end customers’ premises have first started at “very friendly user’s” homes. Afterwards, all BEMIs will be rolled out during October and November, so that the field trial operations can start. Meltemi comprises 220 cottages, which are fully inhabited in the summer (from May to September) and mostly empty in winter. A typical cottage in the camp is a single floor building of 70 m2 surface. Most of the cottages are more than 30
years old. Greece
The whole camp is supplied by a 3-phase medium-to- low voltage substation. The maximum load consumption of the site is approximately 220 kW. Furthermore, a 40 kW diesel generator is present. Finally, PV systems are installed in some of the houses as well in the entrance of the camping. The total installed capacity is 6 kWp.
6. Conclusions
problem dimension to bring together approaches, then gives societal evaluation criteria in order to compare these different approaches.
This study aims at defining a cartography of the exist-ing contributions to smart grid and analyze their strengths and weaknesses. Our objective was not to determine which approach is the best among the chosen ones. Such a choice would be dependent on many conditions spe- cific to the deployment context. However, the survey presented in this paper should help a stakeholder with the comparison of the defined features. The reader should be aware of the following limits of this work:
The results presented in this work for all chosen ap- proaches are based on the available documentation (articles, technical reports and presentations). We may have missed some elements and could not be ab- solutely sure that the presented information is com- plete.
The study is theoretical. There was no real experi- mentation to test the different approaches.
The features defined for the analysis and comparison were influenced by the current state of the art of the domain which is still in its infancy. Future works may improve these features and go further.
Future directions for this work may consist in deploy- ing a website in order to store the presented results, en- able new experiments and the addition of new features.
REFERENCES
[1] M. Suga, “Nedo’s Smart Grid Related Activities,” ADEME-NEDO Workshop, 2009.
[2] SGMM Team, “Smart Grid Maturity Model,” Technical Report CMU/SEI-2011-TR-025, 2011.
[3] S. Pullins, “West Virginia Smart Grid Implementation Plan,” Technical Report DOE/NETL-2009/1386, West Virginia Division of Energy, National Energy Technol- ogy Laboratory, US Department of Energy, 2009.
[4] “European Smart Grids Technology Platform—Vision and Strategy for Europe’s Electricity Networks of the Future,” Technical Report, European Union, 2006. [5] Q.-N. N. Tran and G. C. Low. “Agent-Oriented Method-
ologies, Chapter XII: Comparison of Ten Agent-Oriented Methodologies, Pages 341-367,” Idea Group, 2005. [6] S. D. J. McArthur, E. M. Davidson, V. M. Catterson, A. L.
Dimeas, N. D. Hatziargyriou, F. Ponci and T. Funabashi, “Multi-Agent Systems for Power Engineering Applica- tions—Part I: Concepts, Approaches, and Technical Chal- lenges,” IEEE Transactions on Power Systems, Vol. 22, No. 4, 2007, pp. 1743-1752.
[7] S. D. J. McArthur, E. M. Davidson, V. M. Catterson, A. L. Dimeas, N. D. Hatziargyriou, F. Ponci and T. Funabashi, “Multi-Agent Systems for Power Engineering Applica- tions—Part II: Technologies, Standards, and Tools for Building Multi-Agent Systems,” IEEE Transactions on Power Systems, Vol. 22, No. 4, 2007, pp. 17531759.
doi:10.1109/TPWRS.2007.908472
[8] K. Herter, T. O’Connor and L. Navarro, “A Systematic Approach for Assessing Plans to Benefit Customers and the Environment,” Technical report, Herter Energy Re- search Solutions, Environmental Defense Fund, 2011. [9] S. J. Bossart and J. E. Bean, “Metrics and Benefits Analy-
sis and Challenges for Smart Grid Field Projects,” 2011 IEEEEnergytech, Cleveland, 25-26 May 2011, pp. 1-5.
doi:10.1109/EnergyTech.2011.5948539
[10] M. Wakefield, “Methodological Approach for Estimating the Benefits and Costs of Smart Grid Demonstration Pro- jects,” Technical Report, Electric Power Research Insti- tute (EPRI), 2010.
[11] J. K. Kok, M. J. J. Scheepers and I. G. Kamphuis, “Intel- ligence in Electricity Networks for Embedding Renew- ables and Distributed Generation,” In R. R. Negenborn, Z. Lukszo and H. Hellendoorn, Eds., Intelligent Infrastruc- tures, Vol. 42 of Intelligent Systems, Control and Auto- mation: Science and Engineering, Springer, Dordrecht, 2010, pp. 179-209.
[12] K. H. van Dam, “Capturing Socio-Technical Systems with Agent-Based Modeling,” PhD Thesis, Delft Univer-sity of Technology, Delft, 2009.
[13] M. H. Albadi and E. F. El-Saadany, “Demand Response in Electricity Markets: An Overview,” IEEE Power En- gineering Society General Meeting, Tampa, 24-28 June 2007, pp. 1-5.
[14] R. H. Lasseter and P. Paigi, “Microgrid: A Conceptual Solution,” IEEE 35th Annual of Power Electronics Spe- cialists Conference,Vol. 6, June 2004, pp. 4285-4290. [15] M. Amin, “Towards Self-Healing Energy Infrastructure
Systems,” IEEE Computer Applications in Power, Vol. 14, No. 1, 2001, pp. 20-28. doi:10.1109/67.893351 [16] S. D. Ramchurn, P. Vytelingum, A. Rogers and N. R.
Jennings, “Putting the ‘Smarts’ into the Smart Grid: A Grand Challenge for Artificial Intelligence,” Communica- tions of the ACM, Vol. 55, No. 4, 2012, pp. 86-97.
doi:10.1145/2133806.2133825
[17] S. Salam, “Unit Commitment Solution Methods,”World Academy of Science, Engineering and Technology 35, 2007.
[18] C. W. Gellings and J. H. Chamberlin. “Demand-Side Management: Concepts and Methods,” 2008.
[19] W. M. Adams, “The Future of Sustainability: Re-Think- ing Environment and Development in the Twenty-First Century,”Report of the IUCN Renowned Thinkers Meet- ings, 29-31 January 2006.
[20] National Renewable Energy Laboratory, “Power Tech-nologies Energy Data Book,” US Department of Energy, 2006.
[21] J. T. Houghton and Intergovernmental Panel on Climate Change, “Climate Change 1995: The Science of Climate change. Climate Change 1995 [Intergovernmental Panel on Climate Change]. Cambridge University Press, Cam- bridge, 1996.
doi:10.1016/j.energy.2007.01.008
[23] International Energy Agency (IEA), “CO2 Emissions
from Fuel Combustion,” OECD/IEA, Paris, 2011. [24] C. Harris, “Electricity Markets: Pricing, Structures and
Economics,” The Wiley Finance Series, John Wiley & Sons Incorporated, Hoboken, 2006.
doi:10.1002/9781118673409
[25] “Energy Efficiency Indicators, a Study of Energy Effi- ciency Indicators for Industry in APEC Economies,” Technical Report, Asia Pacific Energy Research Centre, Institute of Energy Economics, Tokyo, 2000.
[26] ADEME, “Energy Efficiency Indicators: The European Experience,” ADEME Editions, Paris, 1999.
[27] V. Giordano, I. Onyeji, G. Fulli, M. S. Jiménez and C. Filiou, “Guidelines for Conducting Cost-Benefit Analysis of Smart Grid Projects,” JRC Reference Reports, Euro- pean Commission, 2012.
[28] M. Sullivan and J. Schellenberg, “Smart Grid Economics: The Cost-Benefit Analysis,”Renew Grid, 2011.
[29] “Performance Incentive Scheme,” Technical Report, En- ergy Regulatory Commission, 2005.
[30] “IEEE Recommended Practice for Monitoring Electric Power Quality,”IEEE Std 1159-2009 (Revision of IEEE Std 1159-1995), 2009, p. 26.
[31] “5th CEER Benchmarking Report on the Quality of Elec- tricity Supply 2011,” Technical Report, Council of Euro- pean Energy Regulators (CEER), 2012.
[32] P. M. Johnson, “Human Centered Information Integration for the Smart Grid,” Technical Report CSDL-09-15, Col- laborative Software Development Laboratory, University of Hawaii at Manoa, 2009.
[33] T. Voolink and R. Meertens, “The Effectiveness of Elec- tronic Feedback on Energy and Hot Water Use by House- holders,” Technical Report, Maastricht University, 1999. [34] J. H. van Houwelingen and W. F. van Raaij, “The Effect
of Goal-Setting and Daily Electronic Feedback on In- Home Energy Use,” The Journal of Consumer Research, Vol. 16, No. 1, 1989, pp. 98-105. doi:10.1086/209197 [35] H. Staats, P. Harland and H. Wilke, “Effecting Durable
change: A Team Approach to Improve Environmental Behavior in the Household,” Environment and Behavior, Vol. 36, No. 3, 2004, pp. 341-367.
doi:10.1177/0013916503260163
[36] A. Faruqui, S. Sergici and A. Sharif, “The Impact of In- formational Feedback on Energy Consumption: A Survey of the Experimental Evidence,” Energy, Vol. 35, No. 4, 2009, pp. 1598-1608.
[37] L. Becker, “Joint Effect of Feedback and Goal Setting on Performance: A Field Study of Residential Energy Con- servation,” Journal of Applied Psychology, Vol. 63, No. 4, 1978, pp. 428-433. doi:10.1037/0021-9010.63.4.428 [38] D. A. Cohen, “Grid Agents: Intelligent Agent Applica-
tions for Integration of Distributed Energy Resources within Distribution Systems,” IEEE Power and Energy Society General Meeting-Conversion and Delivery of Electrical Energy in the 21st Century, Pittsburgh, 20-24 July 2008, pp. 1-5.
[39] G. James, D. Cohen, R. Dodier, G. Platt and D. Palmer, “A Deployed Multi-Agent Framework for Distributed Energy Applications,” Proceedings of the Fifth Interna- tional Joint Conference on Autonomous Agents and Multi- Agent Systems, Hakodate, 8-12 May2006, pp. 676-678. [40] J. M. Akkermans, F. Ygge and R. Gustavsson, “Home-
bots: Intelligent Decentralized Services for Energy Man- agement,” 4th International Symposium on the Manage- ment of Industrial and Corporate Knowledge,Rotterdam, 21-22 October 1996, pp. 128-142.
[41] F. Ygge, R. Gustavsson and H. Akkermans, “Homebots: Intelligent Agents for Decentralized Load Management,” DA/DSM 96 Europe Distribution Automation & Demand Side Management Vienna,Vienna, 8-10 October 1996. [42] M. Pipattanasomporn, H. Feroze and S. Rahman. “Multi-
Agent Systems in a Distributed Smart Grid: Design and Implementation,” IEEE Power Systems Conference and Exposition,Seattle, 15-18 March 2009, pp. 1-8.
[43] H. S. Nwana, D. T. Ndumu, L. C. Lee and J. C. Collis, “Zeus: A Toolkit for Building Distributed Multiagent Systems,” Applied Artificial Intelligence, Vol. 13, No. 1-2, 1999, pp. 129-185. doi:10.1080/088395199117513 [44] O. Tremblay, “A Generic Battery Model for the Dynamic
Simulation of Hybrid Electric Vehicles,” IEEE Vehicle Power and Propulsion Conference (VPPC), Arlington, 9- 12 September 2007, pp. 284-289.
[45] A. Rogers, S. Maleki, S. Ghosh and N. R. Jennings, “Adaptive Home Heating Control through Gaussian Proc- ess Prediction and Mathematical Programming,” 2nd In- ternational Workshop on Agent Technology for Energy Systems (ATES 2011), Taipei, 2-3 May 2011, pp. 71-78. [46] H. Rose, A. Rogers and E. H. Gerding, “Mechanism de-
sign for Aggregated Demand Prediction in the Smart Grid,” AAAI Workshop on Artificial Intelligence and Smarter Living: The Conquest of Complexity, San Fran- cisco, 7-8 August 2011.
[47] H. Rose, A. Rogers and E. H. Gerding, “A Scoring Rule-Based Mechanism for Aggregate Demand Predic- tion in the Smart Grid,” The 11th International Confer- ence on Autonomous Agents and Multiagent Systems (AAMAS 2012),Valencia, 4-8 June 2012, pp. 661-668. [48] S. Ramchurn, P. Vytelingum, A. Rogers and N. Jennings,
“Agent-Based Control for Decentralised Demand Side Management in the Smart Grid,” The 10th International Conference on Autonomous Agents and Multiagent Sys- tems (AAMAS 2011),Taipei, 2-6 May 2011, pp. 5-12. [49] S. Ramchurn, P. Vytelingum, A. Rogers and N. Jennings,
“Agent-Based Homeostatic Control for Green Energy in the Smart Grid,” ACM Transactions on Intelligent Sys- tems and Technology, Vol. 2, No. 4, 2011, p. 35.
[50] E. Gerding, V. Robu, S. Stein, D. Parkes, A. Rogers and N. Jennings, “Online Mechanism Design for Electric Ve- hicle Charging,”10th International Joint Conference on Autonomous Agents and Multi-Agent Systems (AAMAS), Taipei, 2-6 May 2011, pp. 811-818.
(AMMA), New York, 22-23 August2011, pp. 100-112. [52] S. Stein, E. Gerding, V. Robu and N. Jennings, “A Mo-
del-Based Online Mechanism with Pre-Commitment and Its Application to Electric Vehicle Charging,” 11th In- ternational Joint Conference on Autonomous Agents and Multi-Agent Systems (AAMAS),Valencia, 4-8 June 2012, pp. 669-676.
[53] P. Vytelingum, S. D. Ramchurn, T. D. Voice, A. Rogers, and N. R. Jennings, “Trading Agents for the Smart Elec- tricity Grid,” The 9th International Conference on Auto- nomous Agents and Multiagent Systems (AAMAS), To- ronto, 9-14 May 2010, pp. 897-904.
[54] S. Miller, S. D Ramchurn and A. Rogers, “Optimal De- centralised Dispatch of Embedded Generation in the Smart Grid,”11th International Joint Conference on Au- tonomous Agents and Multi-Agent Systems (AAMAS), Valencia, 4-8 June 2012, pp. 281-288.
[55] M. Alam, A. Rogers and S. Ramchurn, “A Negotiation Protocol for Multiple Interdependent Issues Negotiation over Energy Exchange,” IJCAI Workshop on AI for an
Intelligent Planet, Barcelona, 16-18 July 2011.
[56] V. Robu, I. Vetsikas, E. Gerding and N. Jennings, “Ad- dressing the Exposure Problem of Bidding Agents Using Flexibly Priced Options,”19th European Conference on Artificial Intelligence (ECAI), Lisbon, 16-20 August 2010, pp. 581-586.
[57] “Agent-Based Micro-Storage Management for the Smart Grid,” 9th International Joint Conference on Autonomous Agents and Multiagent Systems (AAMAS), Toronto, 9-14 May 2010, pp. 39-46.
[58] T. Voice, P. Vytelingum, S. Ramchurn, A. Rogers and N. Jennings, “Decentralised Control of Micro-Storage in the Smart Grid,” AAAI-11:25th Conference on Artificial In-telligence, San Francisco, 7-11 August 2011, pp. 1421- 1426.