Munich Personal RePEc Archive
Opportunities for international portfolio
diversification in the balkans’ markets
Dimitriou, Dimitrios and Kenourgios, Dimitris
University of Ioannina, Department of Economics, National and
Kapodistrian University of Athens, Department of Economics
February 2012
Online at
https://mpra.ub.uni-muenchen.de/37479/
1
Opportunities for international portfolio diversification in the Balkans’ markets
Dimitrios I. Dimitriou (corresponding author)
Department of Economics, University of Ioannina, University Campus, 45110 Ioannina,
Greece, e-mail: ddimi@cc.uoi.gr
Dimitris Kenourgios
Department of Economics, National and Kapodistrian University of Athens, Stadiou
Street 5, Athens, Greece, e-mail: dkenourg@econ.uoa.gr
Abstract
This paper examines long and short-run relationships among three emerging Balkan stock
markets (Romania, Bulgaria and Croatia), two developed European stock markets
(Germany and Greece) and United States (U.S.), during the period 2000 - 2005. We apply
Johansen's (1988) cointegration methodology to test the long-run relationships between
these markets and Granger's (1969) causality methodology in order to capture short-run
cointegration. Our findings are mixed. We provide evidence on long-run relationships
between the Bulgarian and Croatian stock markets and the developed markets. On the
other hand, there is no any cointegration among the developed markets and the Romanian
market. Moreover, there is no cointegrating relationship among the three regional
emerging markets, while short-run relationships exist only among the region. These
results have crucial implications for investors regarding the benefits of international
portfolio diversification.
Keywords: Balkan equity markets, Johansen cointegration, Granger causality
JEL codes: F36, C52, G15
2
Portfolio diversification theory applied by investors from the early 1960. However, in
recent years the liberalized financial markets, new developments in technology and
telecommunications, deregulation and the creation of monetary union of Europe provide
evidence on convergence of international markets. Many researchers developed theories
in reducing portfolio risk. For instance, Markowitz (1952) supported that the portfolio
risk is reduced, as long as there is low correlation between the portfolio's shares.
However, an integrated regional stock market will be more appealing to investors from
outside the region who would find investment in the region easier and or more justifiable.
As shares become more liquid and transaction costs fall, fund managers become
increasingly willing to take positions in the stock markets. As a part of economic
integration, financial integration may help to reduce political risk, promote economic
stability and increase the size of local markets, contributing therefore, to investment
activity.
Over the last decade, impressive changes have occurred in Balkans; from the conflicts
and economic collapse to the break up of traditional trade within the region. Since 2000,
the Balkan economies are through a transitory phase of structural adjustment towards a
market oriented economic system. Nevertheless, during all these years, the Balkan region
displays robust growth rates, expanding more rapidly than the E.U. average and trying to
import the euro as common currency (Kenourgios and Samitas, 2009). The countries of
the Balkan region, which are closer to adopt euro, are Romania, Croatia and Bulgaria.
Cointegration analysis proposed by Johansen (1988) has been adapted to this study in
order to empirically investigate the long- run comovements between international stock
markets. Of course, priority to proceed to Johansen's cointegration methodology is to
determine the order of cointegration of the market indices and ensure that it is equal for
all series. Augmented Dickey-Fuller (1979) and Phillips-Perron (1998) unit root tests are
used to test for the nonstationarity of the series. Finally, we empirically investigate
short-run interdependence and bidirectional causality between the Balkan region and developed
markets using Granger causality methodology (1969).
Our empirical analysis provides two main findings: (i) there are cointegrated
relationships in the long run only between Bulgaria and Croatian equity markets and
3
there is a Granger causality relationship among the emerging Balkan markets, indicating
short-term relationships.
The structure of the paper is organized as follows: Section 2 provides the literature
review. Section 3 analyzes data and methodological issues. Section 4 presents the
empirical results. The final section contains the concluding remarks.
2. Literature Review
The benefits of international portfolio diversification due to low correlations between
developed and emerging financial markets have been investigated by several authors, i.e.
Eun and Resnick (1984), Errynza and Padmanabhan (1988), Wheatly (1988), Meric and
Meric (1989), Bailey and Stulz (1990), Divecha et al. (1992) and Michaud et al. (1996).
Their results can be explained by several factors such as restrictions on world trade,
barriers and high costs transactions, inadequate information on foreign markets and home
bias puzzle. However, several studies, including Roll (1998), Hamao et al. (1990), Lau
and ΜcInish (1993), Rahman and Yung (1994) and Meric and Meric (1989), found a
significant increase in correlation and volatility between stock markets before and after
1987, which occurred in international stock market crisis. The common feature of these
studies is that correlations between stock markets were estimated using relatively short
term periods (weekly, monthly or quarterly sample).
Considering the long term relationships between the U.S. market and European stock
markets, Kasa (1992) and Arshanapali and Doukas (1993), found evidence of bivariate
integration between U.S. and these markets. However, the results of Byers and Peel
(1993) and Kanas (1998) showed that there are no such links. Differences in periods
conducted these studies may explain the discrepancy of their results.
Moreover, studies in emerging markets of the Pacific region have also concluded to
mixed results. Campell and Hamao (1992) supported that the U.S. market and Japan have
long-run relationships, while Harvey (1991) and Chan et al. (1992) demonstrated that
there is a lack of integration between U.S. and Asian markets. Phylaktis and Ravazollo
(2004) demonstrated that there are different degrees of integration between the Pacific
4
emerging markets of Central Europe, U.S. and Germany, as well as Voronkova (2004)
for the emerging markets of Central Europe, developed European markets and U.S.
In contrast, DeFusco et al. (1996) concluded that the U.S. market has not any
cointegrated vector using thirteen emerging capital markets among three regions (the
Pacific basin region, Latin America region and the Mediterranean region). Also, Felix et
al. (1998) demonstrated that there is no long-run relationship between U.S. and a number
of emerging markets.
3. Data and methodology
The data consists of daily prices of six stock markets indices. The indices considered
are: the S&P 500 in U.S., the Xetra DAX in Germany, the ASE General of Greece, the
Vanguard of Romania, the Bulgarian Sofix and the Croatian Grobex, during the period
from 2 November 2000 to 30 December 2005 (1187 observations). Following the
common practice, all indices are expressed in respective local currency to evade
problems associated with transformation due to fluctuations in cross-country exchange
rates and also to avoid the restrictive assumption the relative purchasing power parity
holds.
Prior to testing for co-integration, we determine the order of cointegration of the market
indices and ensure that it is equal for all series. Augmented Dickey-Fuller and
Phillips-Perron (PP) unit root tests are used to test for the nonstationarity of the series. ADF test
procedure is most popular technique while PP test is less restrictive and provides an
alternative way for checking the stationarity feature of a time series. To determine the
appropriate number of lag length the Akaike Information Criterion (AIC) is employed.
Cointegration may exist for variables despite variables are individually nonstationary.
This means a linear combination of two or more time series can be stationary and there is
a long-run equilibrium between them. Thus the regression on the levels of the variables is
meaningful and not spurious. Defining a vector zt of n endogenous variables, it is
possible to specify the following data generating process and model zt as an unrestricted
vector autoregression (VAR) involving up to k– lags of zt:
5
where zt is a (n x 1) matrix, and each of Ai is a (n x n ) matrix of parameters. Then
equation (1) can be reformulated into a VECM form:
Δzt= Γ1Δzt-1+ Γ2Δ zt-2+…+ Γk-1Δzt-k+1+ Πzt-k + ut or
Δzt = 1
1
k
i
ΓiΔzt-i+ Πzt-k + ut (2)
where Γi = -(I - A1-…-Ai), (i= 1,….,k-1), Γi are interim multipliers, and Π = -(I - A1-…
-Ak). Testing for cointegration is related to the consideration of the rank of Π, that is
finding the number of r linearly independent in Π. The number of significant
co-integrating vectors is tested by using the maximum likelihood based λ-max and λ-trace
statistics introduced by Johansen (1991) and Johansen and Juselius (1990).
The Granger causality is employed to examine the existence of short-term causal
relationhips between emerging and developed markets. The Granger causality test takes
the form: t j t j i t i
t a a y x
y 0 (3) t j t j i t i
t a a x y
x 0
(4)
The methodology of Granger determines whether a present variable Y can be
explained by past values of Y and whether adding lags of another variable X improves
the explanation.
4. Empirical results
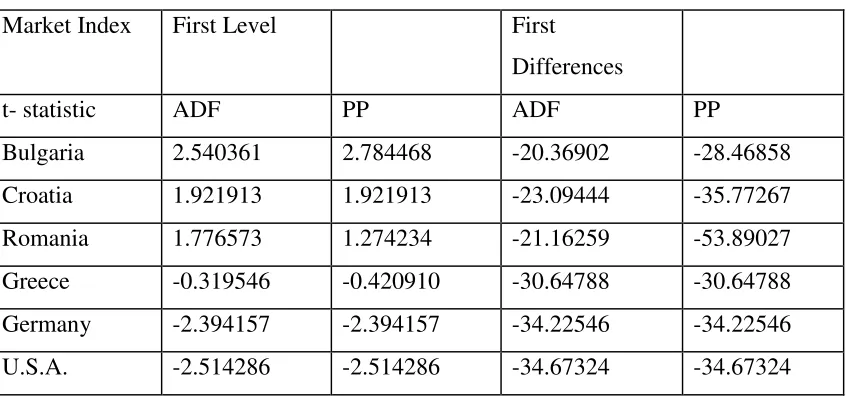
Table 1 presents stationarity tests results from both the Dickey-Fuller and the
Philips-Perron tests. The unit root test statistics reveal that each series is nonstationary in log
levels, but stationary in log first differences. Thus, we note that all regional index series
are integrated of order one, I(1), in the sample period.
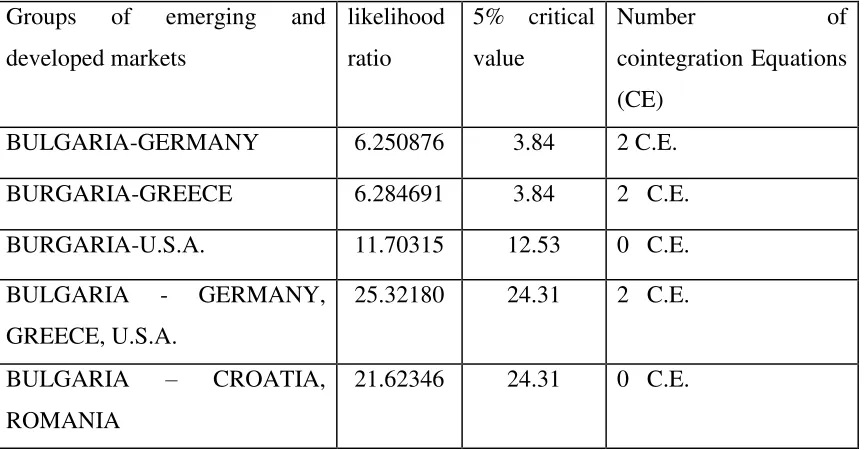
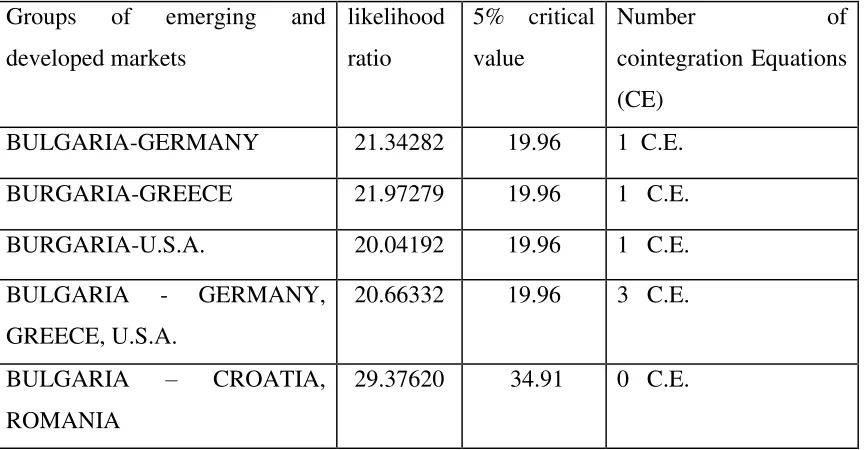
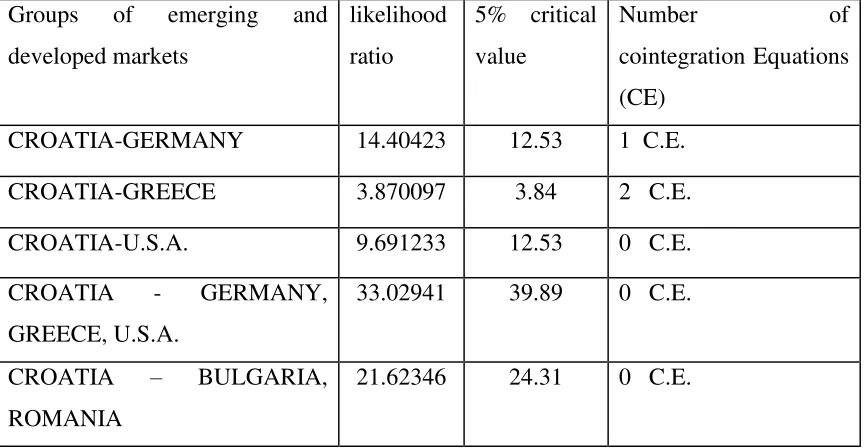
The Johansen (1988) procedure was then applied to determine whether any of the three
Balkan equity markets are pairwise or multivariate cointegrated with the developed
equity markets. Two versions of the Johansen procedure were used: one with intercept in
the cointegrating equation and the other without it. Lag structures were chosen according
to the Akaike Information Criterion (AIC). From Tables 2 and 3, according to the two
6
markets, but no cointegration is existed among the Bulgarian and other two regional
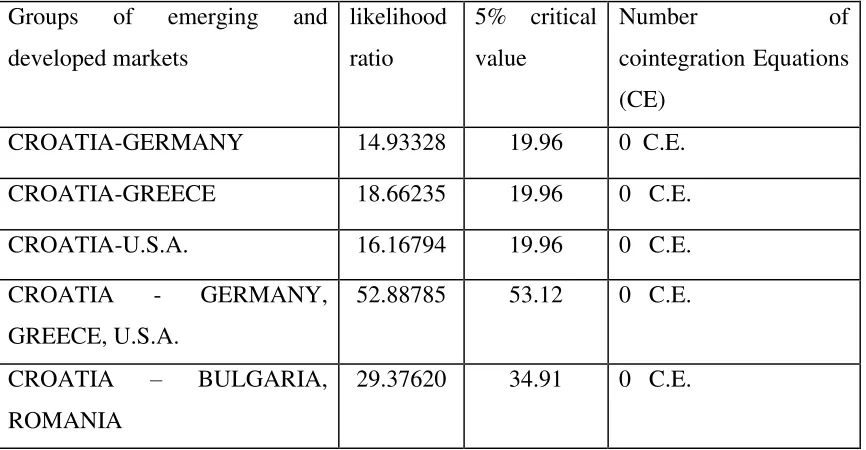
markets. From Tables 4 and 5, the Croatian market has signs of cointegration with
Germany and Greece, but this is not the case with U.S. Also, no sign of cointergration
exists among Croatian and the other two emerging Balkan markets. Results from Tables 6
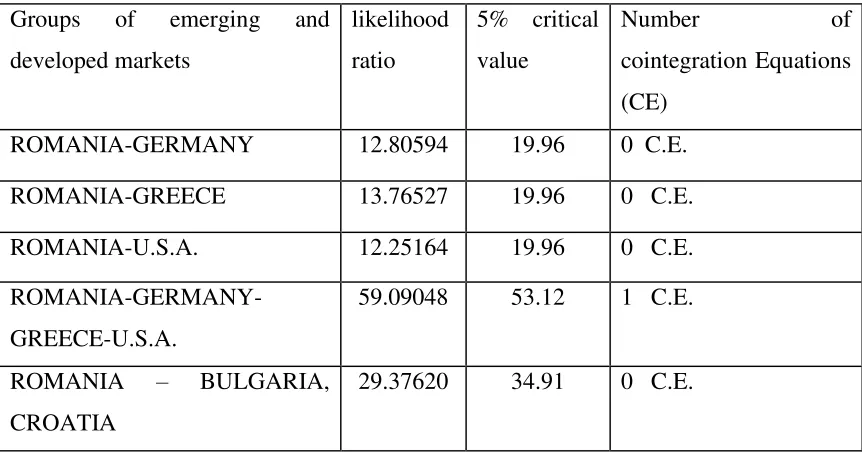
and 7 show that the Romanian market has no sign of pairwise cointegration with the three
developed markets. However, the Romanian market is cointegrated with the group of the
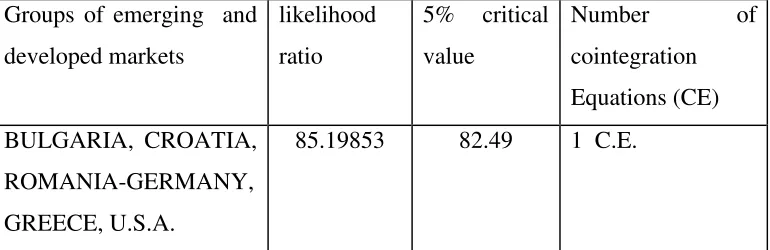
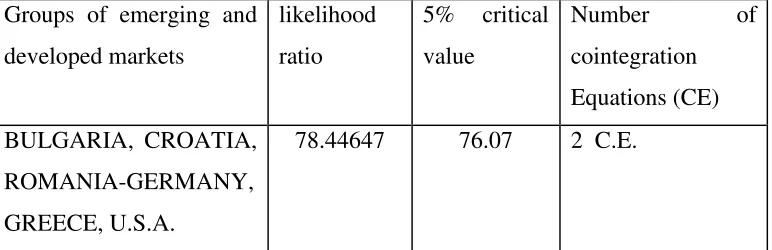
developed markets. Finally, from Tables 8 and 9, we observe that there are cointegrated
relationships when grouping together the emerging and developed markets.
Although the results of the cointegration tests indicate that there are signs of long-run
relationship between the developed and emerging Balkan stock markets, the possibility of
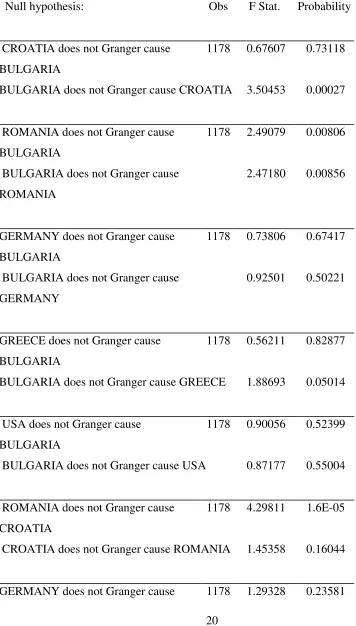
short-run relationships remains. To empirically investigate short-run relationships, we
apply the pairwise Granger-causality test and the results are shown in Table 10. Since this
test is highly sensitive to the lag orders of the right-hand-side variables, the Akaike
criterion was used to determine the optimal lag length; this was nine in each case. The
results suggest a Granger causality running from the Bulgarian market to the Croatian
market (bi-directional causality). Also, there is a uni-directional causality between the
Romanian and the Bulgarian markets, while and the Romanian market does Granger
cause the Croatian market. For any other case of under examination markets, there is no
causality relationship in either direction.
5. Conclusions
Most of the empirical studies on financial market integration in Europe have focused on
either European markets or transition economies. This paper aims to fill this gap by
investigating the relationship among three Balkans stock market (Bulgaria, Croatia, and
Romania), two developed European stock markets (Germany and Greece) and United
States (U.S.), during the period 2000 - 2005. The methodology used is Johansen
cointegration approach and Granger causality.
The results of unit-root tests reveal that each stock index has nonstationary feature over
time, but becomes stationary in its first difference. Johansen's cointegration results are
mixed. There is a long-run relationship between the Bulgarian and Croatian stock
7
among the developed markets and the Romanian market. Moreover, there is no
cointegrating relationship among the three regional emerging markets. In the short-term,
there is a uni-directional causality between the Romanian and the Bulgarian markets,
while a bi-directional causality exists between the Bulgarian market and the Croatian
market and between the Romanian and Croatian markets.
Our results support the conclusion that investors from developed markets can benefit
from diversifying into the Romanian equity market. Since the Romanian market is not
cointegrated with the developed markets, the relatively low correlations of returns
between them are not dependent on the investment horizon and do indicate diversification
benefits for both short- and long-term investors.
Our study presents several additional points that need to be considered. First, from the
results of the Johansen cointegration test it may be preferable to consider the Bulgarian
and Croatian markets as a single market due to high correlation between them.
Furthermore, as is typical with emerging markets, the correlations of the three emerging
Balkan markets with developed countries are increasing over time. Also, it is likely that
as the economies of this region become more fully integrated with Western Europe and
other developed areas, the degree of long-run comovement will increase and also become
a factor in asset allocation decisions. Consequently, the changing nature of diversification
benefits will need to be taken into account over time.
References
Arshanapalli, B Doukas, J., (1993). International stock market linkages: evidence from
the pre- and post- October 1987 period. J. Bank. Finance, vol. 17, pp. 193-208.
Bailey, W., Stulz, R.M., (1990). Benefits of international diversification: the case of
Pacific Basin stock markets. J. Portfolio Manage., vol .16, pp. 57-61.
Byers, M.D., Peel, D.A., (1993). Some evidence on the interdependence of national stock
markets and the gains from international portfolio diversification. Appl. Financ. Econ.,
8
Cambell, J. Y., Hamao, Y., (1992). Predictable stock returns in the United States and
Japan: a study of long-term capital market integration. J. Finance, vol. 47, pp. 43-70.
Chan, K.C., Gup, B.E., Pan, M-S., (1992). An empirical analysis of stock prices in major
Asian markets and the United States. Financ. Rev., vol. 27, pp. 89-107.
DeFusco, R.A., Geppert, J.M., Tsetsekos, G., (1996). Long-run diversification potential
in emerging markets. Financ. Rev. vol., 31, pp. 343-363.
Dickey, D., Fuller, W., (1979). Distribution of the estimators for autoregressive time
series with a unit root. J. Am. Stat. Assoc., vol. 74, pp. 427-431.
Divecha, A.B., Drach, G., Stefek, D., (1992). Emerging markets: a quantitative
perspective. J. Portfolio Manage., vol. 19, pp. 41-50.
Errunza, V.R., P. Padmanabhan, (1988). ‘Further evidence on the benefits of portfolio
investments in emerging markets’, Financ. Anal. J. pp. 76-78.
Eun, C.S., Resnick, B., (1984). Estimating the correlation structure of international stock
prices. J. Finance, vol. 39, pp. 1311-1324.
Felix, A.O., Dufresne, U.B., Chatterjee, A., (1998). Investment implications of the
Korean financial market reform. Int. Rev. Financ. Anal., J. vol. 7, pp. 83-95.
Granger, C.W.J., (1969). Investigating causal relations by econometric and cross-spectral
methods. Econometrica, vol. 37, pp. 424-438.
Hamao, Y., Masulis, R.W., Ng, V., (1990). Correlation in price changes and volatility
across international stock markets. Rev. Financ. Stud., vol. 3, pp. 281-307.
Johansen, S., (1988). Statistical analysis of cointegration vectors. J. Econ. Dyn. Control,
9
Johansen, S., (1991). Estimation and hypothesis testing of cointegration vectors in
gaussian vector autoregressive models, Econometrica, Econometrics Society, vol.59 (6),
pp. 1551-80.
Johansen. S., Juselius, K., (1990). Maximum likelihood estimation and inferences on
cointegration-with applications to the demand for money. Oxf. Bull. Econ. Stat., vol. 52,
pp.169-210.
Kanas, A., (1998). Linkages between the U.S. and European equity markets: further
evidence from cointegration tests. Appl. Financ. Econ., vol. 8, pp. 607-614.
Kasa, K., (1992). Common stochastic trends in international stock markets. J. Monetary
Econ., vol. 29, pp. 95-124.
Kenourgios, D., A. Samitas, (2009). Modelling Return Volatility in Emerging Stock
Markets: A Markov Switching Approach. International Journal of Economic Research,
vol 6 (1), pp. 61-72.
Lau, S.T., McInish, T.H., (1993). Co-movements of international equity returns: a
comparison of the pre-and post-October 19, 1987, periods. Global Finance J., vol. 4, pp.
1-19.
Markowitz H., (1952). Portfolio selection, J. Finance, vol. 7, pp. 71-91.
Meric, I., Meric, G., (1989). Potential gains from international portfolio diversification
and inter-temporal stability and seasonality in international stock market relationships. J.
Bank. & Finance, vol. 13, pp. 627-640.
Michaud, R.O., Bergstrom, G.L., Frashure, R.D., Wolahan, B., (1996). Twenty years of
10
Phillips, P.C.B., Perron, P., (1998). Testing for a unit root in time series regression.
Biometrica vol. 75, pp. 335-346.
Phylaktis K., Fabiola R., (2004). Stock market linkages in emerging markets:
implications for international portfolio diversification. Int. Fin. Markets, Inst. and Money
vol.15, pp. 91-106.
Rahman, H., Yung, K., (1994). Atlantic and Pacific stock markets-correlation and
volatility transmission. Global Finance J. vol. 5, pp. 103-119.
Roll, R.W., (1998). The international crash of October 1987. Financ. Anal. J. vol. 44,
pp. 19- 35.
Syriopoulos T., (2005). Risk and return implications from investing in emerging
European stock markets. Int. Fin. Markets, Inst. and Money vol.16, pp. 238-299.
Voronkova S., (2004). Equity market integration in Central European emerging markets:
A cointegration analysis with shifting regimes. Int. Rev. of Fin. Anal. vol. 13, pp.
633-647.
Wheatly, S., (1988). Some tests of equity integration. J. Financ. Econ. vol. 20, pp.
11 TABLE 1: Stationarity Tests Results
Market Index First Level First
Differences
t- statistic ADF PP ADF PP
Bulgaria 2.540361 2.784468 -20.36902 -28.46858
Croatia 1.921913 1.921913 -23.09444 -35.77267
Romania 1.776573 1.274234 -21.16259 -53.89027
Greece -0.319546 -0.420910 -30.64788 -30.64788
Germany -2.394157 -2.394157 -34.22546 -34.22546
U.S.A. -2.514286 -2.514286 -34.67324 -34.67324
12
TABLE 2: Johansen cointegration test results for the Bulgarian market
(A model with no constant term, without trend)
Groups of emerging and
developed markets
likelihood
ratio
5% critical
value
Number of
cointegration Equations
(CE)
BULGARIA-GERMANY 6.250876 3.84 2 C.E.
BURGARIA-GREECE 6.284691 3.84 2 C.E.
BURGARIA-U.S.A. 11.70315 12.53 0 C.E.
BULGARIA - GERMANY,
GREECE, U.S.A.
25.32180 24.31 2 C.E.
BULGARIA – CROATIA,
ROMANIA
21.62346 24.31 0 C.E.
Note: If the value of the likelihood ratio is less than the critical value at 5 % significance
13
TABLE 3: Johansen cointegration test results for the Bulgarian market
(A model with constant term, without trend)
Groups of emerging and
developed markets
likelihood
ratio
5% critical
value
Number of
cointegration Equations
(CE)
BULGARIA-GERMANY 21.34282 19.96 1 C.E.
BURGARIA-GREECE 21.97279 19.96 1 C.E.
BURGARIA-U.S.A. 20.04192 19.96 1 C.E.
BULGARIA - GERMANY,
GREECE, U.S.A.
20.66332 19.96 3 C.E.
BULGARIA – CROATIA,
ROMANIA
29.37620 34.91 0 C.E.
Note: If the value of the likelihood ratio is less than the critical value at 5 % significance
14
TABLE 4: Johansen cointegration test results for the Croatian market
(A model with no constant term, without trend)
Groups of emerging and
developed markets
likelihood
ratio
5% critical
value
Number of
cointegration Equations
(CE)
CROATIA-GERMANY 14.40423 12.53 1 C.E.
CROATIA-GREECE 3.870097 3.84 2 C.E.
CROATIA-U.S.A. 9.691233 12.53 0 C.E.
CROATIA - GERMANY,
GREECE, U.S.A.
33.02941 39.89 0 C.E.
CROATIA – BULGARIA,
ROMANIA
21.62346 24.31 0 C.E.
Note: If the value of the likelihood ratio is less than the critical value at 5 % significance
15
TABLE 5: Johansen cointegration test results for the Croatian market
(A model with constant term, without trend)
Groups of emerging and
developed markets
likelihood
ratio
5% critical
value
Number of
cointegration Equations
(CE)
CROATIA-GERMANY 14.93328 19.96 0 C.E.
CROATIA-GREECE 18.66235 19.96 0 C.E.
CROATIA-U.S.A. 16.16794 19.96 0 C.E.
CROATIA - GERMANY,
GREECE, U.S.A.
52.88785 53.12 0 C.E.
CROATIA – BULGARIA,
ROMANIA
29.37620 34.91 0 C.E.
Note: If the value of the likelihood ratio is less than the critical value at 5 % significance
16
TABLE 6: Johansen cointegration test results for the Romanian market
(A model with no constant term, without trend)
Note: If the value of the likelihood ratio is less than the critical value at 5 % significance
level, then we accept that there are no cointegration vectors. Groups of emerging and
developed markets
likelihood
ratio
5% critical
value
Number of
cointegration Equations
(CE)
ROMANIA-GERMANY 10.59345 12.53 0 C.E.
ROMANIA-GREECE 10.05480 12.53 0 C.E.
ROMANIA-U.S.A. 5.251089 12.53 0 C.E.
ROMANIA-GERMANY-
GREECE-U.S.A.
43.92825 39.89 1 C.E.
ROMANIA – BULGARIA,
CROATIA
17
TABLE 7: Johansen cointegration test results for the Romanian market
(A model with constant term, without trend)
Note: If the value of the likelihood ratio is less than the critical value at 5 % significance
level, then we accept that there are no cointegration vectors. Groups of emerging and
developed markets
likelihood
ratio
5% critical
value
Number of
cointegration Equations
(CE)
ROMANIA-GERMANY 12.80594 19.96 0 C.E.
ROMANIA-GREECE 13.76527 19.96 0 C.E.
ROMANIA-U.S.A. 12.25164 19.96 0 C.E.
ROMANIA-GERMANY-
GREECE-U.S.A.
59.09048 53.12 1 C.E.
ROMANIA – BULGARIA,
CROATIA
18
TABLE 8: Johansen cointegration test results for all markets
(A model with no constant term, without trend)
Groups of emerging and
developed markets
likelihood
ratio
5% critical
value
Number of
cointegration
Equations (CE)
BULGARIA, CROATIA,
ROMANIA-GERMANY,
GREECE, U.S.A.
85.19853 82.49 1 C.E.
Note: If the value of the likelihood ratio is less than the critical value at 5 % significance
19
TABLE 9: Johansen cointegration test results for all markets
(A model with constant term, without trend)
Groups of emerging and
developed markets
likelihood
ratio
5% critical
value
Number of
cointegration
Equations (CE)
BULGARIA, CROATIA,
ROMANIA-GERMANY,
GREECE, U.S.A.
78.44647 76.07 2 C.E.
Note: If the value of the likelihood ratio is less than the critical value at 5 % significance
20
TABLE 10: Pairwise Granger causality tests results
Null hypothesis: Obs F Stat. Probability
CROATIA does not Granger cause
BULGARIA
1178 0.67607 0.73118
BULGARIA does not Granger cause CROATIA 3.50453 0.00027
ROMANIA does not Granger cause
BULGARIA
1178 2.49079 0.00806
BULGARIA does not Granger cause
ROMANIA
2.47180 0.00856
GERMANY does not Granger cause
BULGARIA
1178 0.73806 0.67417
BULGARIA does not Granger cause
GERMANY
0.92501 0.50221
GREECE does not Granger cause
BULGARIA
1178 0.56211 0.82877
BULGARIA does not Granger cause GREECE 1.88693 0.05014
USA does not Granger cause
BULGARIA
1178 0.90056 0.52399
BULGARIA does not Granger cause USA 0.87177 0.55004
ROMANIA does not Granger cause
CROATIA
1178 4.29811 1.6E-05
CROATIA does not Granger cause ROMANIA 1.45358 0.16044
21 CROATIA
CROATIA does not Granger cause
GERMANY
0.83959 0.57959
GREECE does not Granger cause
CROATIA
1178 1.40002 0.18305
CROATIA does not Granger cause GREECE 1.45871 0.15840
USA does not Granger cause CROATIA 1178 1.34033 0.21124
CROATIA does not Granger cause USA 0.81906 0.59862
GERMANY does not Granger cause
ROMANIA
1178 0.85110 0.56897
ROMANIA does not Granger cause
GERMANY
0.59260 0.80398
GREECE does not Granger cause
ROMANIA
1178 1.44662 0.16324
ROMANIA does not Granger cause GREECE 1.28517 0.24026
USA does not Granger cause ROMANIA 1178 1.05845 0.39109