Subtraction Perfusion CT: A Technical Note
Xiu-Jun Yang1*, Wei Li1, Chi-Shing Zee2
1
Department of Radiology, Shanghai Eighth People’s Hospital, Shanghai, China
2
Department of Radiology, Keck School of Medicine, University of Southern California, Los Angeles, USA
Email: *[email protected], [email protected], [email protected]
Received March 23, 2013; revised April 27, 2013; accepted May 22, 2013
Copyright © 2013 Xiu-Jun Yang et al. This is an open access article distributed under the Creative Commons Attribution License, which permits unrestricted use, distribution, and reproduction in any medium, provided the original work is properly cited.
ABSTRACT
It is challenging to attempt to obtain CT perfusion (CTP) images of the hyperdense tissues, which could conceal the density of contrast material during perfusion study. We report a new technique of subtraction CTP (SCTP) to compen-sate the shortcomings. SCTP post-processed by perfusion software for the data of post-perfusion images subtracting pre-perfusion corresponding images slice by slice in CTP source images is technically feasible without any adverse ef-fects on patients. It provides a new functional imaging with quantitatively hemodynamic indexes of tissue microcircula-tion and reflects accurately the change of blood flow in tissues and organs.
Keywords: Tomography; X-Ray Computed; Perfusion Imaging; Subtraction Technology; Subtraction Computed
Tomographic Perfusion
1. Introduction
Physiological, pathological activities of human tissues and organs are closely related to the change of their blood flow. As advancements in computed tomography (CT), CT perfusion (CTP) have been proven to reflect accurately this change of blood flow in tissues and or-gans [1,2]. The non-invasive CTP provides morphologi-cal, functional information of normal and diseased tis-sues and organs, and provides critical information in the clinical management of diseases. Tissue perfusion, vas-cular proliferation, and underlying pathologyical changes could be evaluated by CTP, through quantitatively eva- luating the hemodynamics of microcirculation at capil- lary level by detecting the dynamic distribution of con- trast media in the capillaries within tissue. Based on time-density curve (TDC) and different mathematical models, values and mappings of quantitative functional parameters including blood flow (BF), blood volume (BV), mean transit time (MTT) of contrast media, time to peak (TTP) and permeability surface (PS) in local tissue were calculated with CTP [2-4]. And with the use of new CT, a larger z-coverage is provided [5], and whole organ volume perfusion could be achieved [6-11]. Hyperdense tissues, however, remain to be a major problem hindering the accurate depiction of CT perfusion parameters in
these tissues, such as bone, hematoma, calcification, or liver tumor with iodized oil deposition after TACE. Therefore, CTP is very seldom utilized to evaluate early osteonecrosis [12], acute intracerebral hemorrhage [13] and liver cancer after transarterial chemoembolization (TACE) treatment with retention of iodized oil [14,15], though few animal and clinical research studies showed perfusion parameters were useful in the assessment of therapeutic response of liver cancer [16,17]. We thus designed a new CT perfusion technique, namely, the subtraction CT perfusion (SCTP), in order to effectively compensate the shortcomings of standard CTP.
2. Methods
2.1. General Methods
maps of the functional parameters of the BF, BV, MTT or PS were observed the difference between lesion and normal tissues on both CTP and SCTP. Owing to differ-ent case determination and observation, statistical analy-sis was not used to process the raw data.
2.2. Steps of SCTP
The SCTP technique included the following steps: 1) Routine CTP scanning was performed 5 - 8 seconds following injection of iodinated contrast media through peripheral vein (scanning time 40 - 50 seconds). In fact, SCTP could be performed with any existing CTP data sets like this study;
2) Using subtraction software in workstation, the im-age containing no contrast material was subtracted from the post-contrast perfusion images at the same level in different time frames slice by slice (Figure 1) manually or semi-automatically to create a new set of imaging data for SCTP source images;
3) Using perfusion software, the set of SCTP source imaging data were processed and analyzed to produce TDCs, mappings and values of tissue perfusion parame- ters of BF, BV, MTT or PS.
3. Results
After subtracted, a new set of 40 or 50 CTP images was created successfully to illustrated contrast media perfu-sion images of tissue regardless of underlying tissue den-sity in the 3 CTP imaging data. And the new microcircu-lation hemodynamics color-coded maps (Figures 2-4) and the functional index values (Tables 1-3) of various parameters of BF, BV, MTT(s) or PS of areas of interest in tissue were all generated successfully on SCTP in the 3 new sets of subtraction source imaging data, and the mean total post-processing time was about 70 min. Com- pared to CTP, the lesion depiction on some mappings was shown better on SCTP, the values of BF, BV, and
[image:2.595.307.538.77.545.2](a) (b)
Figure 1. Cerebral Infarction in left basal ganglion. (a) is usual CTP source image, and (b) is SCTP source image. On SCTP source image, high-density bone becomes low-density, which highlights contrast media perfusion image of tissue.
(a) (b)
(c) (d)
[image:2.595.55.289.557.685.2](e) (f)
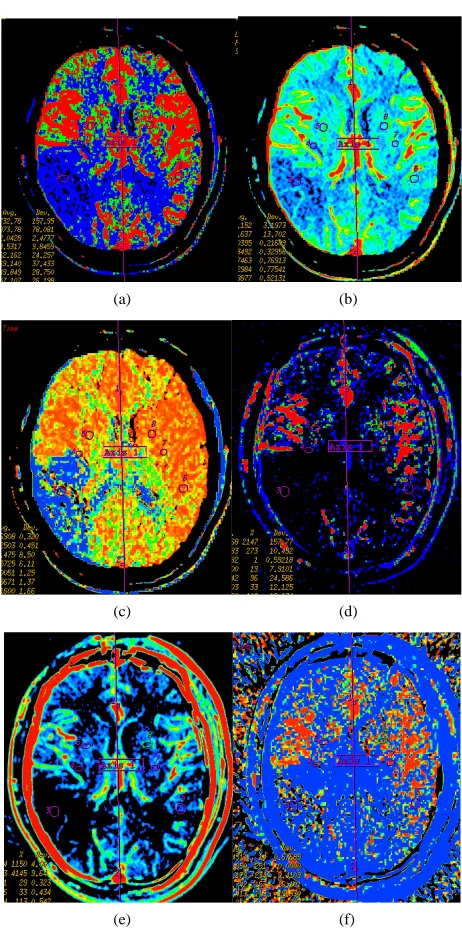
Figure 2. Infarction in right temporal lobe cerebral. Map-ping of BF (a), BV (b), MTT (c) on CTP and mapMap-ping of BF (d), BV (e), MTT (f) on SCTP all accurately reveals cerebral infarction and adjacent tissue characteristics. Those images are similar.
PS measured on SCTP were smaller, while value of MTT on SCTP was larger. The TDC generated from SCTP were similar to that from CTP, their trends were consis-tent, while the height of the entire SCTP curve was lower than that of the CTP curve. And, there were no any ad-verse effects of SCTP on patients.
4. Discussion
(a) (b) (c) (d)
[image:3.595.64.533.85.375.2](e) (f) (g) (h)
Figure 3 Left temporal region meningioma, mapping of BF (a), BV (b), MTT (c), PS (d) on CTP and mapping of BF (e), BV (f), MTT (g) and PS (h) on SCTP all accurately shows the neoplasm and its rich vascular supply.
(a) (b) (c) (d)
(e) (f) (g) (h)
Figure 4. Early osteonecrosis of left experimental canine femoral head. (a) is usual CTP source axial image, which demon-strates the difficulty in interpreting the perfusion images due to underlying hyperdense bone even in bone windows (also, the prostate is not noted). Mapping of BF (b), BV (c), MTT (d) on CTP almost shows no difference in perfusion among local tis-sue in central osteonecrosis region, and adjacent normal tistis-sue region, the contralateral region. (e) is the SCTP source axial image, bone density is subtr d out, which highlights perfusion image of tissue (prostate is also depicted clearly). Mapping
of BF (f), BV (g g of BV.
acte
), MTT (h) on SCTP reveals the osteonecrosis area with decreased perfusion, especially on mappin
SCTP were acquired from the new data subtractedfrom CTP source images, in theory, SCTP was different from standard CTP due to the different patterns of source im- ages. Thus it can be seen that the SCTP images and ana- zes based on the TDC of subtraction CTP source im-
models in both SCTP and CTP is not different. Com- pared to conventional CTP, the SCTP clearly highlights post-perfusion changes of organs and tissues, in particu-lar when there are underlying hyperdense tissues. It will be helpful to achieve functional CT quantification of ly
ages. And this is main difference in mechanism between SCTP and CTP. The algorithm based on mathematical
[image:3.595.56.539.410.576.2]Table 1. The functional index values e measured and observed in stroke.
CTP SCTP
wer
region A region B region C region A region B region C
BF 9.3 ± 5.9 31.6 ± 10.9 45.3 ± 12.8 4.1 ± 1.8 11.8 ± 9.9 23.6 ± 14.5
BV 0.8 ± 0.4 2.2 ± 0.9 2.5 ± 1.2 0.4 ± 0.4 1.5 ± 1.1 1.6 ± 1.5
MTT 9.6 ± 3.3 4.5 ± 1.9 3.0 ± 2.1 15.2 ± 7.4 7.2 ± 4.9 5.8 ± 1.6
*
[image:4.595.58.540.229.335.2]Region A tral infarction region, region B as marginal t on zone, and region C as adjacent normal tissue region.
Table 2. nctional ind es were mea d observed eningi
CTP
as cen ransiti
The fu ex valu sured an in m oma.
SCTP
egion A region B
r region C region A region B region C
BF 331.2 ± 26.3 35.6 ± 21.1 21.2 ± 6.0 53.4 ± 25.7 8.7 ± 2.0 11.2 ± 10.3
BV 20.9 ± 5.2 2.7 ± 1.3 3.3 ± 1.2 2.4 ± 1.2 0.9 ± 1.3 1.2 ± 1.1
MTT .7 10.1 ± 9.2
PS 55.5 ± 12.4 8 ± 4.7 5.5 ± 1.8 7.3 ± 1.1 0. 0.5 ± 0.5
4.0 ± 1.8 4.8 ± 1.2 4.5 ± 2.2 5.5 ± 6.2 12.9 ± 8
28. 6 ± 0.5
*Region A as sol ponents of neoplasm ion B as peritum , and re djacent ue reg
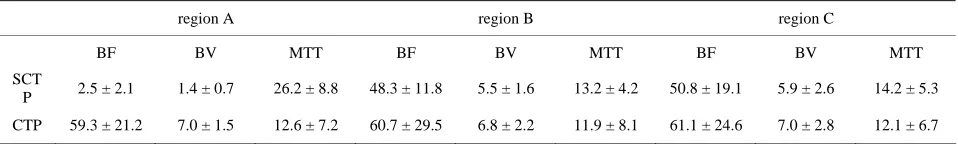
Table 3. The functional index values were measured and observed in ONFH.
region A gion B
id com region, reg oral tissue gion C as a normal tiss ion.
re region C
BV BF BV
BF MTT MTT BF BV MTT
SCT
9 ± 2.6 14.2 ± 5.3
CTP 59.3 ± 21.2 7.0 ± 1.5 12.6 ± 7.2 60.7 ± 29.5 6.8 ± 2.2 11.9 ± 8.1 61.1 ± 24.6 7.0 ± 2.8 12.1 ± 6.7 P 2.5 ± 2.1 1.4 ± 0.7 26.2 ± 8.8 48.3 ± 11.8 5.5 ± 1.6 13.2 ± 4.2 50.8 ± 19.1 5.
*Region A as central necrosis re on.
time consum due to m ch tedious a tificial trace of part ipation ost-pro ing, th nique o TP
was feasi era gs -
limin ry stud ed th e TD -
fl t r x d
sion was better visualized as compared with CTP. Thus,
aller th ose on CTP.
oweve re are ral limi ns of t ch-
Th re oc SC -
ed an t nique b-
g t out co -
contrast perfusion
and organs, such as functional index value of BF, BV,
gion, region B as adjacent normal tissue region and region C as the contralateral corresponding regi
ing of p
u cess
r e tech
ic f SC
ble but op tor dependent. Findin in our pre a
ected
y show hat of CTP,
at th and the de
C graph of ived inde
SCTP re values an
maps also reflected those of CTP. On SCTP maps, the aging data of corresponding slice after le
this novel method of SCTP could potentially enhance the routine clinical application of CTP. And this technique can be applied to clinical practice without any increase in radiation, simply using the CTP imaging data without additional CT scanning. In this study, the values of pa-rameters of BF, BV, MTT and PS in same organ and tissue were different between CTP and SCTP; values of BF, BV and PS on SCTP were lower; and value of MTT on SCTP was higher. The analyses of perfusion imaging were not performed to look at the absolute values of pa-rameters of BF, BV, PS and MTT, but rather the relative values derived from comparison of the values in ROI at the same slice between the lesion and peripheral region or contra-lateral side, so SCTP remained to be valid whether values of these parameters on SCTP were larger
could be integrated into CT perfusion software, creating a new one-stop software for SCTP, post-processing time of SCTP could be significantly shortened. And compared to standard CTP [18,19], SCTP are even less tolerant to motion artifacts. In addition, subtraction process may lead to loss of some anatomical, physiological, and pa- thological information.
5. Conclusion
or sm H
an th
r, the seve tatio his te
nique. e procedu of post-pr essing of TP is com plicat
tractin
d time cons he imaging
uming. If data with
he tech ntrast fro
of su m the im
[image:4.595.59.538.376.448.2]MTT and PS. It can be particularly useful in the evalua- tion of perfusion of hyperdense tissues, such as bone, hematoma, calcification, or tumor after transhepatic arte- rial embolization with iodized oil. Its exact clinical value needs to be validated and the one-stop analytic software needs to be developed.
REFERENCES
[1] K. A. Miles, M. Hayball and A. K. Dixon, “Colour Perfu- sion Imaging: A New Application of Computed Tomo- graphy,” Lancet, Vol. 337, No. 8742, 1991, pp. 643-645. doi:10.1016/0140-6736(91)92455-B
[2] E. G. Hoeffner, I. Case, R. Jain, S. K. Gujar, G. V. Shah, J. P. Deveikis, R. C. Carlos, B. G. Thompson, M. R. Har- rigan and S. K. Mukherji, “Cerebral Perfusion CT: Tech- nology and Clinical Applications,” Radiology, Vol. 231, No. 3, 2004, pp. 632-644. doi:10.1148/radiol.2313021488 [3] V. A. Nagar, A. M. McKinney, A. T. Karagulle and C. L.
Truwit, “Reperfusion Phenomenon Masking Acute and Subacute Infarcts at Dynamic Perfusion CT: Confirma-tion by Fusion of CT and Diffusion-Weighted MR Im-ages,” American Journal of Roentgenology, Vol. 193, No. 6, 2009, pp. 1629-1638. doi:10.2214/AJR.09.2664
[4] M. Koenig, M otz, W. Gehlen and
1 . Kraus, C. Theek, E. Kl
L. Heuser, “Quantitative Assessment of the Ischemic Brain by Means of Perfusion-Related Parameters Derived from Perfusion CT,” Stroke, Vol. 32, No. 2, 2001, pp. 431-437. doi:10.1161/01.STR.32.2.43
[5] S. Diekmann, E. Siebert, R. Juran, M. Roll, W. Deeg, H. C. Bauknecht, F. Diekmann, R. Klingebiel and G. Bohner, “Dose Exposure of Patients Undergoing Comprehensive Stroke Imaging by Multidetector-Row CT: Comparison of 320-Detector Row and 64-Detector Row CT Scan-ners,” American Journal of Neuroradiology, Vol. 31, No. 6, 2010, pp. 1003-1009. doi:10.3174/ajnr.A1971
[6] A. R. Kambadakone and D. V. Sahani, “Body Perfusion CT: Technology, Clinical Applications, and Advances,” Radiologic Clinics of North America, Vol. 47, No. 1, 2009, pp. 161-178. doi:10.1016/j.rcl.2008.11.003
[7] M. Kazuhiro, K. Kazuhiro, N. Masato, H. Toyama, H. Anno, M. Hayakawa, D. S. Ruiz and K. J. Murphy, “Whole-Brain Perfusion CT Performed with a Prototype 256-Detector Row CT System: Initial Experience,” Radi- ology, Vol. 250, No. 1, 2009, pp. 202-211.
doi:10.1148/radiol.2501071809
[8] R. Gupta, A. C. Cheung, S. H. Bartling, J. Lisauskas, M. Grasruck, C. Leidecker, B. Schmidt, T. Flohr and T. J. Brady, “Flat-Panel Volume CT: Fundamental Principles, Technology, and Applications,” Radiographics, Vol. 28, No. 7, 2008, pp. 2009-2022. doi:10.1148/rg.287085004 [9] S. Kandel, C. Kloeters, H. Meyer, P. Hein, A. Hilbig and
Radiol-P. Rogalla, “Whole-Organ Perfusion of the Pancreas Us- ing Dynamic Volume CT in Patients with Primary Pan- creas Carcinoma: Acquisition Technology, Post-Proc- essing and Initial Results,” European Journal of ogy, Vol. 19, No. 11, 2009, pp. 2641-2646. doi:10.1007/s00330-009-1453-z
[10] M. Page, D. Nandurkar, M. P. Crossett, S. L. Stuckey, K. P. Lau, N. Kenning and J. M. Troupis, “Comparison of 4 cm Z-Axis and 16 cm Z-Axis Multidetecto
sion,” European Journal of Ra
r CT Perfu-diology, Vol. 20, No. 6, 2010, pp. 1508-1514. doi:10.1007/s00330-009-1688-8 [11] C. S. Reiner, R. Goetti, D. Eberli, E. Klotz, A. Boss, T.
Pfammatter, T. Frauenfelder, H. Moch, T. Sulser, H. Al- kadhi, “CT Perfusion of Renal Cell Carcinoma: Impact of Volume Coverage on Quantitative Analysis,” Investiga- tive Radiology, Vol. 47, No. 1, 2012, pp. 33-40. doi:10.1097/RLI.0b013e31822598c3
[12] P. Zhang, Y. Liang, H. Kim and H. Yokota, “Evaluation of a Pig Femoral Head Osteonecrosis Model,” Journal of Orthopaedic Surgery and Research, Vol. 5, 2010, p. 15. doi:10.1186/1749-799X-5-15
[13] C. Herweh, E. Jüttler, P. D. Schellinger, E. Klotz and P. Schramm, “Perfusion CT in Hyperacute Cerebral Hem-orrhage within 3 Hours after Symptom Onset: Is There an Early Perihemorrhagic Penumbra?” Journal of Neuroi- maging, Vol. 20, No. 4, 2010, pp. 350-353.
doi:10.1111/j.1552-6569.2009.00408.x
[14] K. H. Lee, K. B. Sung, D. Y. Lee, S. J. Park, K. W. Kim and J. S. Yu, “Transcatheter Arterial Chemoembolization for Hepatocellular Carcinoma: Anatomic and Hemody-namic Considerations in the Hepatic Artery and Portal Vein,” Radiographics, Vol. 22, No. 5, 2002, pp 1091
. 1077-
nscatheter Arterial Chemo- [15] S. H. Choi, J. W. Chung, H. C. Kim, J. H. Baek, C. M. Park, S. Jun, M. U. Kim, E. S. Lee, H. R. Cho, H. J. Jae, W. Lee and J. H. Park, “The Role of Perfusion CT as a Follow-Up Modality after Tra
embolization: An Experimental Study in a Rabbit Mo- del,” Investigative Radiology, Vol.45, No.7, 2010, pp. 427-436. doi:10.1097/RLI.0b013e3181e07516
[16] Z. Kan, S. Kobayashi, S. Phongkitkarun and C. Charn- sangavej, “Functional CT Quantification of T
sion after Transhepatic Arterial Embo
umor Perfu- lization in a Rat Model,” Radiology, Vol. 237, No. 1, 2005, pp. 144-150. doi:10.1148/radiol.2371040526
[17] D. Ippolito, P. A. Bonaffini, L. Ratti, L. Antolini, R. Corso, F. Fazio and S. Sironi, “Hepatocellular Carcinoma Treated with Transarterial Chemoembolization: Dynamic Perfusion-CT in the Assessment of Residual Tumor,” World Journal of Gastroenterology, Vol. 16, No. 47, 2010, pp. 5993-6000
[18] E. Squillaci, G. Manenti, C. Cicciò, F. Nucera, P. Bove, G. Vespasiani, L. Russolillo and G. Simonetti, “Perfu- sion-CT Monitoring of Cryo-Ablated Renal Cells Tu-mors,” Journal of Experimental & Clinical Cancer Re- search, Vol. 28, 2009, p.138.
doi:10.1186/1756-9966-28-138
[19] C. S. Ng, A. G. Chandler, W. Wei, E. F. Anderson, D. H. Herron, C. Charnsangavej and R. Kurzrock, “Reproduci- bility of Perfusion Parameters Obtained from Perfusion CT in Lung Tumors,” American Journal of Roentgenol- ogy, Vol. 197, No. 1, 2011, pp. 113-121.