Munich Personal RePEc Archive
State legitimacy and famines in
Sub-Saharan Africa
Sutter, Camille
GATE, Université Lyon 2
October 2011
Online at
https://mpra.ub.uni-muenchen.de/37621/
State Legitimacy and Famines
in Sub-Saharan Africa
Camille Sutter
∗Abstract
Political Economy of famines mainly focusses on political regimes to understand the role of institutions. In this paper, we investigate a broader concept, state legitimacy, and its role on one specific development outcome, famine management. State legitimacy refers to the political history of a country, meaning the embedding of state and society. Using a database of
Sub-Saharan countries observed from 1980 to 2005, we use three empirical strategies: logit on famine occurrence, negative binomial regression and Arellano-Bond dynamic model on the number of years of famines. They all lead to the same results : there is room for a political economy of
famine based on an analysis of state. State legitimacy prevents famines, controlling for shocks countries might go through, and controlling for the quality of government.
The main contributions of this paper are first to consider the role of state legitimacy in the
political economy of famines and second to apply the concept in an empirical analysis, using for the first time a state legitimacy variable.
Keywords: Democracy, Famine, Institutions, State Legitimacy, Sub-Saharan Africa
JEL classification: I3, I18, H11, H12, O55, Q18
Acknowledgments: We thank Pr. Edward Miguel and Pr. Philippe Polomé for advising
carefully this research, Francesco Burchi, Mathieu Couttenier, Raphaël Soubeyran and Pasquale
Tridico for their precious help, Claire Lebarz, Mathieu Gonod, Markus Pelger, Charlotte Ruggeri,
Paolo Zacchia for their useful comments.
∗Camille Sutter - École Normale Supérieure de Lyon, Université Lumière Lyon 2 - Faculté des Sciences
1
Introduction
This paper tries to point out the weight of political factors in famines occurrence. Recent
develop-ments in the economic literature of famines focus on their political determinants, from the theory
developed by Sen (1999) to its empirical investigation (Plümper and Neumayer (2009)[1], Burchi
(2011)[2]). However, they only deal with one aspect of institutions of a country, that is political
regimes. The aim of this paper is to provide a broader view of institutional determinants of famines,
based on consideration for state. We use the concept of state legitimacy to understand its impact
on famines occurrence, with a complementary view of the role of state and government. We focus
on Sub-Saharan Africa for two reasons. First, as argued by Devereux (2000 [3]), famines are
in-creasingly concentrated in Africa, more precisely in Sub-Saharan Africa. Since the early 1980s, 8
out of the 9 most dramatic famines occurred in Sub-Saharan Africa, accounting 470,000 deaths1
.
Second, even though the link between crop failures and famines has been relaxed (Devereux and
Howe (2002) [4]), climate change and especially the rise of drought risks in this region of the world
increases the risk of famine occurrence, and shed light on the importance of qualitative institutions
to prevent and manage famine.
Famines are complex phenomena. A classical definition in economic literature can be found in
Sen (1981) [5]: a famine is “ a particularly virulent manifestation of starvation causing widespread
death”. Understanding famines has been an early concern of economists, first of all Malthus
(1798)[6]. The early models of famines focus on the gap between food supply and food demand,
considering a given technology and a fixed level of cultivable land available. Then, economic
re-flection on famines shifted to food availability. Sen’s major work on poverty and famines (1981
[5]) impulsed a turning point. Sen first assesses that starvation is a matter of ownership, hence of
economic institutions. Ownership is defined by entitlement, and famines are the outward sign of a
market collapse. The political economy of famines is more recent. Sen (1999 [7]) shifted his focus
from economic to political institutions, asserting that “democracy prevents famines” through two
main channels: free media and multi-parties elections. Sen’s work has been discussed, supported
by Burchi (2011[2]) or criticized by Plümper and Neumayer (2009 [1]). However, these discussions
mainly focus on the form of government - roughly: democracy or autocracy-. In this paper, we
1“
investigate statehood as a relevant concept to model the connection between political institutions
and famines.
We use two measurements of famines: its occurrence and the number of occurrences of famine
during the period. Hence, we develop a cross-country analysis of the impact of institutional quality
on these dependent variables. Two types of famine-prone shocks are controlled: climatological
shocks, represented by the National Rainfall Index, and its standard deviation by country ; political
shocks, represented by the occurrence of a civil war. Controlling for these shocks, we measure
direct and indirect effect of institutional variables. Political regime quality is represented by an
index of democracy. State quality is measured by a dataset developed by Englebert (2000 [8]) that
is state legitimacy. State legitimacy has two dimensions: the horizontal legitimacy is the ethnic
fragmentation of the country. Vertical legitimacy is the proximity of the state - as a structure of
political power - to the society. To the best of our knowledge, this paper is the first to offer a
political economy of famines based on statehood. Moreover, it is the first to use Englebert’s dataset
on state legitimacy.
On a sample of 36 countries over the period 1980-2005, three empirical strategies are developed.
First, we focus on famine occurrence, using a logit. The outcomes are striking: when significant, the
coefficients associated to political variables are strongly negative, meaning that an improvement of
institutional quality decreases the likelihood of a famine. Moreover, even though there is a shock, a
higher state legitimacy lead to a lower likelihood of famine occurence. Potential endogeneity of civil
war is controlled and do not change the results. Second, we focus on the number of years of famine
a country goes through. Using a negative binomial model designed for panel data, we obtain the
same outcomes than previous: a protective effect of institutional quality, from political regime to
state legitimacy. Third, expected temporal autocorrelation of this variable is controlled using an
Arellano-Bond estimator. The signs and significance of our coefficients remain identical. Hence, our
empirical work definitely support our assumption that a political economy of famines can also be
based on statehood consideration. A higher state legitimacy protects individuals against famines,
controlling for the quality of its government.
The remainder of the paper is structured as follows. Section 2 reviews existing modelling of
famines and offers a political theory of famines based on statehood. Section 3 presents the empirical
2
Toward a political economy of famines
2.1
Famine as food deprivation
2.1.1 Defining famines
Defining famine is not that simple, and this impacts the empirical analysis of famines. Hence, a
survey of the economic concept is necessary.
First of all, the outlines of the concept of famines are changing and that provides a first obstacle
to the measurement of famines. Famine involves acute starvation - the lack of body mass for age and
height - (Drèze and Sen (1989) [9]) that differs from chronic starvation - leading to low development
of body and lack of height for age. Hence, famines may be defined as “health crisis” (de Waal (1989)
[10]), differing from other malnutrition issues. However, as they are complex phenomena, involving
multidisciplinary concepts, famines are more often measured by their consequences. De Waal (2000
[11]) identifies four outcomes, occurring with different intensity in each famine. (1) Hunger defining
the undernutrition aspect, and relating to the etymological meaning of famines as “fames”, hunger
in latin. (2) Impoverishment, i.e. “loss of livelihood, income and assets” (De Waal (2000) [11]:6). (3)
Social breakdown, that is the dislocation of social networks, for instance by the massive migration
following from famines (4) Mortality, that is higher during famines.
Second, even agreeing on a definition of famine, available figures are controversial. As argued
by Devereux (2000 [3]), “surprisingly little is known about the scale of excess mortality in most
famines”. First, even basic demographics are often unreliable or unavailable in the concerned
countries. Therefore, data collected during a crisis are not reliable. Moreover, famine mortality is
also due to epidemiological reasons, like epidemics in the relief camps or diseases due to weakness
or change of nutritional regimes: malaria, measles and diarrhea are the main killers (Shears (1991)
[12]). Relating disease mortality to the concept of famines is not automatic, and the figures of famine
mortality might vary from single to double. Devereux (2000 [3]p.6) surveys the estimated mortality
in major 20th century famines, and shows that even the mortality of famines accepted as such is still
debated. For instance, the mortality of ethiopian famine from 1983 to 1985 is estimated from the
lower bound of 590,000 (Africa Watch (1991) [13]) to the larger bound of 1,000,000 (Kumar 1991
[14]). Finally, as argued by Devereux and Howe (2004 [15]), famine definition is still ideologically
than being ‘found’, a definition of famine must be ‘agreed’”.
A direct implication of this observation is that it is difficult to provide an empirical analysis
of famines. In particular, an estimation of the number of deaths or people affected by a famine
is unreliable. Therefore, running estimation on it may lead to inaccuracy and over- or
under-estimation of the impact of parameters. Even though lower in information (as argued by Devereux
and Howe (2004) [4]), a binary consideration famine/no famine is more reliable than an estimation
based on famine mortality2
.
2.1.2 Explaining famines: groundings of the current theories.
The demographic explanation: The first economist modeling famines was Malthus(1798[6]),
who delimitated the ground for a so-called neo-malthusianism 3
. Demographic explanations of
famines define them as the result of food supply limits due to massive increase in the population.
The economic explanation:
Famines as entitlement failures Sen (1981 [5]) provides an other economic explanation
of famines. His main purpose is to discuss the food availibility theory, inspired by Malthus’work.
Sen goes from a commodity approach (food) to an entitlement approach, focusing on the legal
right to possess food on the market. His work starts with a paradox: some of the 20th century
famines occurred in countries with no food availibility decline. Sen provides a general framework
to understand these famines, that is a decline of food access. Hence famines are not related to food
availibility but to dispersion of entitlement that is “the set of alternative commodity bundles that a
person can command in a society using the totality of right and opportunities that he or she faces”
(Sen (1984) [17]).
According to Sen’s analysis, there are four legal sources of food : production-based
entitle-ment comes from what people produce, trade-based entitleentitle-ment from the trade of physical assets,
labor-based entitlement from the fact that agents are entitled with their wage and transfer-based
entitlement from formal or informal transfers. Three exchanges conditions determines the
enti-tlement: endowments: ownership over productive resources as well as market prices, production
2However, our estimation on the count of death has similar behavior that the models presented in this paper.
Results available upon request.
possibilities and their use and exchange conditions. These conditions define an entitlement set, that
can be represented as an endowment vector xon an exchange entitlement mapping Ei(.)
4
. Two
situations may lead to starvation: a shift in exchange conditions, or a shift in endowment.
Critiques to the entitlement approach The interest of this approach is its focus on market
and institutions. Nevertheless, according to Edkins (2000) [18], it leaves out the social and political
aspects. Devereux (2001[19]) establishes a more systematic survey of critiques and counter-critiques
of Sen’s theory. He distinguishes two strands of refutation: reinterpretation or counter-example of
Sen’s theory. Sen himself admits four limitation of his theory:
• “choosing to starve”: food consumption choice might be considered at a household level: there
are tradeoff inside the household, leading to starvation of some agents.
• “starvation or epidemics?”: famine mortality is more due to migration and diseases than to
lack of food entitlement approach focusses on starvation and leaves out the famine mortality
issue.
• “fuzzy entitlements”: according to Devereux (2001 [19]), “the notion of entitlement is
concep-tually and empirically inseparable from an economic system founded on private property and
the legal rights associated with exclusive ownership by individuals of assets as commodities”
-entitlement approach doesn’t hold when considering a system of non-institutionalized rights.
• “extra-entitlement transfers”: entitlement approach cannot address “war famines”, since
“en-titlement theory has no place for violence” (de Waal (1990) [11]p. 473).
According to Devereux (2001 [19]), Sen’s theory of entitlement doesn’t pay attention to famines as
political crisis.
Sen’s theory on entitlement failure had a large impact on economic literature (Devereux (2001)
[19]). However, in the beginning of the 1990s, famines are more and more considered as complex
emergencies, with multiple factors. Hence, the political frame is defined as very important to
un-derstand the occurrence of a famine: even though different shocks can lead to famines, the political
management of it is the main explanation of famine occurrence or prevention. As summarized by
4The purpose of this section is a brief epistemology of famines explanation. See Sen(1981 [5]) for broader
Keen (1994 [20]:213): “the real root of famine may lie less in a lack of purchasing power within the
market (although this will be one of the mechanisms of famine) than in a lack of lobbying power
within national (and international) institutions” . Sen answers back the critiques (Drèze and Sen
(1989)[9], then Sen (1999) [7]) with a theory of political regime determining famines occurrence.
2.2
A political theory of famines
2.2.1 Political regime and famines
Famines and Democracy In this section, we focus on the link between political variables
and famines: this relation is the core of this paper’s investigation. We want to test the assumption
that political frame matters to manage shocks leading to famines. We first consider the classical
political theory of famines, and then suggest a complementary view to Sen’s theory. Sen ((2005)
[21]:188) points out that “major famines do not occur in democracies, even when they are very
poor”. According to Sen (1999 [7]), two strands support the incentives for democracy to act against
famines: the nature of regime and the freedom of press. First, democracy does not mean a greater
benevolence than autocratic regimes. It creates an environment of political competition, with a cycle
of elections leading politicians to struggle for reelection. Then the government will pay attention to
the general interest. Second, free press guarantees information access to the public. On one hand,
free press provides useful informations to politicians. On the other hand, it compels government to
act: transparency of information prevents famines concealing.
Empirical Support and Critiques Empirical supports of these theories are often case
stud-ies. Drèze (in Drèze and Sen (1991) [22]) selects four examples of famines prevention in Africa to
stress the efficiency and the relevance of early warning systems: Cape Verde, Kenya, Zimbabwe,
Botswana support the demonstration. Sen only provides local evidence for his theories, through
case studies, but he argues that “there has never been a famine in a functioning multiparty
democ-racy” (Sen (1999) [7]). Following Sen, Burchi (2011 [2]) estimates the impact of democratic regimes
on famine occurrence and mortality at an international scale, using a sample of low-income and
emerging countries that are still likely to go through a famine. He uses the frame of public choice
developed by Buchanan and Brennan (1980 [23]) to show that democracies have more incentives to
democ-racies are by far more likely to avoid famines. Hence he confirms the validity of Sen’s argument.
Table 1: List of Famines that occurred in democracies
Year Countries
1982 Botswana
1983 Nigeria
1986 South Africa
1987 Sudan
1988 South Africa, Sudan
1991 Mali, Namibia, Zambia
1992 Botswana, Somalia
1995 Namibia, South Africa, Zambia
1998 Namibia
2000 Madagascar, Somalia
2001 Niger
2001 Lesotho, Madagascar, Namibia, Senegal
2004 Kenya, Somalia, South Africa
2005 Burundi, Kenya, Madagascar, Malawi, Mali, Niger, Somalia Democracies are defined according to Polity IV Dataset
However, some critiques can be raised. As presented in table 1, there are counter-examples to
Sen’s theory : in our sample, 32 famines occurred in democracies, out of 126 during the period
(1980-2005). For instance, Rubin studies the Malawian famine of 2002 (Rubin 2009 [24]) and
explains it by the fragility of the state and the dependance to international food aid. Moreover,
Plümper and Neumayer (2009 [1]) develop an alternative political theory of famines. Refuting Sen’s
theory by empirical counter-facts, they base their demonstration on the selectorate theory of Bueno
de Mesquita et al. (2002 [25]): both democracies and autocracies face a trade-off between cost of
action and cost of inaction. The government is assumed to maximize its political support to stay
in power. Then “both democracies and autocracies can experience famine mortality if governments
find that inaction is the support-maximizing strategy” (Bueno de Mesquita et al (2002) [25]:58):
some government might gain, letting famines to occur. Plümper and Neumayer (2009 [1]) provide
empirical support to their theory. There is still a difference between democracies and autocracies:
the latter are more likely to target population that benefit from transfers, whereas democratic
policies benefit a higher proportion of affected people.
Rubin (2009 [26]) is more skeptical about the possibility of a monocausal theory of famines.
occurrence, varying the regression models and the variables. Famines are complex phenomena that
require a multicausal theory. Hence there is room for improvement of famines explanations.
Theoretical critiques. One main critique against the use of political regime as an
indi-cator of institutional quality is particularly crucial concerning Sub-Saharan Africa. Some
coun-tries have good indicators of democratic parameters, like multiparty elections, but are not actual
democracies. The critique is developed by Diamond (2002 [28]), through the concept of “hybrid
regimes”. Hybrid regimes are these “combining democratic and authoritarian elements” (Diamond
2002 [28]:23). Therefore, Diamond draws up a classification of regimes, distinguishing
demo-cratic and non-demodemo-cratic regimes. He divides non-demodemo-cratic regimes into electoral authoritarian
regimes and politically closed. Electoral authoritarian regimes may be competitive or hegemonic
(non-competitive). Ambiguous regimes are the residuals. Table 2 sums up the classification for
Sub-Saharan Africa in 2002. Borders between democratic and autocratic regimes are particularly
blurred in this region of the world. Hence, focusing on election to define democracies is not always
[image:10.612.91.591.405.572.2]sufficient, especially focusing on Africa.
Table 2: Hybrid Regimes in Africa
Democratic Ambiguous Non Democratic
Liberal Electoral Ambiguous Competitive Hegemonic Electoral Politically Closed
Cape Verde Ghana Mozambique Lesotho Burkina Faso Swaziland
Mauritius Mali Tanzania Central Af. Rep Congo Burundi
Sao Tome et Princ. Nambibia Nigeria Guinea Bissau Mauritania Congo, DRC
South Africa Benin Djibouti Cote d’Ivoire Chad Eritrea
Botswana Madagascar Sierra Leone Gabon Guinea Rwanda
Seychelles Zambia Gambia Uganda Somalia
Senegal Togo Angola Sudan
Malawi Ethiopia Liberia
Niger Kenya Equat. Guinea
Cameroon Zimbabwe
Sources: Diamond (2002 [28])
A second argument might be stressed: economists study democracies to deal with institutional
quality. As argued by Englebert (2000 [8]), this focus of economists on democracy reveals a confusion
between government and state. The government is “the particular occupants of executive office at
with a comparative advantage in violence, extending over a geographic area whose boundaries are
determined by its power to tax constituents” - North (1981 [30]:21). A second aspect of what
state means is developed by Gilley (2002 [29]), according to whom state is “the basic institutional
and ideological structure of a political community”. Importing the concept of state in a political
economy of famines is particularly interesting focusing on Africa. African states generally have low
state capacity. As Englebert writes: “in a nutshell, most African States fall short of the requirements
for statehood. They may exist as juridical entities, but they lack “empirical statehood” ”(Englebert
2000 [8]). This observation follows Jackson and Rosberg (1982 [31]) theory of African weak states.
Therefore, statehood quality is an interesting prism of analysis for Sub-Saharan Africa. It is also
a way to politically differentiate African countries with a concept differing from political regime,
relating to political history and to social environment of a country.
2.2.2 State legitimacy and famines
The theoretical grounding of state legitimacy and its impact on famines Following
Englebert (2000 [8]), we focus on one particular dimension of states, that is the link between state
as a structure and society as a whole of individuals. This idea is defined by the concept of state
legitimacy. The concept has been used and developed for decades (see Bratton and Chang (2006
[32]) for a review). Here, we consider legitimacy as following: “a state is more legitimate the more
that it is treated by its citizens as rightfully holding and exercising political power.” (Gilley 2006
[29]:500). “Legitimacy is an endorsement of the state by citizens at a moral or normative level”.
The function of state legitimacy, as surveyed by Peter (2010 [33]), gives lead to a political economy
of famines based on consideration for state. First, legitimacy brings political authority and trust
in state. This trust is the basis of a better ability of institutions to protect citizens. In deed, state
legitimacy increases its power to act. However, this is not independent of a second feature of state
legitimacy that is the respect of social contract, reflecting how close the state is to society. Third,
state legitimacy decreases the risk of shocks leading to famine, especially the likelihood of civil
wars: trust in institutions build peace (Blattman and Miguel (2010) [34]). These channels might
be considered as independent of political regime. However, according to Bratton and Chang (2006
[32]), we prefer an assumption of complementarity of state legitimacy and political regime, both
an institutional variable, but not against political regimes.
How to measure State Legitimacy There are three major ways to measure state
legit-imacy (see Gaus (2011) [35] for a detailed review). First, survey-based analysis focusses on the
public opinion on state legitimacy. For instance Bratton and Chang (2006 [32]) use results of
Afro-Barometer 2002 to analyze the link between state building and democratization. Second, there is
a behavioral approach, stating that contestation behaviors mean a lower state legitimacy. Third,
an approach focusses on the change of legitimation discourses of politicians as a way to define
le-gitimacy. All these approaches refer to political legitimacy as “some benchmark of acceptability or
justification of political power or authority and - possibly - obligation” (Peter (2010) [33]), but based
on individual beliefs (Gaus (2011) [35]). Englebert (2000 [8]:72) provides an interesting alternative,
using historical and ethnic background of a country to define its legitimacy. Two dimensions are
stressed. Vertical legitimacy refers to the co-building of state and society, that shed light on state
consistency. Figure 1 presents the construction such an index. The second dimension is horizontal
legitimacy, that is the ethnic fragmentation inside the country, i.e. an index of the consistency
of borders definition. Hence Englebert’s database on state legitimacy is more likely to catch the
Figure 1: State Vertical Legitimacy - Decision Tree
Source: Englebert 2001 ([8])
To the best of our knowledge, Englebert (2000 [8]) is the only one testing the relevance of state
legitimacy for economical issues. Empirically, Englebert (2000 [8]) provides evidences of the interest
of state capacity to explain cross-country variations.
Concerning the introduction of state in a political economy of famines, an estimation is provided
by Plumper and Neumayer (2009 [1]). However, they use gross national product of state as a
proxy for state capacity: hence the data refers more to an economical power of states than to its
effectiveness. Our study is the first to introduce statehood consideration in an economic analysis
3
State legitimacy and famines: empirical investigation
3.1
Data
3.1.1 Data bases
We use a sample of 36 Sub-Saharan countries5
from 1980 to 2005. Six databases are merged. The
dataset is balanced.
Dependent variables are computed from the Emergency Disasters DataBase (EM-DAT)
pro-vided by the World Health Organization Collaborating Centre for Research on the Epidemiology
of Disasters (CRED). The particular interest of this base is that even smaller famines are included.
These data are computed from many different sources and are the most accurate and the largest
available. We use both count of deaths and count of people affected6
to generate a dummy variable:
each time at least one people is affected by famine, we define the event as a famine. First, famine
occurrence is a dummy variable by country and by year : 126 famines occurred during the period.
The second dependent variable is the number of years of famine during the period.
Institutional variables on statehood and political regimes are computed from two bases.
En-glebert provides a dataset on state legitimacy. These variables do not vary during the period.
Vertical legitimacy’s computation is presented in figure 1. Horizontal legitimacy variable is equal
to 1 minus the percentage of a country’s population belonging to an ethnic group that was divided
into, at least, two countries, after the decolonization. The types of regime is provided by Polity
IV data base. Polity IV is a project on political regime characteristics, founded by Ted Gurr and
directed by Monty G. Marshall. According to the Code book, the interest of this base is “ that it
examines concomitant qualities of democratic and autocratic authority in governing institutions,
rather than discreet and mutually exclusive forms of governance”. Interaction variables of shocks
and institutions are computed from dummy for horizontal legitimacy - the dummy is equal to one if
the variable is superior or equal to 75%7
- and for democracy - the dummy equals 1 when the index
5Countries of the sample are: Angola, Benin, Botswana, Burkina Faso, Burundi, Cameroon, Central African
Republic, Chad, Congo (former Congo Brazzaville), Democratic Republic of Congo (former Congo Kinchasa), Cote d’Ivoire, Eritrea, Ethiopia, Ghana, Guinea, Kenya, Lesotho, Liberia, Madagascar, Malawi, Mali, Mauritania, Mozam-bique, Namibia, Niger, Nigeria, Senegal, Somalia, South Africa, Sudan, Swaziland, Tanzania, Togo, Uganda, Zambia, Zimbabwe.
6People affected are “people requiring immediate assistance during a period of emergency; it can also include
displaced or evacuated people.”, according to EM-DAT glossary.
is superior or equal to 58
. In deed, theses interaction variables describes the reactions to a shock
differentiated by the fact that the government is democratic and by the fact that state is horizontal
legitimate.
The other interest variables are variables of negative shocks : droughts and war, that are
commonly considered as determinants of famines9
. To define drought, we use the National Rainfall
Index, that is the national average of the total annual precipitation weighted by its long-term
average, computed by the United Nations Divisions for Sustainable Development. We check its
robustness with an index that is richer but available for a smaller sample Palmer Drought Severity
Index (PDSI)10
. This index is an algorithm of soil moisture, and is computed using precipitation
and temperature data, as well as the local Available Water Content (AWC) of the soil11
. We derive
two notions of drought. The “National Rainfall Drought” is computed from a standardized anomaly
index for the country iat year j, and µand σ the mean and the standard errors of the National
Rainfall Index (NRI).
SAIi,j=
N RIi,j−µi
σi
There is a drought whenSAIi,j<−1.Similarly, a standardized anomaly index is computed for the Palmer index.
To measure international and civil wars, we use the Uppsala Conflict Data Program (UCDP)
at the Department of Peace and Conflict Research, Uppsala University and Centre for the Study
of Civil War at the International Peace Research Institute, Oslo (PRIO). According to the data
presentation, “the dataset has been widely used since it was first made available, both by researchers
and policy makers” (e.g. Collier (2003) [39]; Miguel (2004) [40]; and Wolfson (2004) [41])”.
Per capita income is controlled using a database provided by World Bank, computing the
pur-chasing power parity by country in current USD.
8This is the specification used by E. Miguel, S. Satyanath, E. Sergenti. (2004) [36]
9The ‘war famines’ are Angola 1974/6, 1993/4, 2001/2; Zaire 1977/8, 1997; Liberia 1992/3; Sierra Leone 1995/8,
according to Devereux and Howe (2002) [15]
10As Dubresson et al. (1994) [37] argues, level of precipitation is not efficient to measure drought.
3.1.2 Summary statistics
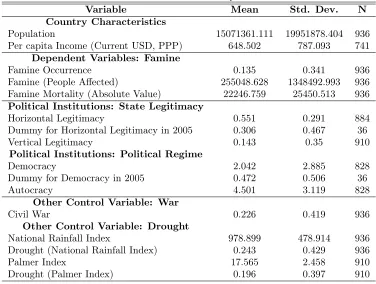
Table 3 provides summary statistics. Approximately 13% of the countries of the sample go through
a famine each year. In 2005, the mean number of years of famines is 3.5, with a standard deviation
of 2.54. The mean horizontal legitimacy is 55.1% : in each country, 45% of the population belong
in mean to ethnic groups that are divided into at least two countries. 30.5 % of the countries are
hence horizontal legitimate. Only 14% of the sample is vertical legitimate. The index of democracy
is very low in mean, but we have to take account of its improvement during the period. In 2005,
47% of the countries are democratic, this figure was only 19% in 1980. The mean drought is 24.3%
[image:16.612.90.466.302.586.2]considering NRI deviation, and 19.6 % considering (on a lower sample) Palmer drought.
Table 3: Summary Statistics
Variable Mean Std. Dev. N
Country Characteristics
Population 15071361.111 19951878.404 936
Per capita Income (Current USD, PPP) 648.502 787.093 741 Dependent Variables: Famine
Famine Occurrence 0.135 0.341 936
Famine (People Affected) 255048.628 1348492.993 936
Famine Mortality (Absolute Value) 22246.759 25450.513 936 Political Institutions: State Legitimacy
Horizontal Legitimacy 0.551 0.291 884
Dummy for Horizontal Legitimacy in 2005 0.306 0.467 36
Vertical Legitimacy 0.143 0.35 910
Political Institutions: Political Regime
Democracy 2.042 2.885 828
Dummy for Democracy in 2005 0.472 0.506 36
Autocracy 4.501 3.119 828
Other Control Variable: War
Civil War 0.226 0.419 936
Other Control Variable: Drought
National Rainfall Index 978.899 478.914 936
Drought (National Rainfall Index) 0.243 0.429 936
Palmer Index 17.565 2.458 910
Drought (Palmer Index) 0.196 0.397 910
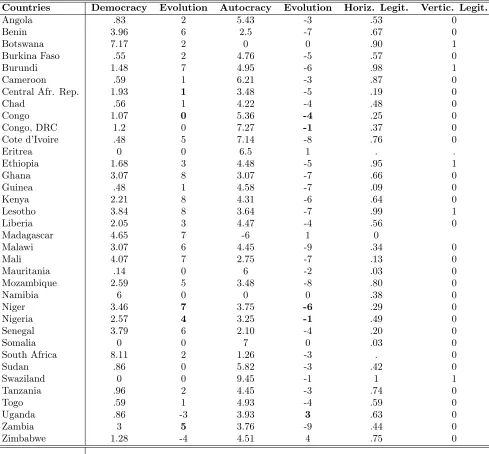
Table 4 provides more accurate descriptive statistics on institutional variables, comparing
state-hood variables to political regime and its evolution during the period12
. A first observation is the
large dispersion of the political variables in the sample, both concerning government quality and
statehood. It means that differentiating the countries by these institutional variables makes sense.
Moreover, it is interesting to compare political regime and statehood quality. For instance, amongst
the 12 countries that are horizontal legitimate (score > 75%), only 4 are democracies : Botswana,
Lesotho, Madagascar and South Africa. On the contrary, democratic countries of 2005 that do
not have high horizontal legitimacy are Congo (former Congo-Brazzaville), Malawi, Mali, Namibia,
Table 4: Summary Statistics for Political Variables from 1980 to 2005
Countries Democracy Evolution Autocracy Evolution Horiz. Legit. Vertic. Legit.
Angola .83 2 5.43 -3 .53 0
Benin 3.96 6 2.5 -7 .67 0
Botswana 7.17 2 0 0 .90 1
Burkina Faso .55 2 4.76 -5 .57 0
Burundi 1.48 7 4.95 -6 .98 1
Cameroon .59 1 6.21 -3 .87 0
Central Afr. Rep. 1.93 1 3.48 -5 .19 0
Chad .56 1 4.22 -4 .48 0
Congo 1.07 0 5.36 -4 .25 0
Congo, DRC 1.2 0 7.27 -1 .37 0
Cote d’Ivoire .48 5 7.14 -8 .76 0
Eritrea 0 0 6.5 1 . .
Ethiopia 1.68 3 4.48 -5 .95 1
Ghana 3.07 8 3.07 -7 .66 0
Guinea .48 1 4.58 -7 .09 0
Kenya 2.21 8 4.31 -6 .64 0
Lesotho 3.84 8 3.64 -7 .99 1
Liberia 2.05 3 4.47 -4 .56 0
Madagascar 4.65 7 -6 1 0
Malawi 3.07 6 4.45 -9 .34 0
Mali 4.07 7 2.75 -7 .13 0
Mauritania .14 0 6 -2 .03 0
Mozambique 2.59 5 3.48 -8 .80 0
Namibia 6 0 0 0 .38 0
Niger 3.46 7 3.75 -6 .29 0
Nigeria 2.57 4 3.25 -1 .49 0
Senegal 3.79 6 2.10 -4 .20 0
Somalia 0 0 7 0 .03 0
South Africa 8.11 2 1.26 -3 . 0
Sudan .86 0 5.82 -3 .42 0
Swaziland 0 0 9.45 -1 1 1
Tanzania .96 2 4.45 -3 .74 0
Togo .59 1 4.93 -4 .59 0
Uganda .86 -3 3.93 3 .63 0
Zambia 3 5 3.76 -9 .44 0
Zimbabwe 1.28 -4 4.51 4 .75 0
Table 5 provides correlation between the political concepts. Obviously, the variables are close
by subgroups refering to the same political concept, political regime on one hand, statehood on the
other hand, but they are not highly correlated with the other type of institutional variable. Hence,
quality.
Table 5: Correlation between Political Variables
Democracy Autocracy Horizontal Legitimacy Vertical Legitimacy
Democracy 1
Autocracy -.8639∗∗∗ 1
Horizontal Legitimacy .0738∗∗ .0202 1
Vertical Legitimacy .0834∗∗ .0417 .5905∗∗∗ 1
∗p <0.05,∗∗p <0.01,∗∗∗p <0.001
One main issue concerning this sample is the choice of Sub-Saharan countries, that are both
famine-prone countries and more likely to be politically vulnerable. This choice of countries is first
related to their vulnerability to famines than countries from other regions : following Sarracino
(2010 [42]), we remind that the research on famines explanation have to have an applied goal, that
is preventing famines. Second, these countries are chosen because they are still democracies under
construction, and because state legitimacy is highly dispersed. Third, their vulnerability to famines
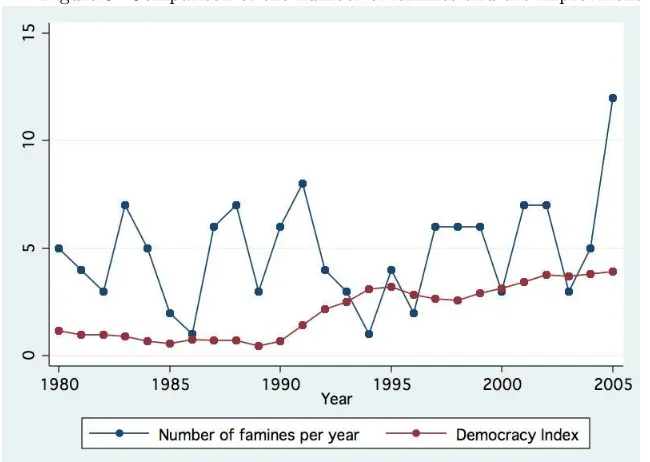
might increase, sharpening the emergency to understand famines in this region of the world. Even
though the number of droughts per year is decreasing in our sample of Sub-Saharan countries (figure
2), the trend is upward (Paeth et al. (2009)[43]). This apparent paradox can be explain by the
fact that from 1980 to 1984, Africa knew sharp droughts, followed by a period of increasing rainfall
amount (FAO (1996) [44]) This drying trend have two consequences: a change in land use and the
increase in migrations, both stressing vulnerability of population. These three arguments, however,
might lead to a selection bias within the sample, famines increasing the likelihood to become an
autocratic regime or an unlegitimate state. However, data on statehood are only computed with
social history of states, featuring parameters that are not influenced by health crisis - such as reaction
to decolonization. Moreover, we observe on the period both an improvment of political regimes and
an increase in the number of famines. Therefore, reverse causality with famines decreasing this
Figure 2: The shift of climatological environment
Source : National Rainfall Index
[image:20.612.91.416.405.636.2]3.2
An estimation of famine occurrence
3.2.1 Empirical design: logit with panel data
Our first goal is to measure the impact of political variable on the likelihood of famines occurrence.
Controlling for shocks increasing the likelihood of famines and for income increasing entitlement,
we focus on the political variables, and their interaction with shocks variables.
3.2.2 Results
The results of a logit regression on famine occurrence is presented table 3. Two types of robustness
controls are used: robust standard errors for each regression, and country fixed effects (columns (2),
(4) and (6)). The significant coefficients of the regression have the expected signs and interesting
magnitudes. Per capita income has no impact on famine occurrence. The level of precipitation
has a negative impact on famine occurrence: the coefficient is significant at 99 percent confidence
and doesn’t vary with the addition of new variables. A famine is more likely to occur when there
is a civil war the same year at 90 percent confidence (columns (1) and (5)). Vertical legitimacy
has a highly negative impact on famine occurrence, taking acount of country fixed effects. Even
though non significant, we observe a negative impact of the quality of political regime on famine
occurrence. The impact of political variables on famines when a civil war occurs has the expected
negative sign, although non significant.
However, we suspect endogeneity of the civil war variable. Although omitted variable might lead
to a correlation between error term and civil war, the main factor of endogeneity here is simultaneity
of famines and civil wars. Some authors argue that there are “civil war famines” (Devereux and
Howe (2002) [15]), but the contrary is also likely: famines might lead to famines riots, that can
degenerate into civil wars. Hence, we use an instrumental variable, the lagged civil war. Lagged civil
war is a good instrument, because of a hight correlation with present civil war, and no correlation
with famines13
. We estimate the model with this lagged variable (Table 7) and we run Hausman
tests on each regression to compare the instrumental regression to the previous. Except for the first
equation (column (1)) run without country fixed effect, we find that civil war is exogenous : the
13To check the interest of this standard instrument in panel regression, we run two regressions. First, civil war is
model with an instrument is also consistent, and theH0 assumption of non systematic difference
between IV and regular model is satisfied.
This first empirical investigation provides evidences for the analysis, but the global significance
of the model is disappointing. Some trends, due to the nature of the sample (panel data) may be
hidden with a linear model.
The same model is estimated with a logit on panel data, on Table 8. Signs and magnitude of
estimated coefficients are similar to previous estimation. The level of precipitation is still significant
and negative with the same magnitude than previously. Signs and magnitude of coefficients are
similar using palmer index instead of National Rainfall Index, however non globally significant (see
table 16). A famine is still more likely to occur during a civil war. The coefficients associated
to state legitimacy are significantly negative taking account of country fixed effects. Even though
non significant, the coefficient associated to political regime is also negative : increasing by one
the index of good quality of regime decreases the likelihood of famine. Interaction variable are
non significant, but have the expected sign, except for the interaction of civil war and horizontal
legitimacy. However, the z-scores associated are so low that we can’t conclude.
Like in previous estimation, we suspect endogeneity of the civil war variable. We estimate the
model with lagged civil war (table 9) and we observe the same negative effect of National Rainfall
Index and civil wars on famine occurrence. Political variables are less certain. When asymptotic
assumption is filled out, Hausman test have low chi2 scores, except for the last specification (column
7). Therefore, the regular model is consistent as well : civil war is considered as exogenous.
3.3
Adding a dynamic dimension: accumulating famines
3.3.1 Empirical design and interest
As each of the state went throught at least one famine during the 1980-2005 period, the role of
political variable might be lowered considering the unique event of a famine occurring. Hence, we
use a second variable of interest, more likely to represent the intensity of famine risk. This section
focusses on the repetition and cumulation of events, with an other way to measure famines. A
count variable is created: the accumulation of famines during the selected period (1980-2005). The
interpretation is as follows: controlling for shocks, political variables might impact this count. A
Table 6: Logit on Famine Occurrence
(1) (2) (3) (4) (5) (6)
Per Capita Income 0.0000378 -0.000158 0.0000455 -0.000193 0.0000598 -0.000208
(0.23) (-0.27) (0.28) (-0.32) (0.36) (-0.35)
NRI -0.00103∗∗∗ -0.00391∗∗ -0.00103∗∗∗ -0.00399∗∗ -0.000972∗∗∗ -0.00321
(-3.73) (-2.79) (-3.69) (-2.84) (-3.50) (-1.93)
Civil War 0.651∗ 0.162 0.810∗ 0.179 0.813∗ 0.238
(2.28) (0.33) (2.11) (0.22) (2.09) (0.29)
Horizontal Legitimacy 0.222 0.609 0.314 1.319 0.0661 0.149
(0.61) (0.47) (0.69) (0.85) (0.11) (0.08)
Vertical Legitimacy -0.0240 -4.823∗ -0.0274 -5.736∗∗ 0.0703 -3.991
(-0.05) (-2.46) (-0.05) (-2.93) (0.12) (-1.56)
Democracy -0.0835 -0.0323 -0.0803 -0.0109 -0.105 -0.0368
(-1.69) (-0.47) (-1.49) (-0.14) (-1.81) (-0.42)
Civil War * Horizontal Legitimacy -0.247 0.753 -0.0252 0.802
(-0.33) (0.63) (-0.03) (0.66)
Civil War * Vertical Legitimacy -0.259 -1.543 -0.419 -1.615
(-0.24) (-1.06) (-0.37) (-1.09)
Civil War * Democracy -0.0243 -0.0226 -0.0354 -0.0379
(-0.21) (-0.17) (-0.30) (-0.26)
Drought * Horizontal Legitimacy 0.525 0.217
(1.03) (0.36)
Drought * Democracy 0.0893 0.0703
(0.96) (0.62)
Constant -0.987∗∗ 3.571 -1.034∗∗ 3.665∗ -1.100∗∗ 2.755
(-2.75) (1.94) (-2.77) (1.97) (-2.92) (1.32)
Robust Standard Errors Yes Yes Yes Yes Yes Yes
Country Fixed Effect No Yes No Yes No Yes
Wald Test 20.25∗∗∗ 54.64∗∗∗ 21.16∗∗ 57.67∗∗∗ 23.33∗∗ 61.06∗∗∗
Log-Likelihood -209.652 -186.792 -209.426 -186.120 -207.613 -185.699
2
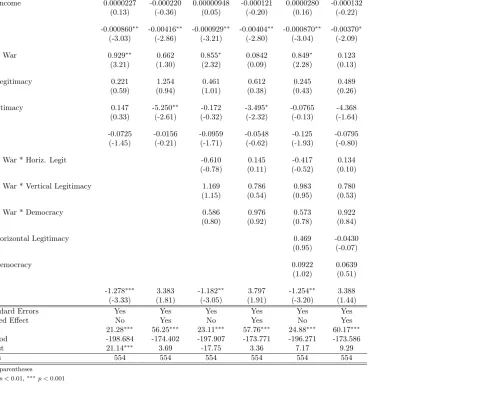
Table 7: Logit on Famine Occurrence - Instrument: Lagged civil war
(1) (2) (3) (4) (5) (6)
Per Capita Income 0.0000227 -0.000220 0.00000948 -0.000121 0.0000280 -0.000132
(0.13) (-0.36) (0.05) (-0.20) (0.16) (-0.22)
NRI -0.000860∗∗ -0.00416∗∗ -0.000929∗∗ -0.00404∗∗ -0.000870∗∗ -0.00370∗
(-3.03) (-2.86) (-3.21) (-2.80) (-3.04) (-2.09)
Lagged Civil War 0.929∗∗ 0.662 0.855∗ 0.0842 0.849∗ 0.123
(3.21) (1.30) (2.32) (0.09) (2.28) (0.13)
Horizontal Legitimacy 0.221 1.254 0.461 0.612 0.245 0.489
(0.59) (0.94) (1.01) (0.38) (0.43) (0.26)
Vertical Legitimacy 0.147 -5.250∗∗ -0.172 -3.495∗ -0.0765 -4.368
(0.33) (-2.61) (-0.32) (-2.32) (-0.13) (-1.64)
Democracy -0.0725 -0.0156 -0.0959 -0.0548 -0.125 -0.0795
(-1.45) (-0.21) (-1.71) (-0.62) (-1.93) (-0.80)
Lagged Civil War * Horiz. Legit -0.610 0.145 -0.417 0.134
(-0.78) (0.11) (-0.52) (0.10)
Lagged Civil War * Vertical Legitimacy 1.169 0.786 0.983 0.780
(1.15) (0.54) (0.95) (0.53)
Lagged Civil War * Democracy 0.586 0.976 0.573 0.922
(0.80) (0.92) (0.78) (0.84)
Drought * Horizontal Legitimacy 0.469 -0.0430
(0.95) (-0.07)
Drought * Democracy 0.0922 0.0639
(1.02) (0.51)
Constant -1.278∗∗∗ 3.383 -1.182∗∗ 3.797 -1.254∗∗ 3.388
(-3.33) (1.81) (-3.05) (1.91) (-3.20) (1.44)
Robust Standard Errors Yes Yes Yes Yes Yes Yes
Country Fixed Effect No Yes No Yes No Yes
Wald-Test 21.28∗∗∗ 56.25∗∗∗ 23.11∗∗∗ 57.76∗∗∗ 24.88∗∗∗ 60.17∗∗∗
Log-Likelihood -198.684 -174.402 -197.907 -173.771 -196.271 -173.586
Hausman test 21.14∗∗∗ 3.69 -17.75 3.36 7.17 9.29
Observations 554 554 554 554 554 554
statistics in parentheses
2
Table 8: Logit on Panel Data - Famine Occurrence Equal correlation model
(1) (2) (3) (4) (5) (6) (7)
Per Capita Income -0.000119 0.0000211 -0.000183 0.0000312 -0.000219 0.0000435 -0.000231
(-0.24) (0.13) (-0.31) (0.19) (-0.37) (0.26) (-0.40)
NRI -0.00372∗∗∗ -0.00108∗∗∗ -0.00393∗∗∗ -0.00106∗∗∗ -0.00401∗∗∗ -0.000994∗∗ -0.00322
(-3.66) (-3.64) (-3.66) (-3.32) (-3.79) (-2.85) (-1.95)
Democracy -0.0331 -0.0750 -0.0322 -0.0709 -0.0106 -0.0935 -0.0387
(-0.63) (-1.74) (-0.57) (-1.44) (-0.17) (-1.65) (-0.58)
Horizontal Legitimacy .261 0.213 -2.880∗∗∗ 0.263 -3.417∗∗ -0.0147 -2.904∗
( 0.70 ) (0.61) (-3.35) (0.57) (-2.97) (-0.03) (-2.28)
Vertical Legitimacy -.170 -0.0373 -1.553∗∗∗ 0.0191 -1.206∗∗∗ 0.155 0.849
(-0.31 ) (-0.08) (-5.96) (0.03) (-3.94) (0.21) (0.90)
Civil War 0.584 0.166 0.746∗ 0.195 0.747∗ 0.250
(1.87) (0.32) (2.14) (0.26) (2.14) (0.33)
Civil War * Horizontal Legitimacy -0.143 0.724 0.0963 0.773
(-0.22) (0.84) (0.14) (0.85)
Civil War * Vertical Legitimacy -0.441 -1.521 -0.650 -1.588
(-0.56) (-1.32) (-0.71) (-1.28)
Civil War * Democracy -0.0260 -0.0227 -0.0386 -0.0373
(-0.27) (-0.20) (-0.40) (-0.30)
Drought * Horizontal Legitimacy 0.524 0.202
(0.91) (0.26)
Drought * Democracy 0.0896 0.0753
(1.00) (0.56)
Constant -0.923∗ 3.615∗∗ -0.991∗ 3.695∗∗ -1.071∗ 2.772
(-2.52) (2.82) (-2.46) (2.91) (-2.53) (1.46)
Convergence Yes Yes No Yes No Yes No
Robust Standard Errors Yes Yes Yes Yes Yes Yes Yes
Country Fixed Effect No No Yes No Yes No Yes
Wald-Test 21.55∗∗∗ 25.89∗∗∗ 4809.83∗∗∗ 49.28∗∗∗ 5346.33∗∗∗ 34.87∗∗∗ 4195.43∗∗∗
Observations 488 554 554 554 554 554 554
2
Table 9: Logit on Panel Data - Famine Occurrence - Lagged Civil War
(1) (2) (3) (4) (5) (6) (7)
Per Capita Income 0.00000299 0.00000933 -0.000254 -0.00000219 -0.000156 0.0000125 -0.000165
(0.02) (0.06) (-0.32) (-0.01) (-0.20) (0.08) (-0.22)
NRI -0.00114∗∗∗ -0.000918∗∗ -0.00418∗∗∗ -0.000974∗∗ -0.00406∗∗∗ -0.000910∗∗ -0.00372∗
(-3.46) (-2.97) (-3.70) (-3.08) (-3.64) (-2.71) (-2.10)
Horizontal Legitimacy 0.261 0.213 -8.912∗∗∗ 0.438 -3.422∗ 0.210 -3.117
(0.70) (0.61) (-8.38) (0.95) (-2.49) (0.36) (-1.76)
Vertical Legitimacy -0.170 0.144 6.538∗∗∗ -0.164 -1.007∗∗ -0.0468 -1.060∗∗
(-0.31) (0.28) (6.03) (-0.28) (-3.09) (-0.08) (-3.05)
Democracy -0.0718 -0.0655 -0.0150 -0.0912 -0.0546 -0.118∗ -0.0811
(-1.64) (-1.53) (-0.26) (-1.94) (-0.93) (-2.06) (-1.13)
Lagged Civil War 0.882∗∗ 0.664 0.798∗ 0.0922 0.784∗ 0.132
(3.27) (1.89) (2.09) (0.12) (2.05) (0.17)
Lagged Civil War * Horiz. Legit -0.570 0.126 -0.368 0.121
(-0.92) (0.15) (-0.61) (0.14)
Lagged Civil War * Vertical Legitimacy 1.134∗ 0.805 0.922 0.797
(1.99) (1.04) (1.74) (1.00)
Lagged Civil War * Democracy 0.607 0.979 0.584 0.931
(0.90) (1.14) (0.97) (1.07)
Drought * Horizontal Legitimacy 0.452 -0.0590
(0.77) (-0.07)
Drought * Democracy 0.0929 0.0686
(1.03) (0.46)
Constant -0.709 -1.219∗∗ 3.432∗ -1.128∗ 3.842∗ -1.204∗∗ 3.428
(-1.53) (-2.86) (2.33) (-2.54) (2.25) (-2.63) (1.39)
Convergence Yes Yes No Yes No Yes No
Robust Standard Errors Yes Yes Yes Yes Yes Yes Yes
Country Fixed Effect No No Yes No Yes No Yes
Wald-Test 21.55∗∗∗ 34.71∗∗∗ 4637.07∗∗∗ 76.04∗∗∗ 5231.99∗∗∗ 104.06∗∗∗ 4742.72∗∗∗
Hausman test 6.54 -412.51 7.75 -927.83 11.57 27312.82∗∗∗
Observations 488 554 554 554 554 554 554
t statistics in parentheses
∗p <0.05,∗∗ p <0.01,∗∗∗p <0.001
2
Because it is a count variable, we use count models to estimate the impact of political variables.
3.3.2 Results
The distribution of the count variable helps choosing the best model. Poisson regression has one
strong assumption, the equality of mean and variance λ.Statistically, the count varies from 0 to
10, with a 1.88 mean and a 3.93 variance: there is an overdispersion of data. The distribution of
the cumulative sum of famines across year is very likely to follow a negative binomial process (see
[image:27.612.93.421.276.515.2]figures 4 and 5).
Figure 5: Frequency of the number of cumulated famines (Negative binomial Projection)
Because of this overdispersion of data we run a negative binomial regression14
, presented table
10. It is more likely to fit the data. Two types of robustness controls are used: robust standard
errors for each regression and country fixed effects ((2), (4) and (6)). As expected, shocks variables
have a negative impact on famines: lower precipitations or a civil war during one year increases
the number of years of famines. The direct effect of state legitimacy is significantly negative and
have a higher magnitude than the shocks variables. Surprisingly, political regime quality has a
positive coefficient, but its interaction with shocks remains negative and of higher magnitude than
the direct effect: hence, we can say that a political regime is not in itself a good factor of prevention
of famine, but acts positively when there is a shock. We check civil war endogeneity running a
model with lagged civil wars (table 11). Hausman tests have different behaviors. Some are weakly
positive (column 1 and 3), some are strongly positive but related to a non convergent estimation
(column 2), or strongly negative (columns 4 and 6), meaning that the model fitted fails to meet
asymptotic assumption. These outcomes invite us to stay cautious with the results. Moreover, the
panel dimension is not taken into account.
Therefore we run a negative binomial regression for panel data (table 12). Results hold with this
specification: horizontal legitimacy and democracy have a significant and negative impact on the
number of years of famines during the period, controling for shocks and with country fixed effects. A
country is less likely to accumulate famines in the long run when its state effectiveness is higher and
when its political regime quality increases. The coefficients do not help to determine a higher effect
of state legitimacy or of political regime. They help showing the interest of a political concept that
is broader than political regime: state effectiveness matters significantly. Interestingly, civil war
coefficient is lowered taking account of the longitudinal dimension. Hence, in the long run, political
variables matter more. Like in previous regressions, we control for endogeneity of civil war, running
a regression with lagged civil war (table 13). The Hausman tests are balanced. Some are weakly
positive or negative (columns 1, 3 and 6), but adding country fixed effect leads to a clear conclusion
of endogeneity of civil war. Hence, we prefer to interpret the instrumental model. We focus on
the columns 3 and 5, that are convergent estimations with interaction variables. The impact of a
drought is still the same, significantly negative. Per capita income still have no significant impact
on famine. Lagged civil war increases the number of year of famines at current year. Interestingly,
the coefficient associated to the interaction between horizontal legitimacy and lagged civil war
has the same magnitude with opposite sign : the effect of a civil war is cancelled when the state is
horizontal legitimate. Surprisingly, the coefficient associated to democracy is positive. Nevertheless,
this effect is ten times lower than its association with civil war. We explain the positive coefficient
of vertical legitimacy by the fact that Ethiopia, that is vertical legitimate, is also the country that
Table 10: Negative Binomial Regression - Dependent Variable: Accumulation of Famines
(1) (2) (3) (4) (5) (6)
Per Capita Income -0.00000279 -0.0000334 0.0000161 -0.000135 0.0000111 -0.000133
(-0.07) (-0.28) (0.41) (-1.25) (0.28) (-1.23)
NRI -0.000725∗∗∗ 0.0000676 -0.000784∗∗∗ 0.000106 -0.000790∗∗∗ 0.0000924
(-7.79) (0.29) (-8.86) (0.48) (-9.01) (0.31)
Civil War 0.450∗∗∗ -0.173 0.894∗∗∗ 0.407 0.889∗∗∗ 0.391
(4.03) (-1.57) (7.04) (1.89) (7.02) (1.82)
Horizontal Legitimacy -0.0389 -1.382∗∗∗ 0.229∗ -0.943∗∗∗ 0.222 -0.997∗∗∗
(-0.36) (-5.55) (2.02) (-3.58) (1.68) (-3.37)
Vertical Legitimacy -0.0130 -2.112∗∗ -0.317 -2.332∗∗∗ -0.316 -2.292∗∗∗
(-0.08) (-3.00) (-1.91) (-3.56) (-1.95) (-3.45)
Democracy 0.0322∗∗ 0.0782∗∗∗ 0.0545∗∗∗ 0.119∗∗∗ 0.0625∗∗∗ 0.124∗∗∗
(2.77) (4.73) (4.57) (10.16) (4.40) (9.78)
Civil War * Horizontal Legitimacy -1.098∗∗∗ -0.700∗∗ -1.109∗∗∗ -0.681∗∗
(-4.98) (-2.73) (-4.96) (-2.66)
Civil War * Vertical Legitimacy 1.287∗∗ 0.811∗∗ 1.297∗∗ 0.791∗∗
(3.00) (2.65) (3.03) (2.58)
Civil War * Democracy -0.166∗∗∗ -0.150∗∗∗ -0.161∗∗∗ -0.146∗∗∗
(-4.89) (-5.76) (-4.80) (-5.87)
Drought * Horizontal Legitimacy -0.00774 0.0965
(-0.05) (0.81)
Drought * Democracy -0.0342 -0.0184
(-1.74) (-1.22)
Constant 0.992∗∗∗ 1.340∗∗∗ 0.939∗∗∗ 0.852∗ 0.952∗∗∗ 0.875∗
(8.33) (4.52) (8.24) (2.52) (8.43) (2.14)
Convergence Yes Yes Yes Yes Yes Yes
Robust Standard Errors Yes Yes Yes Yes Yes Yes
Country Fixed Effect No Yes No Yes No Yes
Wald 116.71∗∗∗ . 198.71∗∗∗ . 202.65∗∗∗ .
Log Likelihood -893.271 -673.213 -869.326 -655.220 -868.246 -654.892
Observations 554 554 554 554 554 554
statistics in parentheses
2
Table 11: Negative Binomial Regression - Dependent Variable: Accumulation of Famines Lagged Civil War
(1) (2) (3) (4) (5) (6)
Per Capita Income -0.00000968 -0.0000589 0.00000281 -0.000139 -0.00000272 -0.000134
(-0.24) (-0.51) (0.07) (-1.27) (-0.07) (-1.21)
NRI -0.000702∗∗∗ 0.0000535 -0.000799∗∗∗ 0.0000101 -0.000808∗∗∗ -0.0000970
(-7.64) (0.24) (-8.90) (0.05) (-9.11) (-0.35)
Lagged Civil War 0.511∗∗∗ -0.101 0.834∗∗∗ 0.466∗ 0.830∗∗∗ 0.450∗
(4.88) (-1.06) (6.92) (2.38) (6.92) (2.31)
Horizontal Legitimacy -0.0512 -1.287∗∗∗ 0.230∗ -0.798∗∗∗ 0.237 -0.905∗∗∗
(-0.48) (-5.34) (2.01) (-3.36) (1.81) (-3.44)
Vertical Legitimacy 0.0291 -2.116∗∗ -0.302 -0.440∗∗∗ -0.305 -0.441∗∗∗
(0.19) (-3.03) (-1.82) (-4.34) (-1.89) (-4.17)
Democracy 0.0296∗∗ 0.0759∗∗∗ 0.0481∗∗∗ 0.121∗∗∗ 0.0568∗∗∗ 0.127∗∗∗
(2.61) (4.68) (3.94) (10.76) (3.96) (10.48)
Lagged Civil War * Horiz. Legit -0.890∗∗∗ -0.467∗ -0.907∗∗∗ -0.463∗
(-4.46) (-1.97) (-4.47) (-1.97)
Lagged Civil War * Vertical Legitimacy 0.954∗∗ 0.197 0.980∗∗ 0.198
(2.74) (0.83) (2.80) (0.84)
Lagged Civil War * Democracy -1.078∗∗∗ -1.247∗∗∗ -1.052∗∗∗ -1.211∗∗∗
(-5.46) (-6.50) (-5.42) (-6.78)
Drought * Horizontal Legitimacy -0.0593 0.0345
(-0.38) (0.34)
Drought * Democracy -0.0374 -0.0213
(-1.90) (-1.50)
Constant 0.994∗∗∗ 1.300∗∗∗ 0.991∗∗∗ 0.793∗∗ 1.008∗∗∗ 0.924∗∗
(8.50) (4.73) (8.61) (2.73) (8.85) (2.59)
Convergence Yes No Yes No Yes Yes
Robust Standard Errors Yes Yes Yes Yes Yes Yes
Country Fixed Effect No Yes No Yes No Yes
Wald Test 119.29∗∗∗ . 187.63∗∗∗ . 195.35∗∗∗ .
Log-Likelihood -864.393 -648.088 -843.097 -629.679 -841.401 -629.326
Hausman Test 14.87∗∗ 643939.68∗∗∗ 9.37∗ -12161.20 6.97 -15243.53
3
Table 12: Estimation of Famines Accumulation - Negative Binomial Regression with Panel Data
(1) (2) (3) (4) (5) (6)
Per Capita Income -0.0000136 -0.0000613 -0.0000441 -0.000123 -0.0000473 -0.000124
(-0.09) (-0.29) (-0.30) (-0.63) (-0.33) (-0.63)
NRI -0.000265 -0.0000230 -0.000267 0.0000576 -0.000388∗ 0.0000869
(-1.60) (-0.09) (-1.57) (0.23) (-2.06) (0.27)
Civil War -0.0816 -0.140 0.507∗ 0.520∗ 0.479∗ 0.514∗
(-0.53) (-0.59) (2.49) (2.22) (2.40) (2.20)
Horizontal Legitimacy -0.197 -1.648∗∗∗ -0.219 -0.850∗∗ -0.216 -0.871∗∗
(-0.55) (-7.08) (-0.56) (-2.91) (-0.54) (-2.65)
Vertical Legitimacy 0.288 -1.820∗∗∗ 0.272 -2.595∗∗∗ 0.248 -2.577∗∗∗
(0.53) (-8.90) (0.51) (-9.00) (0.46) (-7.96)
Democracy 0.0829∗ 0.103∗∗∗ 0.113∗∗∗ 0.115∗∗∗ 0.122∗∗∗ 0.119∗∗∗
(2.41) (4.33) (5.62) (4.72) (5.48) (4.61)
Civil War * Horizontal Legitimacy -0.885∗∗∗ -0.925∗∗∗ -0.868∗∗∗ -0.905∗∗∗
(-3.66) (-3.58) (-3.51) (-3.34)
Civil War * Vertical Legitimacy 0.958∗∗∗ 1.169∗∗ 0.952∗∗∗ 1.153∗∗
(4.31) (3.08) (4.19) (3.00)
Civil War * Democracy -0.152∗∗ -0.145∗∗∗ -0.144∗∗ -0.144∗∗∗
(-2.86) (-4.36) (-2.93) (-4.51)
Drought * Horizontal Legitimacy 0.0311 0.0892
(0.25) (0.61)
Drought * Democracy -0.0377∗∗ -0.0116
(-2.88) (-0.86)
Constant 0.582∗ 1.396∗∗∗ 0.454∗ 0.787∗ 0.577∗∗ 0.756
(2.46) (4.80) (2.27) (2.43) (2.79) (1.94)
Convergence Yes No Yes No Yes No
Robust Standard Errors Yes No Yes No Yes No
Country Fixed Effect No Yes No Yes No Yes
Wald Test 12.37∗ 2087.57∗∗∗ 857.73∗∗∗ 5504.59∗∗∗ 927.73∗∗∗ 7871.01∗∗∗
Observations 554 554 554 554 554 554
statistics in parentheses
3
Table 13: Negative Binomial Regression on Panel Data - Lagged Variable
(1) (2) (3) (4) (5) (6)
Per Capita Income -0.0000297 -0.0000867 -0.0000488 -0.000128 -0.0000543 -0.000124
(-0.20) (-0.42) (-0.30) (-0.63) (-0.35) (-0.61)
NRI -0.000246 -0.0000132 -0.000302 -0.0000389 -0.000469∗ -0.000127
(-1.59) (-0.05) (-1.79) (-0.16) (-2.48) (-0.40)
Lagged Civil War -0.0144 -0.0445 0.514∗∗ 0.498∗ 0.487∗∗ 0.490∗
(-0.11) (-0.22) (3.08) (2.16) (2.98) (2.13)
Horizontal Legitimacy -0.217 -1.512∗∗∗ -0.266 -0.755∗ -0.231 -0.837∗
(-0.62) (-6.80) (-0.67) (-2.47) (-0.57) (-2.53)
Vertical Legitimacy 0.331 -1.869∗∗∗ 0.391 -0.450∗∗∗ 0.343 -0.448∗∗∗
(0.62) (-9.23) (0.70) (-6.33) (0.61) (-5.83)
Democracy 0.0817∗ 0.101∗∗∗ 0.114∗∗∗ 0.115∗∗∗ 0.123∗∗∗ 0.120∗∗∗
(2.47) (4.71) (5.73) (5.21) (5.58) (5.10)
Lagged Civil War * Horiz. Legit -0.586∗∗ -0.626∗∗ -0.585∗∗ -0.625∗
(-2.71) (-2.62) (-2.72) (-2.55)
Lagged Civil War * Vertical Legitimacy 0.323 0.596 0.359 0.599
(1.36) (1.28) (1.50) (1.28)
Lagged Civil War * Democracy -1.207∗∗∗ -1.041∗∗∗ -1.151∗∗∗ -1.027∗∗∗
(-3.58) (-4.02) (-3.86) (-4.10)
Drought * Horizontal Legitimacy -0.0266 0.0132
(-0.20) (0.09)
Drought * Democracy -0.0381∗∗ -0.0167
(-2.66) (-1.18)
Constant 0.581∗∗ 1.305∗∗∗ 0.488∗ 0.802∗∗ 0.655∗∗ 0.905∗∗
(2.64) (5.06) (2.40) (2.67) (3.18) (2.59)
Convergence Yes No Yes No Yes No
Robust Standard Errors Yes Yes Yes Yes Yes Yes
Country Fixed Effect No Yes No Yes No Yes
Wald Test 11.06∗ 2131.68∗∗∗ 260.87∗∗∗ 3989.77∗∗∗ 1033.87∗∗∗ 7581.82∗∗∗
Hausman Test 0.04 111.92∗∗∗ -0.58 61.55∗∗∗ -8.00 276689.60∗∗∗
3
Table 14: Test of predicted probabilities for Poisson
Count Actual Poisson Diff. Poisson Negative Binomial Diff. Negative Binomial
0 .2701 .2677 -.0024 .2961 .0260∗∗∗
1 .2864 .2982 .0118∗∗∗ .2873 .0009
2 .1513 .2059 .0546∗∗∗ .1880 .0367∗∗∗
3 .1169 .1162 -.0007 .1068 -.0101∗∗∗
4 .0661 .0596 -.0065∗∗∗ .0576 -.0085∗∗∗
5 .0431 .0289 -.0142∗∗∗ .0305 -.0126∗∗∗
6 .0287 .0134 -.0153∗∗∗ .0161 -.0126∗∗∗
7 .0172 .0059 -.0113∗∗∗ .0084 -.0088∗∗∗
8 .0067 .0025 -.0042∗∗∗ .0044 -.0023∗∗∗
9 .0125 .0010 -.0115∗∗∗ .0023 -.0102∗∗∗
10 .0010 0 - 0
-Sum 1.1334 1.5993 .4259∗∗∗ 1.6042 .4708∗∗∗
Zstatistics in parentheses
∗p <0.05,∗∗p <0.01,∗∗∗p <0.001
A dispersed probabilities test doesn’t help to choose the model. However, as the results are
similar in sign, magnitude and significance, the interpretation helds.
3.3.3 Temporal autocorrelation
One last issue is the existence of temporal autocorrelation: health crisis increases the vulnerability of
a country. We run an Arellano-Bond estimation on the number of years of famines, with different
lags. Table 15 shows the results. A striking fact is the correlation between dependent variable
and its lagged values, from the first to the third - more lags doesn’t improve the quality of the
results. Despite this result, the interpretation of the results is quite the same than that of previous
estimations. National Rainfall Index still has a negative effect on the number of years of famines.
Per capita income, even with this dynamic consideration, have no impact on the number of years
of famines. The positive effect of civil war on the number of years of famine is more uncertain,
however non significant. When significant, institutional quality variable decreases the number of
years of famine: when there is a civil war, taking account of the country history, vertical legitimacy
of the state decreases the likelihood of a new famine occurrence. This effect is the same, however
non significant, for democracy index.
Hence, whatever the empirical strategy, institutional variables matter and have a significant
Table 15: Results of an Arellano-Bond Estimation with Robust Standard Errors
(1) (2) (3) (4) (5) (6) (7) (8) (9)
Lag 1 0.798∗∗∗ 0.915∗∗∗ 0.916∗∗∗ 0.705∗∗∗ 0.699∗∗∗ 0.698∗∗∗ 0.668∗∗∗ 0.661∗∗∗ 0.660∗∗∗
(19.78) (44.09) (44.89) (17.53) (18.36) (18.59) (14.44) (14.52) (14.43)
Lag 2 0.227∗∗∗ 0.237∗∗∗ 0.238∗∗∗ 0.164∗∗∗ 0.176∗∗∗ 0.179∗∗∗
(6.45) (6.50) (6.59) (3.44) (3.44) (3.52)
Lag 3 0.104 0.107 0.104
(1.82) (1.72) (1.67)
Per Capita Income -0.0000558 0.0000849 0.0000871 0.0000820 0.0000864 0.0000878 0.000107 0.000115 0.000112
(-0.71) (1.04) (1.06) (0.93) (0.89) (0.90) (1.11) (1.08) (1.06)
NRI -0.000391∗∗∗ -0.000432∗∗∗ -0.000390∗ -0.000345∗∗∗ -0.000371∗∗∗ -0.000332∗ -0.000305∗∗ -0.000331∗∗∗ -0.000324
(-4.05) (-4.74) (-2.44) (-3.35) (-3.74) (-2.00) (-3.14) (-3.59) (-1.96)
Civil War -0.0182 0.102 0.105 -0.0122 0.0667 0.0680 -0.0486 -0.00288 -0.00472
(-0.24) (1.10) (1.14) (-0.16) (0.63) (0.64) (-0.56) (-0.03) (-0.05)
Democracy 0.00525 0.00968 0.00922 -0.0134 -0.0000364 -0.00140 -0.0170 -0.00794 -0.00841
(0.33) (0.44) (0.48) (-0.77) (-0.00) (-0.07) (-0.99) (-0.36) (-0.41)
Civ. War * H. Legit. 0.163 0.171 0.236 0.24 1 0.271 0.269
(0.89) (0.86) (1.36) (1.28) (1.69) (1.56)
Civ. War * V. Legit. -0.555∗∗ -0.565∗∗ -0.602∗∗∗ -0.607∗∗ -0.710∗∗∗ -0.704∗∗∗
(-3.19) (-2.87) (-3.66) (-3.23) (-4.24) (-3.77)
Civ. War * Democ. -0.0335 -0.0343 -0.0211 -0.0219 -0.00640 -0.00662
(-1.70) (-1.77) (-0.99) (-1.03) (-0.31) (-0.32)
Drought * H. Legit. 0.0249 0.0104 -0.00160
(0.26) (0.11) (-0.02)
Drought * Democ. 0.00284 0.00488 0.00157
(0.18) (0.32) (0.11)
Constant 0.867∗∗∗ 0.622∗∗∗ 0.573∗∗ 0.596∗∗∗ 0.584∗∗∗ 0.542∗ 0.578∗∗∗ 0.566∗∗∗ 0.561∗
(7.02) (5.07) (2.72) (4.59) (4.20) (2.46) (4.26) (3.97) (2.48)
Wald Test 530.80∗∗∗ 3155.04∗∗∗ 3592.09∗∗∗ 1862.82∗∗∗ 2800.04∗∗∗ 3140.06∗∗∗ 1596.32∗∗∗ 2593.42∗∗∗ 2808.42∗∗∗
3