Munich Personal RePEc Archive
Private-public sector employment choice
and wage differential in Palestine:a
gender perspective
Daoud, Yousef and Shanti, Ruba
Birzeit University, World Food Programme
2011
Online at
https://mpra.ub.uni-muenchen.de/39782/
0
Private-public sector employment choice and wage differential in
Palestine:a gender perspective
1YousefDaoud
2Ruba Shanti
3March 2012
1
This paper was supported by a research grant from Gender Economic Research and Policy Analysis (GERPA), we thank anonymous referees for their help, the remaining errors are ours.
2 Department of Economics – Faculty of Commerce and Economics, Birzeit University, P.O. Box 14, Birzeit, occupied Palestinian territory, Tel: +972 2 2982181, Fax: +972 2 298 2963, Email:ydaoud@birzeit.edu
3 World Food Programme (WFP), Jerusalem, occupied Palestinian territory, Tel: 00972-599130050. Email:
1
1. Abstract
2
2. Introduction
Gender wage differentials across economic sectors have attracted considerable attention in the literature of labor economics. The wage differentials between different sectors can be caused by the unobserved characteristics of the workers or the existence of some discrimination against women depending on the sector.
In many countries, public sector employment has a significant share of both total employment and public sector expenditures, and plays essential role in economic performance. In general, the public sector has different characteristics and working conditions that it is used to produce goods and services generally with no substitutes in the private sector. As a result, the public sector acts as a monopsony in the labor market, where some researchers use this fact to explain the gender wage differentials. All of these features may affect the performance and functioning of the labor market.
In Palestine, salaries and wages have comprised a major component of the public budget. In December 2006, the Palestinian Ministry of Finance reported that salaries and wages constituted 68.3%of the Palestinian Authority budget for that year. Moreover, the wage bill accounts for 287%of domestic revenues in 2002 and grew to be 395% in 2007, which is unsustainable. The government began encouraging an early retirement policy (at full salary) and replacing some of the old security guard with younger ones. The gender aspect of public employment is nearly limited to civilian posts as females are not equally represented in the security apparatus.
In the Palestinian labor market, the choice issue is complicated by political as well as supply and demand factors. While female labor supply is limited (low labor force participation and limited to certain sectors), the economy’s absorptive capacity is also limited due to restricted access to Israeli labor markets and Israeli restrictions on the exportation of Palestinian goods. Due to these dire economic conditions, two opposing pressures on the public sector were taking place; in the post second Intifada days (2003 – 2007), public employment was rising at a fast pace putting so much pressure on the fiscal budget. Mounting criticism on the public finance front(such as UNRWA (2006) and UNCTAD (2008)) resulted in the government’s policy of restraining public employment in its Palestinian Reform and Development Plan (PRDP) of2008-2010. The financial reform which resulted in the application of the civil service law of 1998 and the subsequent adjustments to the pay scale (2005 for example), also resulted in altering public/private wage ratio.
3
The outline of the paper begins with an introduction and review, followed by data and descriptive analysis. Section five provides the model and empirical analysis, followed by the conclusions.
3. Data and Sample Descriptives
[image:5.612.126.487.259.484.2]In light of the political situation in Palestine, sector choice take a special meaning; that is because employment is Israel pays well but is captive to political stability. The private sector is also strongly influenced by the political situation, periods of political unrest witnesses closures and restricted trade; particularly on Palestinian goods destined to Israel. This makes public sector employment the most attractive (except for donor disbursement of aid). Figure 1 below shows the trends.
Figure 1: Wage employment distribution by sector
Sources: Authors calculations
Obviously, the private sector’s absorptive capacity has been diminishing with a slight improvement in 2010. The public sector on the other hand is steadily rising. Although the shares above account for wage employment only, if we consider unpaid family members and self employment, the private sectors’ share will be larger. The non-wage employment is not included in the analysis because the paper focuses on wage employment in addition to sector choice.
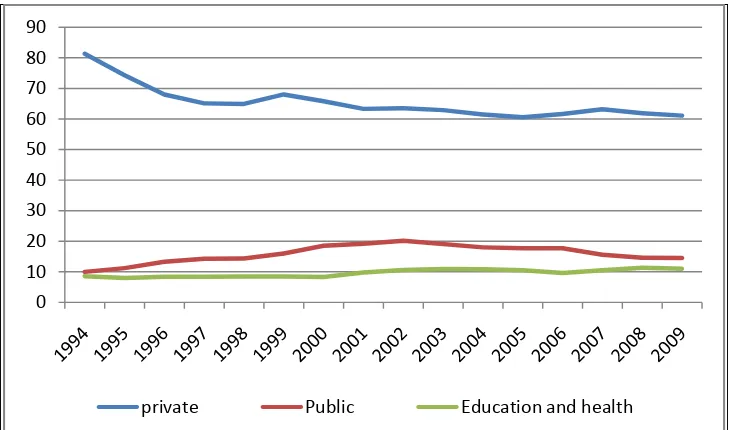
The contributions of the various sectors to GDP are introduced to shed light on economic activity by sector. The data on the “other” sector cannot be readily obtained from national value added, however, it must be noted that its size is small in terms of contributions to GDP and employment. The figure below shows value added by the private and public sectors.
26%
36% 38% 35%
68%
56%
53%
59%
6% 8% 9% 6%
1999 2001 2007 2010
4
Figure 1: Percentage Contribution to GDP by Economic Activity for the Years 1994-2009 at Current Prices- 1994 to 20094
Source: Palestinian Bureau Center of Statistics (PCBS)
It can be seen that the contribution of the private sector has diminished over the sample span from 80% in 1994 to about 60% in 2009. The two categories education and health contain both private and public contributions, although education is mostly public. The public sector contribution has risen in 2003 to reach almost 20% and declined thereafter due to mounting criticism of over-employment. The retreat of the private sector can be attributed to many factors, the most important of which is movement and access restrictions (Particularly on Gaza since 2007), competition with Israeli products which have freer movement, and Israeli practices which make it more costly to import and export. In addition to that, the bulk of Palestinian firms are small size which limits the benefits of scale economies, research and development, and a legal environment that does not support property and intellectual rights (El-Jaafari, Hantash, and Ali (2008).
The study utilizes Palestine Labor Force Surveys (PLFS) which is collected by the Palestine Central Bureau of Statistics (PCBS) on quarterly bases. The quarterly data was merged to form annual data sets. Each quarter, PCBS collects data on about 7500 households; each household is interviewed twice consecutively, left for two quarters, then interviewed again for two quarters. This would allow one to perform short panel analysis. The data is weighted by 2007 population census. We used the year 1999 as a starting point where the economy was stable and unemployment was relatively low. 2001 and 2007 were Intifada and government shutdown years, representing poor labor market performance. The year 2010 is supposed to be an improvement where GDP roughly
4
Private sector include: Agriculture & Fishing, Mining, Manufacturing, Electricity and Water, Construction, Wholesale & Retail Trade, Transport, Storage and Communications, Financial intermediation, Services ( Real Estate, Renting and Business Services, Community, Social and Personal Services, and Hotel and Restaurants), Households with Employed persons. Public Sector include: Public Administration and Defense and Public owned Employed persons.
0 10 20 30 40 50 60 70 80 90
5
reached 1999 levels, but it remains to be said that starting 2007, the PNA started a Medium Term Fiscal Framework that aimed at controlling public employment and government public expenditures. The data contains information about the family demographic and social characteristics (age, gender, marital status, educational levels and others indicators) and about employment (employment status, economic activities, place of work and other labor force indicators).
The sample is restricted to include those who were wage employees aged from 15 to 65 for the selected years in the public, private and ‘other’ sectors5 of the Palestinian territory. The analysis in this paper, exclude employers, self-employed individuals and unpaid family members because the paper focuses on sector selection to correct for returns to education. The Labor force survey has a question about the number of work hours per week but not the number weeks worked per month or per year.
The Palestinian labor market was subjected to various shocks since 1967 war; the first intifada (1987), the second intifada (2000), and the operation cast lead (Gaza war) at the end of 2008 after the Hamas won in the legislative council elections in (2006). These events have significant demand shocks; as a result the unemployment rate6 in Palestinian territory increased from 11.8% in 1999 to reach 25.3% in 2001.After the second Intifada, in 2007 it has decreased to 21.7% but still higher than 1999 (normal year). Moreover, in 2007 the number of Palestinian workers in Israel and settlements from the Gaza Strip reached zero; which increased the labor supply to the domestic market, putting downward pressure on unskilled male workers’ wages and another pressure on Palestinian Authority to absorb a large number of these employees. For males, the unemployment rate increased from 11.8% in 1999 to 23.1% in 2010, while female’s unemployment rate has increased from 13% to 26.8%. Figure 1 below shows the unemployment rate by years of schooling. For men, higher education implies lower unemployment, but for women, the highest unemployment rate is for college graduates. The figure also shows how the 2001 intifada affected mostly unskilled male workers.
Figure3: Unemployment rate by gender and level of education
5
Other sector include the employees in the following: foreign government, UNRWA, International organizations and NGOs
6
Source: different Labor Force Surveys, PCBS
6
[image:8.612.125.490.168.382.2]In the occupied Palestinian Territory (oPT) wage employments’ share of total employment has fluctuated between roughly 60% in 2007 to almost 69% in 2010 and always higher in Gaza and seems to decline during periods of instability (2001 and 2007). Figure 4 below shows wage employments’ share by region.
Figure 4: Wage employments’ share of total employment by region, 1999-2010
Source: Authors calculation
In order to motivate the discussion on sector choice, we find (Table A1) that weekly work hours have dropped roughly by half in the public sector while hourly wage rose
substantially compared to the two other sectors. Meanwhile, The private sector did not witness big improvements in either reduction on weekly work hours or hourly wage. Internally, construction has the highest hourly wage for all four years and witnessed the lowest decline in weekly work hours. Overtime, constructions, share of private sectors’ wage employment has been the highest and ranged between 29% (2007) and 41% (1999). Agriculture has also witnessed substantial decline in work hours but very marginal
improvements in hourly wage. Transport and storage has had the biggest improvement in hourly wages, albeit, not much improvement wage employment share. Finally, It must be noticed that variations do exist within each sector based on data shown in (Table A1).
The breakdown of wage employment share by gender and sector is shown in Table 1, across the years, the percentage of male wage employees is higher in private sector compared with public sector ranging from between 74% and 62%. While the female wage employees have nearly the same percentage between the public and private sectors through years; In general females’ share of wage employment in the private sector is lower than males’; however, it is higher in the public and other sectors. This points out that the bulk of female employment is in the service sector.
67.8 64.3 59.6 68.7
63.6 61.8
57.2 64.7
80.6
71.1
65.9
80.6
0.0 50.0 100.0 150.0 200.0 250.0
1999 2001 2007 2010
GS
WB
7
Table 1: Percetage of wage Employees in Palestian territory by Sector and Gender
Sex/Sector public private other
2010
Male 21 74 4
Female 37 46 17
2007
Male 31 62 7
Female 36 43 21
2001
Male 28 67 5
Female 40 44 16
1999
Male 21 74 4
Female 37 46 17
Source: Authors calculations
[image:9.612.124.489.383.603.2]The average daily wage for males rose 23% between 1999 and 2010, for females the growth 40%. Moreover, the average daily wages for males is higher than females in all years.
Figure 5: The average daily wages (NIS) by gender in Palestinian territory
Source: Authors calculations
The average daily wage gap is highest in 1999 being 40% in favor of males, although it dropped to 30% in 2001 and stayed thereafter at 20%. These changes can be explained by changes in labor supply of educated female workers. Although Figure 4 below shows the participation of all male or female workers against hourly wage, it depicts a more stable and positive relation for females than for males. The drastic drop in male participation in 2001 was a result of the closure of the Israeli labor markets.
77 76
85
95
57 57
72
80
0 10 20 30 40 50 60 70 80 90 100
1999 2001 2007 2010
8
Figure 6: Scatter plot of hourly wage and participation rate
Source: Authors calculations
[image:10.612.89.516.377.567.2]Figure 7 below shows that average log hourly wage is always lower for females in the private sector, although the gap seems to be narrowing over time. It is also true that female wages are higher in the public sector, but male wages are higher in the “other” sector. Average log hourly wages are higher for the “other” sector when compared to private and public for both men and women. The figure also shows that female public sector wages are much higher than the private sector, but for men they are roughly equal in 1999 and 2001 and higher for the latter years.
Figure 7: Log hourly wage for Palestinian women and men by sector
Source: Authors Calculations
Potential experience (Mincer, 1974) is computed as age minus years of schooling minus six (age of enroll in school). It is shown in tables A2-A5 that males have more experience than female across sectors and throughout the sample span. The male/female gap is highest in the “other” sector in 2010 where males potential experience exceeds females by 6 years.
The distribution of wage employment by educational attainment is also provided in Tables A2-A5, for men (tables A2 and A3), there is an obvious and clear trend. When
Male
9
[image:11.612.115.499.189.533.2]employed in the public or “other” sector, the distribution is nearly evenly spread between educational levels 2, 3, and 4; but when employed in the private sector, more than two thirds are in educational level 2 (less than secondary). This implies that male wages should be lower on average in the private sector if wages are determined efficiently since many more of them have lower education when compared to the two other sectors. This has been the case for the entire sample span.
Table 2: The distribution of wage employment by sector and gender
Educ. Level
Public Private Other Public Private Other
Male Female
1999
1 1.1% 2.3% 1.7% 0.3% 3.0% 1.0%
2 34.2% 72.5% 35.3% 5.1% 44.1% 16.3%
3 35.4% 20.0% 30.5% 52.2% 36.5% 55.4%
4 26.3% 4.7% 29.0% 40.8% 15.5% 25.8%
5 3.1% 0.5% 3.5% 1.6% 0.9% 1.5%
2001
1 1.0% 1.6% 1.5% 0.1% 3.1% 0.4%
2 32.8% 72.8% 35.4% 6.2% 41.9% 6.7%
3 35.5% 19.3% 27.3% 42.8% 34.7% 54.4%
4 27.5% 5.4% 28.3% 49.9% 19.1% 36.7%
5 3.2% 0.9% 7.5% 1.0% 1.1% 1.7%
2007
1 0.2% 0.8% 0.7% 0.2% 1.6%
2 35.1% 71.8% 33.9% 8.6% 39.0% 15.8%
3 34.9% 19.9% 28.4% 30.2% 28.9% 29.5%
4 26.3% 6.5% 30.7% 58.1% 27.4% 52.4%
5 3.4% 1.1% 6.4% 2.9% 3.1% 2.3%
2010
1 0.3% 0.7% 0.8% 0.1% 1.3% 0.5%
2 35.0% 69.9% 39.1% 5.8% 30.0% 11.9%
3 28.0% 19.6% 20.3% 25.9% 30.0% 26.3%
4 32.4% 8.1% 34.6% 64.3% 35.2% 57.1%
5 4.4% 1.7% 5.3% 4.0% 3.5% 4.3%
Source: Authors calculations
As for females, the trends are not as obvious. It is obvious, however, that unlike men, women are more concentrated in education level 4 (BA and higher diploma) by more than 50% in the public sector. The same applies to the “other” sector, for 1999 and 2001, the concentration was in education level 3 (secondary and lower diploma); later more that 50% where in education level 4. For the private sector, education levels 2 and 3 seem to dominate without strong concentration. That implies it will be harder to disentangle female wage inequality in the private sector based on education.
10
[image:12.612.97.515.158.361.2]average years of schooling is higher than males’ in the public and lower in private and “other”. Based on that, one would expect that female wages to be higher on average than males in public and similar to lower in private and “other” sectors.
Figure 8: Average years of schooling by gender and sector
Source: Authors Calculations
In general, males and females who are never married have strong presence in private sector across years compared with public and other sectors. This implies that married, widowed and divorced tend to seek employment in the sectors which provide more job security. At the regional level, there are significant differences in sector employment between males and females. In each sector for all years, female employment is largely concentrated in the West Bank; usually two thirds or more. As for men, the public sector employment is a bit higher than 50%in Gaza, which seems strange given that Gaza has roughly one third the population. This implies that the public sector is over-staffed in the Gaza Strip. On the other hand, more people are employed in the private sector in the West Bank (70%) and “other” (slightly over 60%). Overtime and since the political split between the West Bank and Gaza, The private sectors’ share increased in the West Bank to over 50%, while the “other” sectors’ share rose in Gaza relative to the West Bank. This is a reflection on international organizations’ increased relief efforts to reduce the economic impact of the Israeli siege on Gaza.
4. The Literature
Sectorial wage differentials have been of considerable interest for economists recently; they are motivated primarily by wage setting behavior in the private and public sectors and because of the fiscal and monetary implications of the public sector wage bill. Tansel (2004) provides an overview of the literature on wage setting in the private and public sectors. While private sector firms are driven by the profit motive, public sector institutions / decision makers are driven by political factors; the voter maximization
11
model, Reder (1975) and Borjas (1980) and the budget maximization model (Niskanen (1975)) are used to explain employment and wage setting in the public sector. Alternatively, the trade unions model of Gunderson (1979) and Holmlund (1993) show how trade unions use collective bargaining to explain wage and employment setting.
There are particular groups who shift the focus of sectorial wage differential to study the gender aspect; Assaad (1997), Tansel (2004), Blau and Kahn (2007), Lewis and Galloway (2011), and Danh (2006). Others differentiate between state and federal government such as Richwine (2011) and Blank (1985). Blau and Khan (2007) indicate that female and male wages have experienced considerable convergence in the US since 1978, but that a sizable portion of the gap is still unaccounted for and is unlikely to vanish in the near future. In these studies, the gender wage gap can be caused by the human capital model, sectorial choice and/or occupation, and discrimination.
In the Palestinian case, there were two studies, which examined the sector wage differential, neither of which addressed this issue in its entirety. Mataria, A.,et al (2007) has analyzed this issue using ordinal logistic regression without considering gender and selection issues. Miaari (2009) uses quantile regression analysis to decompose the sector wage gap for males in explained (human capital model) and unexplained (skill) for the period 1998 to 2006. A new development beyond 2006 requires a re-examination of the sector wage differential with gender analysis. Miaari (2009) uses Reimers (1983), Newman and Oaxaca (2004) for the selectivity decomposition. Daoud (2005) looked at the schooling premium differential between private and public sector employment and found that for 1999 and 2001; public sector employment premium is negative compared to all other wage employments for both men and women, though less negative for women. Tansel and Daoud (2011) also found that, for 2004 and 2008, female returns to an additional year of schooling are higher in the public sector (8.9% and 8.1% respectively); in the formal private sector, females earn an additional 7.7% for both years. For males, the return in the public sector is similar (but lower) to females; however, in the formal private sector, it nearly drops to half of that in the private sector. These papers did not correct for sector selection either.
Finally, Vella (1998) provides an overview of the literature on the available methods for estimating models with sample selection including parametric and semi parametric models. He also proposes methods to tackle sample selection with panel data. This paper will follow the parameterized Heckman type model.
5. Methodology and Analysis: 5.1Wage Equations
The econometric literature summarizes the main determinants of gender wage gap in two points. First, labor market discrimination defined as “different payment for men and women with the same productivity” (Ehrenberg, et al, 1991)7. Second, the differences in the endowments of female and male workers, which include education, experience and
7
12
training, as well as some job characteristics, such as location of firms and its size, are also included.
The common method of measuring the gender wage gap is to estimate the semi-log wages equations for both male and female. The wage equations are standard human capital (Mincer (1974), Becker (1975)) forms; where the log of the wage of individual i in sector j depends on schooling and a group of social and personal characteristics (Xj).
Ln Wij = B0 + BjXj + Uj (1)
Where B0is the intercept term, Bj is a vector of slope coefficients, and ~ 0, .
Estimation of such models by standard techniques (OLS) suffers from potential biases; it requires that sector selection be taken into consideration. Heckman (1976) points that sample selection biases may result if selection is not addressed.
The correction for sector selection is attained by using the multinomial logit modeli. Palestinian workers can choose between the public sector (j=1), the domestic private sector (j=2), the “otherii” category (j=3), and not working (j=4). The base category (j=4) is the base outcome group includes both unemployed and non-participants (Tansel 2004). The probability of selecting sector j is
∑
+ =j z z
j j
j
e e
P α
α
1 (2)
Equation (2) is estimated by the multinomial logit method as outlined in Bourguignon, F., Fournier, M., Gurgand, M., (2007), the results of equation (2) are then used to construct a self-selection term (estimated from the densities and cumulative distribution functions of the standard normal) which is included in the wage equation to correct for sector selection.
13
included in addition to household size and refugee status dummyiv. These variables are included to achieve identification8.
5.2Private-Public Wage Differentials by Gender
The decomposition of log mean wages is done to show how much of the total gap is explained by attributes which affect productivity such as education and experience (the explained part), and a residual part which is unexplained by differences in wage determinants (Blinder 1973) and Oaxaca (1973). The latter part is often referred to as the discrimination part and potentially carrying the effect of changes in unobserved variables. Ben Jann (2008)v provides an overview of the literature on the decomposition with extensions to the original work of Blinder (1973) and Oaxaca (1973). Let the log wage differential be defined as follows (Jann, 2008):
− = − + − + − −
(3)
Where j is the sector to be compared to the private sector which is once the public and another the “other” sector. The coefficient vector is indexed to match the matrix of explanatory variablesvi. The decomposition is also carried out with correction for selection which would alter the log mean wage for the group with selection bias leading to an over or underestimate of the differential.
Equation (3) is specified from the private sector’s view point where R measures the total differential between sector J and the private sector. This means that the component E (Endowments effect) measures the expected change in private sectors’ mean log hourly wage if they had public sectors predictor levelsvii. If this term is negative, then the mean private sectors’ log hourly wages would fall if they had public sectors’ attributes. The sum of the terms C (coefficient) and I (interaction) are the residual components; C measures the expected change in private sectors’ mean log hourly wage if they had public sectors coefficients. The interaction term (I) represents simultaneous changes in predictor mean differences and coefficients.
5.3Estimation Results
5.3.1 Participation and Sector Selection: The multinomial logit estimates for men and women are provided in Tables A6 and A7 which present the marginal effects evaluated at sample means. The null hypothesis that all slope coefficients are jointly zero is rejected at less than 1%level for men and women, The pseudo R2 is between 30% and 33%which is acceptable in models of cross section data. The marginal effects of experience for males are all positive and significant; this means that higher experience increases the probability of selecting any of the sectors compared to not working. Although potential experience
8
14
raises the probability of sector selection, it does so at a decreasing rate. The effect of education on sector selection is varied depending on the sector. Although for the public sector higher education implies a significantly higher probability of selecting the public sector as the education level increase, the opposite is true for the private sector. Table A7 shows that the marginal effects of education dummies are almost always negative except for 2007, a year in which the government was shut down and people looked for jobs in the private sector (or unpaid family business). As for the “other” sector, the marginal effects are positive, nonetheless, they are weak, however, significant across the different years of study. According to geographic location, West Bankers are less likely to be in the public or “other sectors” but more likely to be in the private sector than Gazan’s. This result is uniformly significant across the 4 years covered by the study. Never married Palestinian men are less likely to join any sector except for the private sector in 2007; this anomaly is likely to be due to the dire economic conditions which pushed younger generations to seek employment in the private sector especially when Israel closed its labor markets more tightly in 2007.
The selection terms begin with household wage income, individuals from households with higher wage income are less likely to join the public sector. As the household wage income increases, individuals tend to seek employment more in the private sector or in the other sector. However, including the household size in the analysis implies as the household size increases, this would potentially increase the wage income. Thus controlling for the wage income, individuals from bigger households, with similar wage income as other households, are more geared to be selected into the “other” sector. This in fact may be the case with many camp dwellers, since most of them work for UNRWA or other UN agencies. The refugee dummy is included to check whether they are more or less likely to be in the public or “other” sectors; the results indicate that refugees are less likely to join the public sector as well as the “other” sectors; this is counter intuitive, they are 3-5perceent more likely to be in the private sectors than none refugees.
Just like men, Palestinian women’s likelihood of selecting any sector (compared to not working) is increased with experience at a decreasing rate. However, unlike men, education improves the probability of joining all sectors for all levels of education almost all years of the study. The social status is also a gender disparity; never married females are more likely to join or select any of the three sectors than the base group (married or ever married). Palestinian female refugees are less likely to join any sector compared to none refugee women. The household wage income, although significant, seems to affect participation in any sector very weakly.
5.3.2 Returns to Education:
15
[image:17.612.125.490.215.516.2]will have a higher average wage by 135% more than the control group (illiterates) in the public sector in 1999, but 213% if employed in the “other” sector. The comparable figures for males are 114% and 105% respectively. Over time, differences from the basic group tend to be highest in the “other” sector for 1999 and 2001 for females, but switches to the public and private sectors in 2007 and 2010. So the trend for females is an improvement if educated women move into the public or private sectors. For men, educated men are better off (higher difference from the basic group) when they are employed in the public sector in good times (1999 and 2010), but worse off in the public sector in bad times (2001 and 2007).
Table 3: OLS€ estimates of returns to educational attainment
Education level¥
Female Male Public Private Other Public Private Other
1999
Level 1 0.43 -0.02 0.51 0.18 0.08 0.15
Level 2 0.87 0.31 1.16 0.44 0.14 0.32
Level 3 1.06 0.82 1.62 0.76 0.22 0.60
Level 4 1.35 0.98 2.13 1.14 0.62 1.05
2001
Level 1 0.40 0.24 0.31 0.08 0.08 0.09
Level 2 0.78 0.51 1.09 0.32 0.09 0.42
Level 3 0.97 0.95 1.43 0.62 0.30 0.71
Level 4 1.17 1.49 1.54 0.91 0.86 1.08
2007
Level 1 0.23 0.12 (omitted) 0.05 0.25 0.66
Level 2 0.68 0.35 0.40 0.30 0.31 0.92
Level 3 0.86 0.91 0.77 0.63 0.56 1.38
Level 4 1.16 1.57 1.35 0.97 1.01 1.61
2010
Level 1 0.10 -0.02 -0.45 0.20 0.12 -0.14
Level 2 0.62 0.29 0.17 0.46 0.23 0.16
Level 3 0.84 0.67 0.54 0.84 0.45 0.40
Level 4 1.22 1.43 1.03 1.16 1.12 0.68
¥ see notes to Table A2
€ we do not report the whole set of coefficients for brevity
16
the public or private sectors. Compared to men, the return to education for women is lower in each sector and often insignificant. There are cases (scattered across the years) which are reported for the private sector where the return is negative and significant. In general, never married individuals, whether male or female, tend to earn lower wages than the ever married, which is to be expected due to family allowances for employment in any sector. The West Bank dummy is not often significant for females, but more so for males. It varies from year to year, however the negative sign for most of the years is possibly due to selection correction. In reality, average daily wage is possibly comparable in the public sector between the West Bank and Gaza, however, it is higher in the private sector and the other sector in the West Bank.
5.3.3 Decomposition of Wage Differential: Estimates of differential decomposition are found in Table (A11) with selection adjustment. The results show that the “other”-private wage gap is positive for males for all years except 2007viii. This implies that predicted log hourly wages are on average lower in the private sector than in the other sector; this result is not surprising since the other sector includes NGO’s, foreign government, and international and UN organizations, where one expects higher wages. The Public /private wage differential for males is also positive (except for 2007), however, it is lower for the “other”/private wage gap. For females, the wage gap is positive for all years (except public in 1999) including 2007; this implies that female wages were not impacted negatively by the 2007 events as did male wages. The wage gap for males between other and private is always higher for males than females; this means that males do better in the other or public sector when compared to the private sector; while female gains are smaller from selecting those sectors.
The endowment effect is almost always negative for male, but the opposite for female, this means that had females predictor levels in sector j been applied to the private sector, their wages would be expected to rise, and the opposite would be the case males. But in any case, the residual component seems to dominate the endowment effect. Tansel 2004 found similar results stemming from differences in the constant. Palestine is also known to have low returns to education (endowments) which contributes to this phenomenon.
17
6.
Concluding Remarks
The results of the study point to stark gender differences in the three dimensions of the study, sector selection, returns to education and wage decomposition. For sector selection, experience increases the probability of sector selection (for all three sectors compared to not working) at a decreasing rate for men and women. Unlike men, education improves the probability of joining all sectors for all levels of education almost for all years of the study. In contrast, this is only true for the public and “other” sectors for men. Education seems to reduce the probability of joining the private sector, Table A2 reflects the distribution of males across the various educational attainments showing that a higher concentration of lower educational levels in the private sector compared to the other two sectors. The marginal effect of the West bank dummy shows that males in West Bank are less likely to be in the public or “other” sectors than Gazans, but more likely to be in the private sector. For females, it is positive in the public and private sectors, but negative in the “other” sector; which means that in the West Bank Women are like men in the sense they are more likely to be in the private and “other” than Gazans, but unlike men, they are more likely to be in the public sector than Gazan women. Gender differences also exist with regard to the social status, never married women are more likely to join any sector than the base group (married, widowed and divorced); for men the opposite is true. This indicates that the social order of men being the bread winners in the households still seems to hold; females tend to be less likely to join the labor force once married. Refugee status hood also affects men and women differently, while refugee women are less likely to join any sector than none refugees, for men this is only true for public and “other sectors”; however, refugee men are more likely than none refugees to select the private sector.
Returns to education exhibit none linear behavior, using OLS, it is found that females’ return to education are higher than males for almost all levels of education. It is also found that successive levels of education have a larger difference from the base group as educational attainment increases. This was found to be the case for men and women. However, when the analysis was carried out with sector selection correction, male return estimates did conform to the above findings qualitatively, but female equation estimates were less robust. Female return estimates varied across time and sector.
18
7.
Annex
8. Table A5: Average Weekly Work Hours and Average Hourly Wage by Activity in the Private Sector
1999 2001 2007 2010
Sector Industry Hourly
wagea
Weekly work hours
Hourly
wagea
Weekly work hours
Hourly
wagea
Weekly work hours
Hourly
wagea
Weekly work hours
Private Sector
Agriculture 7.61 44.23 8.89 27.29 10.67 22.63 8.39 26.53
Manufacturing 7.37 46.33 8.36 38.96 9.42 32.37 10.39 33.62
Construction 12.57 43.47 13.85 30.17 15.71 23.54 17.11 25.39
Commerce-Hotels 8.21 48.44 8.76 41.89 8.98 37.45 9.06 37.77
Transport-storage 7.08 50.06 7.20 46.06 9.04 35.67 13.72 36.37
Other b 9.15 43.76 9.92 38.33 12.70 31.19 14.82 31.35
Total 9.80 45.21 10.31 36.05 11.56 30.04 12.87 31.19
Other Sector 11.94 39.58 12.12 37.33 15.69 27.57 16.06 21.67
Public Sector 7.69 41.86 7.89 39.10 11.14 29.55 11.93 24.41
Source: Authors calculation based on Labor Force Scurvies, 1999, 2001, 2007 & 2010
Note: The sample includes West Bank & Gaza Strip wage employees, Prime-aged (15-65 years old) for male & female
19
TableA2: Summary Statistics of Variables by sector in Palestinian Territory, Male.
Variables/Sector
1999 2001 Public Private Other Public Private Other
Log hourly wages a
1.89 2.10 2.37 1.91 2.18 2.35
(0.00) (0.00) (0.00) (0.00) (0.00) (0.00)
Experience c
18 15 21 17 16 19
(0.02) (0.01) (0.05) (0.02) (0.01) (0.04)
Experience Square
460 344 605 413 356 467
(1.04) (0.47) (2.60) (0.89) (0.52) (1.89)
Education b
Level 1 1.1% 2.3% 1.7% 1.0% 1.6% 1.5%
Level 2 34.2% 72.5% 35.3% 32.8% 72.8% 35.4%
Level 3 35.4% 20.0% 30.5% 35.5% 19.3% 27.3%
Level 4 26.3% 4.7% 29.0% 27.5% 5.4% 28.3%
Level 5 3.1% .5% 3.5% 3.2% .9% 7.5%
Never married b 17.7% 36.5% 16.1% 23.4% 34.1% 18.0%
Region b
West Bank 47.9% 73.7% 65.6% 47.3% 77.8% 61.3%
Gaza Strip 52.1% 26.3% 34.4% 52.7% 22.2% 38.7%
Refugeeb 49.3% 36.0% 58.1% 49.6% 34.0% 58.9%
Sample Size 5,033 17,220 915 4,899 10,859 818
Source: Authors calculation based on Labor Force Scurvies, 1999, 2001, 2007 & 2010
Note: The sample includes West Bank & Gaza Strip wage employees, Prime-aged (15-65 years old) for male & female
a: Measured in New Israeli Shekel
b: Indicate dummy variables
c: Experience is equal age-years of school -6
Education dummy: Level1: illiterate , Level2: the less than secondary, Level3: secondary & lower Diploma, Level4: BA & high Diploma and Level 5: MA & PhD
20
TableA3: Summary Statistics of Variables by sector in Palestinian Territory, Male.
Variables/Sector
2007 2010
Public Private Other Public Private Other
Log hourly wages a
2.21 2.19 2.54 2.27 2.26 2.51
(0.00) (0.00) (0.00) (0.00) (0.00) (0.00)
Experience c
17 16 19 18 16 19
(0.01) (0.01) (0.04) (0.01) (0.01) (0.04)
Experience Square
386 361 503 413 392 520
(0.60) (0.45) (1.63) (0.58) (0.43) (1.69)
Education b
Level 1 .2% .8% .7% .3% .7% .8%
Level 2 35.1% 71.8% 33.9% 35.0% 69.9% 39.1%
Level 3 34.9% 19.9% 28.4% 28.0% 19.6% 20.3%
Level 4 26.3% 6.5% 30.7% 32.4% 8.1% 34.6%
Level 5 3.4% 1.1% 6.4% 4.4% 1.7% 5.3%
Never married b 21.3% 36.4% 21.7% 14.3% 34.1% 19.9%
Region b
West Bank 45.5% 81.5% 54.0% 43.5% 83.0% 43.8%
Gaza Strip 54.5% 18.5% 46.0% 56.5% 17.0% 56.2%
Refugeeb 51.9% 33.0% 66.4% 49.8% 27.8% 67.1%
Sample Size 5,543 10,894 1,103 5,913 13,241 1,091
Source: Authors calculation based on Labor Force Scurvies, 1999, 2001, 2007 & 2010
Note: The sample includes West Bank & Gaza Strip wage employees, Prime-aged (15-65 years old) for male & female
a: Measured in New Israeli Shekel
b: Indicate dummy variables
c: Experience is equal age-years of school -6
Education dummy: Level1: illiterate , Level2: the less than secondary, Level3: secondary & lower Diploma, Level4: BA & high Diploma and Level 5: MA & PhD
21
Table A4: Summary Statistics of Variables by sector in Palestinian Territory, Female.
Variables/Sector
1999 2001
Public Private Other Public Private Other
Log hourly wages a
2.04 1.56 2.16 2.03 1.61 2.25
(0.00) (0.00) (0.01) (0.00) (0.00) (0.00)
Experience c
14 13 17 13 13 16
(0.03) (0.03) (0.06) (0.03) (0.04) (0.06)
Experience Square
293 269 404 271 294 356
(1.19) (1.36) (3.05) (1.18) (1.49) (2.21)
Education b
Level 1 .3% 3.0% 1.0% .1% 3.1% .4%
Level 2 5.1% 44.1% 16.3% 6.2% 41.9% 6.7%
Level 3 52.2% 36.5% 55.4% 42.8% 34.7% 54.4%
Level 4 40.8% 15.5% 25.8% 49.9% 19.1% 36.7%
Level 5 1.6% .9% 1.5% 1.0% 1.1% 1.7%
Never married b 33.0% 62.0% 35.0% 34.5% 63.8% 32.0%
Region b
West Bank 73.2% 89.9% 73.0% 72.6% 88.5% 68.2%
Gaza Strip 26.8% 10.1% 27.0% 27.4% 11.5% 31.8%
Refugeeb 38.7% 36.1% 50.4% 40.0% 32.1% 51.8%
Sample Size 1,086 1,440 482 1,033 1,034 405
Source: Authors calculation based on Labor Force Scurvies, 1999, 2001, 2007 & 2010
Note: The sample includes West Bank & Gaza Strip wage employees, Prime-aged (15-65 years old) for male & female
a: Measured in New Israeli Shekel
b: Indicate dummy variables
c: Experience is equal age-years of school -6
Education dummy: Level1: illiterate , Level2: the less than secondary, Level3: secondary & lower Diploma, Level4: BA & high Diploma and Level 5: MA & PhD
22
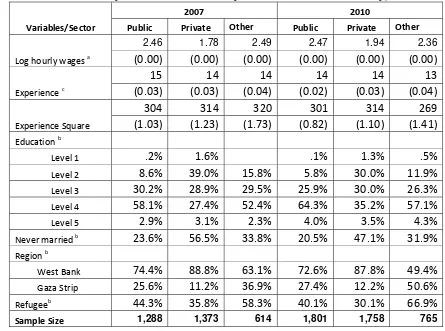
Table A5: Summary Statistics of Variables by sector in Palestinian Territory, Female.
Variables/Sector
2007 2010
Public Private Other Public Private Other
Log hourly wages a
2.46 1.78 2.49 2.47 1.94 2.36
(0.00) (0.00) (0.00) (0.00) (0.00) (0.00)
Experience c
15 14 14 14 14 13
(0.03) (0.03) (0.04) (0.02) (0.03) (0.04)
Experience Square
304 314 320 301 314 269
(1.03) (1.23) (1.73) (0.82) (1.10) (1.41)
Education b
Level 1 .2% 1.6% .1% 1.3% .5%
Level 2 8.6% 39.0% 15.8% 5.8% 30.0% 11.9%
Level 3 30.2% 28.9% 29.5% 25.9% 30.0% 26.3%
Level 4 58.1% 27.4% 52.4% 64.3% 35.2% 57.1%
Level 5 2.9% 3.1% 2.3% 4.0% 3.5% 4.3%
Never married b 23.6% 56.5% 33.8% 20.5% 47.1% 31.9%
Region b
West Bank 74.4% 88.8% 63.1% 72.6% 87.8% 49.4%
Gaza Strip 25.6% 11.2% 36.9% 27.4% 12.2% 50.6%
Refugeeb 44.3% 35.8% 58.3% 40.1% 30.1% 66.9%
Sample Size 1,288 1,373 614 1,801 1,758 765
Source: Authors calculation based on Labor Force Scurvies, 1999, 2001, 2007 & 2010
Note: The sample includes West Bank & Gaza Strip wage employees, Prime-aged (15-65 years old) for male & female
a: Measured in New Israeli Shekel
b: Indicate dummy variables
c: Experience is equal age-years of school -6
Education dummy: Level1: illiterate , Level2: the less than secondary, Level3: secondary & lower Diploma, Level4: BA & high Diploma and Level 5: MA & PhD
23
Table A6: Marginal effects of multinomial logit by sector - male
1999 2001
Variables/Sector Public Private Other Public Private Other
B SE B SE B SE B SE B SE B SE
Experience 0.0069* 0.0009 0.0168* 0.0010 0.0022* 0.0005 0.0085* 0.0011 0.0096* 0.0011 0.0040* 0.0007
Experience Square -0.0001* 0.0000 -0.0003* 0.0000 -0.00002* 0.0000 -0.00006* 0.0000 -0.0002* 0.0000 -0.0001* 0.0000
Level 1 (d) 0.1059* 0.0215 0.0622* 0.0237 0.0008 0.0101 0.1533* 0.0275 0.0005 0.0263 -0.0023 0.0164
Level 2 (d) 0.2566* 0.0218 -0.1118* 0.0243 0.0244* 0.0103 0.3296* 0.0277 -0.1833* 0.0268 0.0127 0.0165
Level 3 (d) 0.4396* 0.0223 -0.2925* 0.0266 0.0548* 0.0105 0.4788* 0.0281 -0.3009* 0.0282 0.0326* 0.0165
Level 4 (d) 0.5758* 0.0337 -0.4497* 0.0535 0.0514* 0.0136 0.5183* 0.0361 -0.3420* 0.0424 0.0422* 0.0186
Never Married (d) -0.0210** 0.0113 -0.1009* 0.0136 -0.0083 0.0072 -0.0201 0.0134 -0.0869* 0.0137 -0.0167** 0.0099
Household total wages -0.0023* 0.0001 0.0020* 0.0001 0.0002* 0.0000 -0.0017* 0.0001 0.0012* 0.0001 0.0003* 0.0000
Household size -0.0012 0.0010 -0.0025* 0.0012 0.0007 0.0005 -0.0047* 0.0013 -0.0031* 0.0013 0.0015* 0.0007
Refugee (d) -0.0168* 0.0063 0.0447* 0.0074 -0.0350* 0.0036 -0.0062 0.0072 0.0659* 0.0075 -0.0495* 0.0046
WB& GS (d) -0.0566* 0.0063 0.1048* 0.0076 0.0161* 0.0033 -0.1385* 0.0072 0.1867* 0.0081 -0.0121* 0.0040
2007 2010
Experience 0.0130* 0.0007 0.0212* 0.00071 0.0019* 0.0003 0.0086* 0.0010 0.0120* 0.0011 0.0013* 0.0005
Experience Square -0.0002* 0.0000 -0.0003* 0.00001 -0.00001* 0.0000 -0.0001* 0.0000 -0.0002* 0.0000 0.0000 0.0000
Level 1 (d) 0.1017* 0.0270 0.1154* 0.02106 0.0094 0.0123 0.0598 0.0383 0.1002* 0.0370 -0.0034 0.0161
Level 2 (d) 0.2128* 0.0271 0.0556* 0.02149 0.0266* 0.0124 0.1774* 0.0386 -0.0235 0.0374 0.0083 0.0163
Level 3 (d) 0.3601* 0.0272 0.1130* 0.02241 0.0598* 0.0124 0.3357* 0.0386 -0.1617* 0.0378 0.0439* 0.0162
Level 4 (d) 0.4309* 0.0331 0.3455* 0.04036 0.0783* 0.0136 0.3107* 0.0408 -0.1337* 0.0435 0.0294** 0.0170
Never Married (d) -0.0265* 0.0080 0.0740* 0.00870 -0.0031 0.0043 -0.0432* 0.0130 -0.0647* 0.0145 -0.0040 0.0072
Household total wages -0.0001* 0.0000 -0.00005 0.00004 0.0001* 0.0000 -0.0006* 0.0000 0.0004* 0.0000 0.0001* 0.0000
Household size -0.0040* 0.0008 -0.0102* 0.00095 -0.0007 0.0004 0.0001 0.0012 -0.0074* 0.0014 0.0009 0.0006
Refugee (d) 0.0019 0.0042 0.0395* 0.00484 -0.0309* 0.0026 -0.0111** 0.0062 0.0474* 0.0068 -0.0282* 0.0041
WB& GS (d) -0.0319* 0.0044 0.1267* 0.00599 -0.0089* 0.0023 -0.0113** 0.0066 0.1162* 0.0079 -0.0285* 0.0031
24
Table A7: Marginal effects of multinomial logit by sector – female
1999 2001 Variables/Sector Public Private Other Public Private Other
B SE B SE B SE B SE B SE B SE
Experience 0.0038* 0.000 0.0030* 0.000 0.0011* 0.000 0.0046* 0.001 0.0027* 0.000 0.0025* 0.000
Experience Square -0.0001* 0.000 -0.00004* 0.000 -0.00001* 0.000 -0.00009* 0.000 -0.00004* 0.000 -0.00004* 0.000
Level 1 (d) 0.018 0.021 0.009 0.007 0.003 0.006 0.011 0.028 -0.004 0.007 -0.002 0.012
Level 2 (d) 0.0868* 0.020 0.0292* 0.008 0.0211* 0.006 0.0926* 0.028 0.008 0.007 0.0231* 0.011
Level 3 (d) 0.1248* 0.021 0.0500* 0.008 0.0300* 0.007 0.1437* 0.028 0.0424* 0.008 0.0362* 0.012
Level 4 (d) 0.1355* 0.024 0.0759* 0.017 0.0289* 0.012 0.1270* 0.032 0.0408* 0.018 0.0451* 0.014
Never Married (d) 0.0244* 0.004 0.0480* 0.004 0.0068* 0.003 0.0160* 0.005 0.0398* 0.004 0.006 0.004
Household total wages 0.0001* 0.000 0.0001* 0.000 0.0001* 0.000 0.0001* 0.000 0.0001* 0.000 0.0001* 0.000
Household size -0.0022* 0.000 -0.0026* 0.000 -0.0012* 0.000 -0.0035* 0.001 -0.0033* 0.001 -0.0025* 0.001
Refugee (d) -0.0072* 0.003 -0.0056* 0.003 -0.0106* 0.002 -0.0093* 0.003 -0.003 0.003 -0.0152* 0.003
WB& GS (d) 0.0137* 0.003 0.0313* 0.004 0.0035** 0.002 0.0132* 0.004 0.0267* 0.004 -0.001 0.002
2007 2010
Experience 0.0055* 0.001 0.0033* 0.000 0.0015* 0.000 0.0065* 0.001 0.0035* 0.000 0.0016* 0.000
Experience Square -0.0001* 0.000 -0.00004* 0.000 -0.00002* 0.000 -0.0001* 0.000 -0.00004* 0.000 -0.00002* 0.000
Level 1 (d) -0.074 1.945 -0.003 0.514 0.176 7.017 -0.007 0.019 -0.012 0.009 -0.003 0.008
Level 2 (d) -0.016 1.945 0.007 0.514 0.189 7.017 0.0480* 0.019 0.012 0.009 0.011 0.008
Level 3 (d) 0.042 1.945 0.039 0.514 0.210 7.017 0.1099* 0.019 0.0500* 0.010 0.0331* 0.009
Level 4 (d) 0.021 1.945 0.069 0.514 0.211 7.017 0.1476* 0.021 0.0873* 0.014 0.0484* 0.010
Never Married (d) 0.0081** 0.005 0.0443* 0.004 0.0071* 0.003 0.0206* 0.005 0.0464* 0.004 0.0108* 0.003
Household total wages 0.0002* 0.000 0.0001* 0.000 0.0001* 0.000 0.0001* 0.000 0.0001* 0.000 0.00003* 0.000
Household size -0.0028* 0.001 -0.0036* 0.001 -0.0018* 0.000 -0.0041* 0.001 -0.0031* 0.001 -0.0016* 0.000
Refugee (d) -0.0073* 0.003 -0.001 0.003 -0.0100* 0.003 -0.0070* 0.003 0.001 0.003 -0.0106* 0.003
WB& GS (d) 0.0231* 0.004 0.0351* 0.005 -0.0067* 0.002 0.0251* 0.003 0.0403* 0.005 -0.0087* 0.002
25
Table A8: Selectivity corrected estimates of wage equations for Palestinian males
1999 2001
Public Private Other Public Private Other
Variables B SE B SE B SE B SE B SE B SE
Experience 0.02* 0.00 0.01* 0.01 0.01 0.01 0.022* 0.00 0.01 0.01 -0.02** 0.01
Experience Square (10-3 ) -0.10 0.10 0.09* 0.10 -0.10 0.10 -0.10 0.10 0.10 0.20 0.60* 0.20
Level 1 (d) 0.26* 0.06 0.21* 0.09 0.23** 0.12 0.27* 0.09 0.53* 0.13 0.308 0.18
Level 2 (d) 0.84* 0.08 0.82** 0.10 0.62* 0.14 0.89* 0.09 1.35* 0.15 1.10* 0.18
Level 3 (d) 1.47* 0.10 1.56 0.14 0.89* 0.19 1.41* 0.10 2.01* 0.18 1.61* 0.22
Level 4 (d) 1.94* 0.13 1.99 0.22 1.26* 0.24 1.66* 0.12 2.02* 0.21 1.59* 0.23
Never Married (d) -0.03 0.09 -0.05 0.07 -0.04 0.19 0.01 0.07 -0.16 0.10 0.69* 0.26
WG & GS (d) -0.16* 0.02 -0.12* 0.03 -0.17* 0.05 -0.38* 0.04 -0.50* 0.06 -0.67* 0.09
Constant 0.01 0.15 2.54* 0.14 3.37* 0.46 0.08 0.13 2.78* 0.23 2.84* 0.40
Number of obs 13757 12184
LR chi2 13015.33 13145.31
Prob> chi2 0 0
Log likelihood -8917.5376 -8453.7421
Pseudo R2 0.4219 0.4374
2007 2010
Experience 0.04* 0.01 0.04* 0.01 0.02 0.02 0.05* 0.01 0.05* 0.01 0.00 0.02
Experience Square -0.50* 0.10 -0.50* 0.20 -0.10 0.30 -0.80* 0.20 -0.80* 0.20 -0.10 0.30
Level 1 (d) 0.41* 0.20 0.74* 0.26 1.03* 0.50 0.2816 0.22 0.2179 0.30 -0.634 0.44
Level 2 (d) 1.46* 0.24 1.87* 0.29 2.34* 0.49 1.05* 0.22 1.26* 0.31 0.3483 0.45
Level 3 (d) 2.31* 0.28 2.81* 0.33 3.25* 0.53 1.96* 0.25 2.47* 0.35 0.86** 0.48
Level 4 (d) 2.31* 0.27 2.80* 0.36 3.22* 0.55 2.08* 0.26 2.40* 0.38 0.91** 0.48
Never Married (d) -0.24* 0.09 -0.31* 0.12 -0.68* 0.26 -0.22* 0.08 -0.47* 0.12 0.0109 0.23
WG & GS (d) -0.53* 0.08 -0.21* 0.13 -0.60* 0.18 -0.06* 0.06 0.51* 0.08 0.1304 0.11
Constant -1.33* 0.40 2.56* 0.37 2.53* 0.75 -0.92* 0.31 2.41* 0.34 5.68* 0.74
Number of obs 13588 15669
LR chi2 15162.17 16943.15
Prob> chi2 0 0
Log likelihood -8967.4028 -9643.7192
Pseudo R2 0.4581 0.4676
* & **, denote the statistical significant at 5% and 10% levels, respectively . (d) is a dummy variables
base category for multinomial logit equation is not working
Other category includes UNRWA, NGOs and Foreign and International employees
26
Table A9: Selectivity corrected estimates of wage equations for Palestinian females
1999 2001
Public Private Other Public Private Other
Variables B SE B SE B SE B SE B SE B SE
Experience 0.002 0.02 -0.006 0.02 -0.03 0.04 0.006 0.02 -0.02 0.02 -0.005 0.02
Experience Square (10-3 ) .20 0.40 .20 0.30 .70 0.80 .10 0.50 .40 0.30 .20 0.40
Level 1 (d) 0.24 0.35 -0.60* 0.22 0.52 0.38 0.45 0.52 0.16 0.22 0.06 0.27
Level 2 (d) 0.67** 0.41 -0.47 0.29 0.53 0.66 1.20** 0.65 0.13 0.27 0.25 0.37
Level 3 (d) 0.72 0.53 -0.16 0.68 0.59 1.55 1.51** 0.88 0.50 0.49 0.43 0.47
Level 4 (d) 0.92** 0.48 0.22 0.68 1.95* 1.04 1.24 0.75 -0.03 0.64 0.11 0.45
Never Married (d) -0.30* 0.10 -0.69* 0.16 -0.79 0.58 -0.26** 0.14 -0.50* 0.19 -0.27 0.25
WG & GS (d) -0.16* 0.06 0.02 0.15 -0.23 0.38 30.0 0.14 0.22 0.17 -0.04 0.14
Constant 1.31 0.98 3.48* 0.62 2.68* 0.95 -0.11 1.56 2.29* 0.81 3.46* 0.56
Number of obs 13100 11600
LR chi2 2264.32 2452.9
Prob> chi2 0 0
Log likelihood -2567.4793 -2731.4182
Pseudo R2 0.306 0.3099
2007 2010
Experience -.004 0.01 -0.02 0.02 -0.03 0.02 0.01 0.01 -0.07* 0.02 -0.03 0.02
Experience Square .10 0.30 .50 0.30 .90* 0.50 -.20 0.30 .80* 0.30 .30 0.50
Level 1 (d) -0.05 0.28 0.19 0.34 -0.28 0.40 0.07 0.19 -0.13 0.26 0.07 0.56
Level 2 (d) 0.25 0.27 0.17 0.33 -0.26 0.37 0.47* 0.21 -0.72* 0.26 -0.09 0.57
Level 3 (d) 0.03 0.32 0.28 0.40 -0.77* 0.41 0.47** 0.26 -1.40* 0.37 -0.70 0.69
Level 4 (d) 0.51 0.33 0.11 0.56 0 0.37 0.68* 0.33 -1.46 0.99 -0.07 0.86
Never Married (d) -0.06 0.10 -0.35* 0.16 0.03 0.26 -0.34* 0.15 -0.78* 0.19 -0.05 0.30
WG & GS (d) -0.11 0.09 0.24 0.19 0.14 0.21 -0.14** 0.09 -0.31 0.28 0.05 0.32
Constant 2.91* 0.62 1.87* 0.72 3.90* 0.59 1.59* 0.67 5.13* 1.21 4.19* 1.23
Number of obs 13287 16045
LR chi2 3113.14 3566.72
Prob> chi2 0 0
Log likelihood -3141.0857 -4215.9284
Pseudo R2 0.3314 0.2973
* & **, denote the statistical significant at 5% and 10% levels, respectively . (d) is a dummy variables
base category for multinomial logit equation is not working
Other category includes UNRWA, NGOs and Foreign and International employees
Education dummy: Level1: the less than secondary, Level2: secondary & lower Diploma, Level3: BA & high Diploma and
27
Table A10: Blinder-Oaxaca decomposition of selectivity corrected sector wage gap
Other Public M F M F
1999
Total ( R) 0.8729 0.0143 0.3975 -0.0392 Endowment (E) 0.0649 0.2143 -0.0235 0.2687 Coefficient ( C) 0.6969 -0.3770 0.2065 -0.3673 Interaction (I) 0.1112 0.1770 0.2145 0.0593 N1, N2 526, 7155 252, 294 3457, 7155 659, 294 2001 Total ( R) 3.0526 0.7803 2.6274 0.6030 Endowment (E) -0.1404 0.1368 -0.2259 0.1482 Coefficient ( C) 2.8407 0.3998 2.4861 0.3942 Interaction (I) 0.3523 0.2438 0.3671 0.0605 N1, N2 712, 4519 351, 264 4611, 4519 862, 264
2007
Total ( R) -0.4505 0.7694 -0.6952 0.7953 Endowment (E) -0.1520 0.2289 -0.1572 0.2664 Coefficient ( C) -0.6321 0.5928 -0.8449 0.5930 Interaction (I) 0.3336 -0.0523 0.3069 -0.0641 N1, N2 731, 1189 415, 94 4153, 1189 916, 94
2010
Total ( R) 0.9296 0.3259 0.6756 0.4028 Endowment (E) -0.2214 -0.1212 -0.0931 0.0997 Coefficient ( C) 0.8465 0.1483 0.4899 0.2151 Interaction (I) 0.3045 0.2989 0.2788 0.0880 N1, N2 643, 6870 429, 488 3547, 6870 1159, 488
N1, N2 are the number of observations for sector j and the private sector respectively
Estimates were obtained using Stata’s sub-module Blinder-Oaxaca decomposition (Jann, 2008).
The variables included in the log hourly wage are years of schooling, potential experience, quadratic potential experience, never married dummy, and West Bank dummy. The selection terms were household wage income, household size, and refugee status.
28
Table A11: Decomposition of selectivity corrected M/F wage differential by sector
Public Private Other
1999
Total ( R) -0.5288 0.1012 0.0317 Endowment (E) -0.1489 -0.1047 -0.0141 Coefficient ( C) -0.3984 0.1362 0.0294 Interaction (I) 0.0185 0.0697 0.0164 N1, N2 3457, 339 10141, 294 526, 131
2001
Total ( R) -0.1956 0.8410 0.1834 Endowment (E) -0.1308 -0.0977 -0.0843 Coefficient ( C) -0.0703 0.8859 0.2508 Interaction (I) 0.0054 0.0528 0.0169 N1, N2 4611, 414 6952, 264 712, 181
2007
Total ( R) -0.1570 0.8210 -0.3370 Endowment (E) -0.1324 -0.2062 -0.0589 Coefficient ( C) 0.0231 0.9332 -0.2371 Interaction (I) -0.0478 0.0939 -0.0410 N1, N2 4153, 140 7312, 94 731, 47
2010
Total ( R) -0.5268 -0.3348 1.2739 Endowment (E) -0.1674 -0.2131 -0.0640 Coefficient ( C) -0.3878 -0.1697 1.2719 Interaction (I) 0.0283 0.0480 0.0661 N1, N2 3547, 652 9429, 488 643, 211
N1, N2 are the number of observations for male and female regressions
The variables included in the log hourly wage are years of schooling, potential experience, quadratic potential experience, never married dummy, and West Bank dummy. The selection terms were household wage income, number of children less than 6, and refugee status.
29
References
Adamchik, V., Bedi, A.,2000. Wage Differentials between the Public and the Private Sector: Evidence from an Economy in Transition. Labor Economics Journal.7, 203-224.
Asaad, R., 1997. The Effect of Public Sector Hiring and Compensation Policies on the EgyptianLaborMarket.World Bank Economic Review. 11(1):85-118.
Becker, G.S., 1975. Human Capital, Second ed.The National Bureau of Economic Research, New York: Columbia University Press.
Blank, R., 1985.An Analysis of Workers’ Choice BetweenEmployment in the Public and Private Sectors. Industrial and Labor Relations Review. 38(2), 221-224.
Blau, F., Kahn, L., 2007. The Gender Pay Gap: Have Women Gone as Far as they Can?.Academy of Management Perspectives. 21(1),7.
Blender, A.S, 1973. Wage Discrimination: Reduced form and Structural Estimates. Journal of Human Resources. 8(4):436-455.
Borjas,G.J., 1980. Wage Determination in the Federal Government: The Role of Constituents and Bureaucrats. Journal of Political Economy. 88: 1110-1147.
Bourguignon, F., Fournier, M.,Gurgand, M., (2007). SELMLOG: Selection Bias Correction based on the Multinomial Logit Model Stata Command: selmlog (version 13, Aug. 2006), http://www.pse.ens.fr/gurgand, accessed Sep. 23rd 2011.
______(2007). Selection Bias Correction Based on the Multinomial LogitModel: Monte-Carlo comparisons. Journal of Economic Surveys, V21(1): 174-205.
Danh, N., Long, H., 2006.Public-Private Swage Differentials for Males and Females in Vietnam.Munich Personal RePEc Archive, MPRA Paper No. 6583
Daoud, Y., 2005.Gender Gap in Returns to Schooling in Palestine.Economic of Education Review. 24(6), 633-649.
Dustman, C., Van Soest, A., 1998.Public and Private Sector Wages of Male Workers in Germany.European Economic Review. 42(8): 1417-14441.
Ehrenberg, R.,Simth, R., 1991. Modern Labor Economics: Theory and Public Policy, fourth ed. Harper Collins, New York.
El-Jafari, M., Abu Hantash,I., Ali, S., 2008. The Role and Development in Enhancing the Competitiveness of the Palestinian Private Sector. Palestine Economic Policy Research Institute (MAS). Ramallah, Palestine. Falaris, E.M., 2004. Private and Public Sector Wages in Bulgaria. Journal of Comparative Economics. 32(1): 56-72
Gunderson, M., 1979.Earning Differentials between the Public and Private Sectors.Canadian Journal of Economics. 12(2): 228-242.
Heckman, J.J. 1974, “Shadow Prices, Market Wages and Labor Supply.”Econometrica 42: 679-694. Holmlund, B., 1993. Wage Setting in Private and Public Sectors in a Model with Endogenous Government Behavior.European Journal of Political Economy.9(2):149-162.
453-30
479.
Lewis, G., Galloway, C., 2011. A National Analysis of Public/Private Wage Differentials at the State and Local Levels by Race and Gender.Paper presented at the annual meeting of the Midwest Political Science
Association, 67th Annual National Conference, The Palmer House Hilton, Chicago.
Mataria, A., Barghouti, S. 2007. Wage Differentials In A Fast-Changing Environment: A SectoralAnalysis. Palestinian Economic Policy Research Institute (MAS).
Miaari, S. 2009.The Public -Private Wage Differential in TheWest Bank And Gaza Strip Before And During The Second Intifada.EUI Working Papers, MWP 2009/13, MAX Weber Porgramme.
Mincer, J., 1974.Schooling, Experience, and Earnings, National Bureau of Economic Research. New York: Columbia University Press.
Neuman, S., Oaxaca, R.L., 2004. Wage Decompositions with Selectivity-Corrected Wage Equations: A Methodological Note. Journal of Economic Inequality.2(1),3-10.
Niskanen, W.,1975.Bureaucrats and Politicians. Journal of Law and Economics.18 (3): 617-643.
O’Neill, J., 1985. The Trend in the Male-Female Wage Gap in the United States.Journal of Labor Economics. 3(1), 91-116.
Oaxaca, R., 1973.Male-Female Age Differentials in Urban Labor Markets.International Economic Review. 14(3):693-709
Palestinian Central Bureau of Statistics.Labor Force Survey. Different Years, Ramallah, Palestine.
Reder, W., 1975.The Theory of Employment and Wages in the Public Sector.In Labor in the Public and Public and Nonprofit Sectors, ed. Daniel S.Hamermesh. Princeton: Princeton University Press.
Reimers, C., 1983. Labor Market Discrimination against Hispanic and Black Men.Review of Economic and Statistics. 65 (4), 570-579.
Richwine, J.,2011. Same Worker, Higher Wage: A Study of Workers who Switch from Private to Federal Employment. Center for Data Analysis, No. 11-02.
Schultz, T.P. 1990. Testing the Neoclassical Model of Family Labor Supply and Fertility.Journal of Human Recourses 25:599-634.
Tansel, A.,2004.Public-Private Employment Choice, Wage Differentials and Gender in Turkey., IZA discussion paper No. 1262, Bonn Germany.
Tansel, A. and Daoud, Y., 2011. Returns to Education in Palestine and Turkey: A Comparative Analysis, IZA discussion paper No 5907, Bonn Germany.
Terrel, K., 1993. Public-Private Wage Differentials in Haiti: Do Public Servants Earn a Rent?.Journalof Development Economics. 42(2): 293-314
United Nations Conference on Trade and Development, 2008. Report on UNCTAD assistance to the Palestinian people. UNCTAD/TD/53/2.
United Nations Relief and Work Agency, 2006. Prolong Crisis in the Occupied Palestinian territory: Recent socio-economic Impacts on refugees and non-refugee. Gaza
31
World Bank, 2007. West Bank and Gaza Public Expenditure Review: From crisis to greater fiscal independence.World Bank.1, vi-vii.
i
Sector selection correction was applied using Bourguignon, F., Fournier, M.,Gurgand, M., (2007). selmlog program in Stata
ii
The other category includes wage employment in Non-government organizations, foreign government, international organization, UNRWA, and other undefined wage employment. This leaves out employers, self-employment, and unpaid family workers.
iii
The year 2007 witnessed a political separation between the West Bank and Gaza after Hamas took over Gaza. Since then, Israel launched a war in 2008 and enforced a blockade on Gaza resulting in a very distressed social and economic situation for Gazans.
iv
The refugee status refers to those who were expelled in 1948 and hold an UNRWA refugee card, they mostly reside in camps, but not limited to camps. Many of those joined the ranks of the Palestine Liberation Organization (PLO) and then became with the Palestine National Authority (PNA).
v
Jann (2008) also provides a user written add-on to Stata to implement the decomposition; this routine “Oaxaca” was used to carry out the decomposition.
vi
The analysis was carried out for the decomposition with years of schooling, potential experience, quadratic potential experience, West Bank and Gaza dummy, a never married dummy. The Oaxaca command was accompanied with Heckman (two step) selection correction using household wage income, refugee status and household size as sector selection identifiers.
vii
The predictors are schooling, potential experience, potential experience squared, never married and West Bank and Gaza dummy. When the Heckman 2-step procedure was used to correct for selection, 3 other variables were used: household total wages, household size, and refugee status.
viii