Munich Personal RePEc Archive
An optimization-based framework for
modeling counterterrorism strategies
Eiselt, H.A. and Bhadury, Joy and Burkey, Mark L.
University of New Brunswick, University of North Carolina at
Greensboro, North Carolina AT State University
2011
Online at
https://mpra.ub.uni-muenchen.de/47260/
This is a prepublication version of Eiselt, Bhadury, and Burkey forthcoming in OR Insight.
http://www.palgrave-journals.com/ori/index.html
An Optimization-Based
Framework For Modeling Counterterrorism Strategies
Eiselt HA
1, Bhadury J
2, Burkey ML
31
Faculty of Business Administration, University of New Brunswick, Fredericton, NB E3B 5A3 Canada
2
Bryan School of Business and Economics, University of North Carolina – Greensboro, Greensboro, NC 27402-6170, U.S.A.
3 School of Business and Economics, North Carolina A & T State University, Greensboro, NC, 27411,
U.S.A.
Abstract: The paper introduces the subject of terrorism and counterterrorism by means of a two-person bimatrix game that provides some insight into the behavior of the two players. We then examine three important areas in counterterrorism tasks: the detection of terrorist cells and how to render them inoperable, the fortification of assets in order to protect them from terrorist attacks, and the optimal evacuation of people from an area affected by terrorism. Basic mathematical models are formulated and demonstrated. The paper concludes with some thoughts on potential extensions of the models presented here.
1. Introduction
Following Rapoport (2004), the history of modern terrorism can be subdivided into four groups. The first
wave consisted of the anarchists, who formed in the 1880s. They were followed by the anticolonialists
(1920-1960), and the New Left (1965–1995), some whose major proponents were the “Irish Republican
Army,” the German “Red Army Fraction” (RAF), and the Italian’s “Red Brigades.” Even though early
terrorist groups were largely national, they did have connections to other groups, even though their goals
may have differed widely. A good example are RAF members Baader, Meinhof, and Ensslin, who went to
training camps in the Middle East that were operated by regional terrorist groups. For a short account of
the organization’s history, see, e.g., WordIQ (2010). The fourth and last wave (so far) is described to
consist of religious terrorists, who started acting in the 1990s. Weinberg and Eubank (2010) make
conjectures about the possible demise of wave four and the potential emergence of a fifth wave.
For a list of organizations considered by various Western nations as as well as India and Russia to fall
into the terrorist mold, see, e.g., List of designated terrorist organizations (2011). While the listing
includes regional groups such as the “Shining Path” in Peru, various Tamil groups, the Kurdistan Workers
Party (PKK), and some Irish terrorist groups (both green and orange), it is dominated by Islam terror
groups, who make up more than two thirds of the organizations. While possibly rooted in a specific
region, they have an international focus as far as their recruiting and activities are concerned.
Furthermore, regional U.S. groups such as the “Earth Liberation Front,” or “lone wolves” such as the
Unabomber and the Oklahoma bomber, are not listed. The State Department also keeps an up-to-date list
of groups that are consisted terrorist organizations.
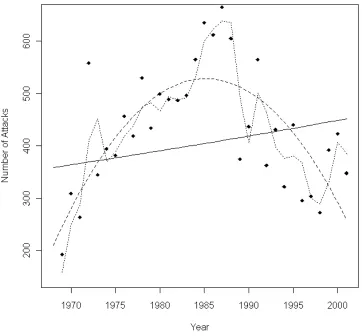
In order to obtain a feel for the magnitude of the problem, Figure 1 shows the number of terrorist attacks
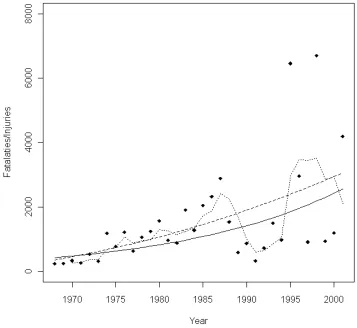
in the years 1961–2001. Figure 2 plots the number of fatalities (dead and wounded) that result from
terrorist attacks. The graphs are based on the contribution by Sandler and Enders (2004), who provide
historical data for the years 1968 – 2001. The solid lines are trend lines based on quadratic regression, the
broken lines are based on an exponential regression, and the dotted lines are based on moving averages.
Figure 1: The number of terrorist incidents from 1968 to 2001
The quadratic regression in Figure 1 appears to be a relatively good fit (a cubic regression looks very
similar) and it shows an actual decline of the number of terrorist acts over time. However, the image
changes dramatically, though, if we consider the number of fatalities (dead and wounded) over time.
Graph 2 shows a general increase, regardless of the type of regression that we use, with dramatic outliers
in 1995 and 1998.
Figure 2: The number of fatalities (dead and wounded) 1968 to 2001
The subject of this work, measures of counterterrorism, fall into a number of categories. One of the ways
of categorizing counterterrorism efforts is the proactive vs. reactive dichotomy. Among the proactive
measures is the profiling and identification of terrorists. Some of the techniques are outlined in Section
2.1. One may attempt the identification of terrorists by way of their behavior, the company they keep, the
language they use, their purchases, and other behavioral aspects. An important aspect is also the
identification of the terrorists’ objectives, which appears difficult, as terrorist groups tend to be
opportunistic, taking every opportunity to create havoc. Another proactive measure deals with the
possibility of fortifying the assets that a country has and needs to protect. Models of this type are
discussed in Section 2.2 of this paper. As long as such fortifications are without considering the terrorists’
objectives, such strengthening is arguably a very expensive shot in the dark. An excellent demonstration
of this effect the well-known Colonel Blotto game (see, e.g., Gross and Wagner, 1950), in which two
players fight for dominance on multiple battlefields. Each commander’s task is to assign armies to each of
the battlefields, and whoever has more armies on a battlefield wins. In the special version of relevance
here, the defender D has to protect a walled city with n gates. Both, the attacker A and the defender D now
assign armies to the gates. If the attacker has more armies at one of the gates, he can enter the city and
wins. In the context of the subject at hand, terrorists have to succeed only once to win, while the defender
has to win at all gates. This makes the game highly asymmetrical. On the other hand, it has been pointed
out that in the preparation of an attack, the attacker must succeed in each step, while the security forces of
the defender must succeed only once to intercept the plot. This does, at least to some extent, level the
playing field.
The costs of terrorism and counterterrorism are difficult to assess. Frey et al. (2007) estimated the cost of
terrorism to Europe in the 15-year period from 1974 to 1988 to be in excess of $16 billion, more than one
fifth of total tourism revenues. Costs of the September 11th, 2001 attack on the United States have been
estimated at $90 billion for New York City alone (Charters, 2007), while the total are often projected to
be in the trillions. However, according to Frey et al., the September 11 attacks are among the very few
terrorist acts that have had an actual negative impact on the economy (as indicated by a measurable
impact on the stock market lasting at least one week).
In comparison, the cost of mounting terrorist attacks is comparatively modest. The United Nations
estimates that most attacks cost in the range of US$50,000; for example, the Madrid bombings in 2004
that killed 191 people required a cash layout by the terrorist groups of no more than US$10,000 (The Age,
2004). This appears to show that the police adage to “follow the money trail” may not be very successful
in leading security forces to the perpetrators.
On the reactive front, there are ways to deal with a terrorist attack once such an attack has actually
happened. While useful minimizing the follow-up damage, many such plans amount to little more than
getting the wounded out of the area, burying the dead, and stabilizing the affected area. Evacuation
planning is discussed in Section 2.3 of this paper.
In order to determine what effects general behavioral assumptions have, we turn to game theory. In order
to explain the general idea, consider two players, viz., the defender D and the attacker A. Each of the two
players has a finite number of strategies, which they choose either simultaneously or sequentially. There
are two main solution concept: Nash equilibria and von Stackelberg solutions. Loosely speaking, a Nash
equilibrium is an arrangement, in which neither player has any incentive to unilaterally change his
strategy. As such, the existence of a Nash equilibrium is an indication of stability of the outcome. On the
other hand, von Stackelberg (sequential) games feature one player as the leader and his opponent as the
follower. The opponents are assumed to have complete and correct knowledge about the game and the
objective of their opponent. In order to solve a von Stackelberg game, we act recursively: we first
determine the follower’s reaction function by determining the follower’s optimal reaction to each strategy
of the leader. The leader will then know the consequence of each of his decisions, and can thus make an
optimal choice.
Typical scenarios of von Stackelberg leader-follower games include major pharmaceutical firms that
introduce new drugs (the leaders) and manufacturers of generic drugs (the followers). In order to make it
possible and interesting for a competitor to become a leader, he must have the resources to be a leader and
there must be an advantage to become the leader. If one of these two ingredients is missing, the game will
never be played as neither competitor can be or will want to be the leader. On the other hand, if there
exists an advantage to make the first move, a firm that is capable to do so will attempt to become a leader,
a result referred to as the “first mover paradox” in marketing circles; see, e.g., Ghosh and Buchanan
(1988).
Comparing the strategies of the leader and those of the follower, it immediately becomes apparent that the
situation is not symmetric: while the leader has to guard against all possible actions of the follower by
making assumptions concerning the goals and actions of the follower, the follower has no such problem.
In the context of optimization, leader-follower games are modeled as bilevel programming problems.
While the follower’s problem is typically not too difficult, the leader’s problem uses input parameters that
are the result of the follower’s optimization problem. In other words, we have nested optimization
problems. With the exception of very specific scenarios, such problems pose tremendous computational
difficulties. Standard references for bilevel programming problems are Bard (1999) and Dempe (2002).
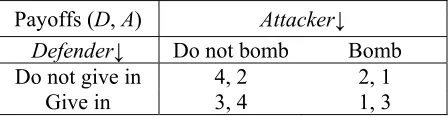
In the attacker–defender game, assume that the defender D has only two options, viz., give in to terrorists’
demands, or to not give in. Similarly, the attacker (i.e., the terrorists) A can either bomb the victim or
refrain from doing so. This scenario results in four possible outcomes for each pair of (D, A) strategy
combinations: (do not give in, do not bomb), (do not give in, bomb), (give in, do not bomb), and (give in,
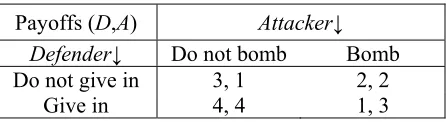
bomb). In order to simplify the exposition, we create a matrix, in which the rows refer to the defender’s
strategies, while the columns represent the strategies of the attacker. The strategy combination with the
highest utility is assigned a “payoff” of 4, the next highest a 3, then 2, and finally the lowest-ranking
strategy combination receives a utility of 1. Since the utility functions of the defender and the attacker are
obviously different, the first “payoff” in the matrix refers to the utility of the defender, while the second
number refers to the utility of the attacker. A reasonable matrix is then as follows.
Payoffs (D, A) Attacker↓ Defender↓ Do not bomb Bomb Do not give in 4, 1 2, 2
Give in 3, 4 1, 3
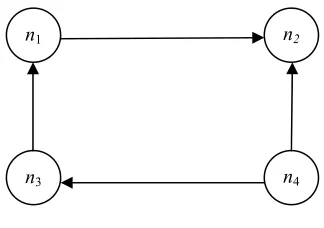
Note that D’s “Do not give in” strategy actually dominates his “Give in” strategy, so that D will never
give in. The situation may be further clarified by constructing the reaction graph that belongs to this
matrix. Its construction (see, e.g., Eiselt and Sandblom, 2004) assigns a node ni to each of the four
strategy combinations and an arc from one node to another, if the unilateral action of one of the two
players results in a move from one outcome to another. Clearly, a player will only engage in such
unilateral action if it is in his own best interest.
n1 n2
n4
[image:9.612.175.337.269.383.2]n3
Figure 3
In order to explain, suppose that D has tentatively decided to give in to A’s demands and A has tentatively
decided not to bomb, meaning that the scenario under consideration is shown as node n3. The defender’s
choices at this point are only to choose between give in or not, meaning stay at n3 or move to n1. Since n1
has a utility of 4 to D, while n3 only has a utility of 3, D would prefer to move to n1. Similarly, suppose
that the scenario n1 would be tentatively chosen, and A would ponder the situation. A’s only option is to
either not bomb (i.e., stay at n1 or bomb, meaning move to n2. Since A has a higher utility to bomb, he will
move from n1 to n2.
It is apparent that the state n2 is a Nash equilibrium, as neither player has an incentive to unilaterally move
out of n2. For the von Stackelberg game with D as leader (a natural choice, as the defender will signal first
that he will or will not give in to terrorist demands), the reaction function includes the “bomb” strategy if
the defender announces not to give in, and the attacker’s “do not bomb” strategy, in case the defender
signals that he will give in. The defender’s better choice is for the defender to give in, so that the outcome
(give in, do not bomb) results.
Suppose now that D has developed a tool that makes it very expensive for A to carry out a bombing. As a
result of this change, A’s preference ordering changes slightly to that shown in the matrix below.
Payoffs (D, A) Attacker↓ Defender↓ Do not bomb Bomb Do not give in 4, 2 2, 1
Give in 3, 4 1, 3
The reaction graph for this situation is now shown below.
n1 n2
n4
[image:10.612.195.419.249.308.2]n3
Figure 4
It is apparent that while D’s strategy “Do not give in” still dominates his “Give in” strategy, A’s strategy
“do not bomb” now dominates his “bomb” strategy. The result of the seemingly minor change is a new
Nash equilibrium at the node n1, where D does not give in and A does not bomb. As a matter of fact, this
is the strategy that many states have been following during the last decades: trying to make the “bomb”
option for the terrorists less attractive in case the state does not give in to the terrorists’ demands. The von
Stackelberg solution is the same as the unique Nash equilibrium.
Back in the original situation, it is not only the terrorists’ perception of their utility that may change. In
reality, the game (or, more realistically, many similar games) is/are repeated many times, and both players
will be able to observe and learn from each other’s reactions. Over time, the attacker may succeed in
conveying the message that a victim is better off, if they were to give in (by making concessions), if the
terrorists do not bomb. The revised payoff table would then be as follows:
Payoffs (D,A) Attacker↓ Defender↓ Do not bomb Bomb Do not give in 3, 1 2, 2
Give in 4, 4 1, 3
[image:11.612.196.419.222.283.2]The reaction graph of this payoff matrix is shown below.
Figure 5
n3
n2
n1
n4
It is apparent that there are now two equilibria, the hawkish “do not give in” and “bomb” combination,
and the dovish “give in” and “do not bomb” combination. While the dovish combination is preferred by
both players, it is not obvious whether or not negotiations can result in that solution, as negotiations
require communication and trust, ingredients not likely to exist in this context.
Take now a step back and consider again the “payoffs” we have been using in the above analysis. Just like
profits in the context of business, the payoffs for each of the two players comprise “revenues” and
“costs.” For the defender, the (monetary) costs include, but are not limited to, added security measures,
coupled with a general decrease of efficiency and thus slowed growth of GDP, while the “revenue”
consists of “success stories,” such as reports concerning averted attacks. On the other hand, the terrorists’
costs are the fatalities on their side that occur during the attack and the penalty their members are assigned
if and when they are caught. On the “revenue” side, there is the added recognition among their peers and
the ego boost of being associated with a successful attack against a much more powerful opponent, fueled
through much media attention. It appears that the (potential) victim can best work with the revenue and
cost of the terrorists, as its own costs and revenue are more or less fixed, given that they try to avert a
possible attack. In an open society, there is little that the defender can do regarding the revenue, as it does
not control the media that will report successful and unsuccessful incidents (and, by doing so, in the eyes
of the terrorist potentially advertise and glorify their deeds). On the side of the terrorists’ costs, even
drastic penalties such as public hangings (assuming that such actions were feasible) will do little to a
group of people who think very little of their own life when considering their “cause.” It is mandatory that
the defender uses the attacker’s utility function when dealing with them, rather than their own. One of the
difficulties is that a democratic state is bound by many checks and balances, prohibiting many potentially
effective courses of action as they would infringe on civil liberties. Terrorists have, of course, no such
considerations, making the struggle skewed and asymmetric.
2. The Models
The models we discuss address a number of relevant questions in the context of counterterrorism. One of
the obvious questions is “who?” as it identifies the personnel involved in the activities. Pertinent tools are
monitoring the internet, phone lines, social networks, purchases of suspect materials (a measure that may
work in case of ingredients for “dirty bombs,” but will utterly fail in the case of seemingly innocent tools
such as box cutters), the infiltration of terrorist groups or the (less expensive) use of informants. Similar
counterterrorism measures apply to discovering “how” the next attack is to be carried out, as well as
“where will they strike?”, “what facility will they attack?”, or “whom are they trying to assassinate?”
need to be addressed. Protective measures (also referred to as “hardening”) can and have been used.
Identification cards are now required in many official buildings, security screening at airports and
government buildings is a standard procedure, and closed-circuit TV cameras are ubiquitous. The
question “when” is probably beyond the ability of analysts to answer, as terrorists tend to be opportunists,
who strike whenever an opportunity presents itself. There may be important dates, such as September 11
or certain holidays or other special days, because symbolism holds a special place in terrorist motivation
in many cases.
A very important consideration concerns the objectives of terrorists. Typically, it is assumed that terrorists
have grievances—however ill-conceived—that, at least in their opinion, can only remedied by violent
means. The very insightful paper by Abrahms (2008) disputes this claim. In contrast, the author
demonstrates that terrorist groups have continued to survive even after their demands have been met, and
that groups with strongly divergent objectives have worked together, while others, whose goals are quite
similar, have fought among themselves for dominance. The lack of obvious objectives will make it very
difficult to actually predict future terrorist moves. Maybe it is this lack that has prompted some
researchers to liken the spread of terrorist cells to the spread of cancer, whose only obvious objective is to
grow; see, e.g., the paper by Carley et al. (2003) about bioterrorism. This is also in line with Niskanen’s
(1968) model of people with power, whose objectives are to maximize their own budgets and power,
rather than to accomplish a particular goal.
Sageman (2004) provides an interesting account concerning the motivations of individuals who have
joined a global jihad. His conclusions are pretty much in line with those outlined in the aforementioned
work by Abrahms (2008). In a follow-up work, Sageman (2008) discusses the radicalization and asserts
this to be a collective, rather an individual, process. Hoffman (2006) disputes some of Sageman’s theses.
2.1 Identifying the Players
This section deals with issues and tools regarding (1) the identification of the individuals who are
(potentially) involved in terrorist activities, and (2) a plan for their elimination. It should be noted that all
methods of intelligence gathering deal with some sort of surveillance, making them subject to legal and
privacy issues (see e.g. Posner, 2008). The key to intelligence gathering is profiling, i.e., the association
of individuals with traits, (political, ethnic, or religious) groups, things they purchase, places they
congregate either in person or in other places such as on the internet (particularly the “dark web,” see,
e.g., the University of Arizona’s Artificial Intelligence Lab), the flow of money they spend, other people
whom they communicate with (in person, via phone internet, or any other means), and similar issues.
Activities of individuals can be observed in all of their communications with other people, be it on social
networks, emails, phone calls, their physical gathering at meeting places, or by way of their transfers of
money or goods. The study of social networks began with Milgram (1967) who initiated the concept of
“six degrees of separation.” Early (successful) techniques include McGehee’s (1983) “village survey
method” and traffic analysis.
The first task is to distill a network of potential terrorists from the huge pool of users of email, social
networks such as facebook and twitter, and other information. This network can be modeled as an
undirected graph G = (V, E,) with sets of nodes N and undirected edges E. Each node ni represents one
individual, an edge eij that connects nodes ni and nj indicates that there has been some communication
between the two individuals whose nodes are connected. In addition, it may be useful to assign numbers
to edges or arcs that symbolize the strength of the connection, such as the magnitude of the money
transfer, the number of calls made during the course of a week between any two people, and so forth.
Graphs that show “relations” between individuals could have edges symbolize kinship and other relations,
the flow of money between individuals, or the flow of commands. In the latter two cases, it is mandatory
to use dynamic networks, as is also customary in models of disease propagation.
From the terrorists’ point of view, they will attempt to organize their cells with a number of objectives in
14
mind. On the one hand, the communication structure must be simple so as to avoid unnecessary
communication errors, while the potential for detection and the damage done by interrogation of captured
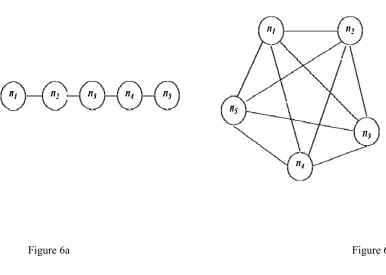
cell members should be minimized as well. The two extremes shown in Figures 6a and 6b may explain
the concepts.
Figure 6a Figure 6b
The structure in Figure 6a is extremely simple. Its advantage is that the detection of any element and its
subsequent removal and interrogation cannot result in the further detection of more than two other
elements in the cell. The downside concerns the length of the lines of communication: in the worst case,
when n1 wants to communicate with n5, the path includes actually four edges, i.e., four individual
communications. In contrast, Figure 6b allows direct communications between all cell members. At the
same time, though, the detection of any individual could expose the entire cell.
When analyzing the structure of a network, it is useful to express the characteristics of its nodes by some
[image:15.612.80.466.192.467.2]to indicate a central figure in a cell, who is hopefully the ringleader of the cell. Some of the measures are
the degree of a node, the 1-median, and the node through which lead the largest number of shortest paths
between all pairs of nodes (dubbed the betweenness centrality). These measures may help to identify the
actual structure of a terrorist cell and help distinguish between leader, lieutenants, and foot soldiers.
However, as with any proxy, the measure may not express exactly what it sought: a node with a large
degree may simply be a middleman that is used by a cell leader to hide his own identity and avoid being
detected. Krackhardt’s kite graph in orgnet.com (2011) is an excellent example of an organizational
structure and some of the centrality measures. Skillicorn (2009) uses the graph structure to measure the
importance of a node by means of adjacency matrices and eigenvectors. Rhodes (2009) describes a
technique to infer the structure of a terrorist cell on the basis of sample information.
A number of insurgency cell models can be found in Political Research Associated (2010). Krebs (2002)
analyzes the observed communications of the nineteen September 11 terrorists in his contribution and
Rodriguez (2005) displays the network of the Madrid bombers. Regarding the organizational structure of
terrorist cells, Klerks (2001) points out that criminal organizations (he mainly investigates organized
crime in The Netherlands) are no longer hierarchically structured, but opportunistic and likely to change.
An update is provided by Krebs (2008). A similar account is provided by Barr and Baker (2001), who
report that the “Earth Liberation Front” does not have a clear chain of command that would destroy the
functionality of the cell once the leader has been eliminated. This is very much in line with Bin Laden’s
assertion concerning the 9/11 bombers (Transcript DoD, 2001) that
“Those who were trained to fly didn’t know the others. One group of people did not know the other group.”
Farley (2003) does not work with the undirected communication graphs outlined above, but instead uses
directed graphs to model a cell’s command structure. His main contribution is a formula that calculates
the probability of a cell being rendered inefficient if k out of its n members have been randomly
eliminated. His formula assumes that we do know how many members the cell has and how the structure
of the cell is organized.
An obvious question is then whom to eliminate if the members and the organizational structure of the cell
are known. This problem can easily be formulated as a standard set covering model. In particular, suppose
that the estimated costs of eliminating node ni are ci, and and let aik = 1, if node ni is located on path k.
Observe that this formulation will require us to enumerate all paths from the leader to any of the foot
soldiers. While this task is normally huge, the moderate size of the cells and the typically sparse
communication structure in the cell renders these concerns irrelevant Defining now binary variables yi,
which assume a value of 1, if node ni is to be eliminated, and 0 otherwise. We would like to point out that
the different “costs” to take out a cell member is in large part determined by the fact that cells may be
physically located in areas over which the defender has no jurisdiction. The set covering model can then
be written as
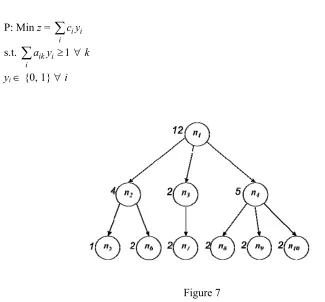
P: Min z = i i
i c y
∑
s.t. ik i 1
i
a y ≥ ∀k
∑
yi∈ {0, 1} ∀i
[image:17.612.104.429.381.683.2]Figure 7
As a numerical illustration, consider the graph in Figure 8, in which n1 is the leader of the cell, n2, n3, and
n4 are lieutenants, and n5, …, n10 are foot soldiers. In order to render the cell inefficient, all chains from
the leader to each of the foot soldiers have to be interrupted. Suppose that this is done by eliminating
individual elements of the cell. The numbers next to the nodes in the Figure indicate the costs that are
incurred to eliminate each of the elements. It appears reasonable that leaders are more protected and thus
more costly to eliminate than foot soldiers. The optimal solution in this small example is to go after
lieutenant n4, foot soldiers n5 and n6, and either lieutenant n3 or foot soldier n7 for a total cost of 10.
Carley et al. (2002) discuss how the centrality of nodes in a social network may be used to identify the
leader of a cell. In particular, they point out the potential destabilization of the removal of a leader due to
multiple successors and potential infighting. Also, one of the main ideas to identify (automatically or
semi-automatically) a terrorist cell in social networks is by comparison with random groups. Gutfraind
(2009) constructs a dynamic model of terrorist cells with leaders and foot soldiers. Using differential
equations, he demonstrates the importance of eliminating foot soldiers. He also points out the importance
of successes of a cell on future recruiting, and that prolonged inactivity will most likely result in a cell’s
demise. Finally, Bobeica et al. (2008) perform semantic analyses of text messages among group members
so as to determine whether or not the group plans an attack. The tool has great potential for automation,
but the massive amounts of data and the possibility of coded and ever-evolving language present major
challenges.
2.2 Protecting the Assets
The issue in this section is how to protect buildings, roads, dams, pipelines, airports, and other essential
parts of the infrastructure from terrorist attacks. As far as the structure of the conflict is concerned, we
revert again to game theory with two players, the defender D and the attacker A. As any analysis of a
game, it is crucial to know what each of the parties actually knows about its opponent’s strategies and
objectives. In the simplest case, assume that A and D agree on the types of the infrastructure (from here
on collectively referred to as “assets”) that are to be attacked and defended; let these assets be collected in
the set J. Furthermore, suppose that A has announced that he will attack all assets in J. The victim will
now plan to fortify (also referred to as “harden”) his assets so as to minimize the damage done by the
terrorist’s actions. In this context, Church et al. (2004) discuss the reliability of assets, while the more
recent contribution by Church and Scaparra (2007) discusses the fortification of assets. A probabilistic
model is discussed by Pinker (2009), whose investigation includes warnings and the actual deployment of
resources in the presence of a threat.
As an aside, assets are not necessarily just important parts of the infrastructure, buildings or similar assets.
As Silke (2008) points out, few terrorist attacks use CBRN (chemical, biological, radiological, or nuclear)
weapons. In particular, since homicide bombers prefer to cause as much personal injury as possible,
“assets” in the widest sense can also include crowded places or any sites at which significant numbers of
people congregate.
We would also like to mention that in this paper, we will exclusively look at the damage done in terms of
lives and property lost. This is by no means to say that this is the only relevant measure in this context. If
one’s home gets burglarized, there is a tremendous loss of trust and faith, even if no property was taken at
all. In the military context, Captain Doolittle’s raid on Japan in April 1942 caused little visible damage,
but this was the first time that the citizens of Japan saw the war happening on their own territory. Due to
their extreme difficulty of measuring psychological effects of this nature, while important in their own
right, are not considered in this paper.
Suppose now that terrorist and victim are both aware what the damage is likely to be if no fortification
(beyond what security exists at the present) is undertaken, and what the damage will be, if the asset is
fortified. The difference is the “price” of not fortifying an asset. At this stage, we assume that an asset can
either be either fortified or it is not. Furthermore, the victim also knows how much it costs to fortify each
of the assets. Typically, the victim’s budget is not sufficient to fortify all assets, so that a choice must be
made. The victim’s choice will be to minimize the damage done by the terrorist, given that the victim
fortifies only as many assets as the budget allows. As the damage is defined as the difference between the
value of an asset before the attack and after the attack and since the value before an attack is a constant,
while the value after the attack depends on whether or not the asset is fortified), we may alternatively
maximize the residual value of the asset.
Formally, defining cj as the residual value of the j-th asset after it has sustained an attack while not
fortified, and define cj as the value of the asset after an attack in case it has been fortified. The benefit of
protection is then Δj = cj – cj. Furthermore, let aj denote the cost of fortifying the j-th asset let b be the
given budget. Then we can define binary decision variables yj, which assume a value of one, if the victim
decides to fortify the j-th asset, and zero if this is not the case. The problem of optimally allocating the
budget so as to minimize the total damage (or, alternatively, maximize the residual value) can then be
written as
P: Max z =
(
j j j)
j
c + Δ y
∑
s.t. j j
j
a y ≤b
∑
yj = 0 or 1.
Note that the first term in the objective function is a constant, so that we actually maximize the sum of
marginal benefits of the fortification. It is apparent that this version of the problem has no spatial
embedding and is nothing but the well-known knapsack problem, see, e.g., Martello and Toth (1990).
Furthermore, the model assumes not only that the terrorist will attack all targets simultaneously, but also
that the attacker has full, correct, and complete knowledge of the damage he can do.
A minor extension of the knapsack problem occurs, if the defender has chosen classes of assets and wants
to ensure that at least one asset in each class is defended. This means that for each class Ck, the defender
will define a constraint
. 1 k j j C y ∈ ≥
∑
This is a knapsack problem with generalized upper bounding constraints of the type discussed by Eiselt
(1986).
Alternatively, we could also consider a model that allocates scarce resources to the protection of assets.
This model is continuous, but its objective is nonlinear. The idea behind this model is that the marginal
utility of protection is decreasing. Define xj as the amount of resources allocated to the j-th asset and let
fj(xj) denote the protection afforded by the j-th asset, if xj resources are allocated to it. The simplest model
will then attempt to maximize the overall protection that is possible within a budget b, so that we can
write
P: Max z = j( )j
j
f x
∑
s.t. j
j
x ≤b
∑
xj≥ 0 ∀j.
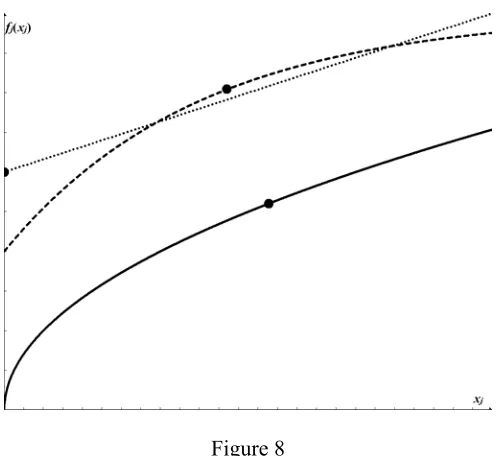
As a numerical example, consider three assets, whose protection functions are f1(x1) = 5 x1 , f2(x2) =
2
.05
50 30 x
e−
− , and f3(x3) = 30 + .4x3. With b = 50 resource units available, we could use simple bisection
search on the slopes of the functions to arrive at the optimal allocation of x1=27.1267, x2=22.79, and
3 0
x = for residual values of the assets of 26.0416, 40.4866, and 30. The protection functions for the three
assets are shown as solid, broken and dotted lines, respectively, in Figure 8. The optimal levels of
protection are indicated on that figure as dots.
Figure 8
Another possible and potentially important extension occurs if we drop the assumption that terrorist and
victim have the same state of knowledge concerning the damage an attack can do. One of the few works
dealing with different perceptions in a location model with competing players is Eiselt (1998). Bier et al.
(2007) allow different perceptions as to the value of a target’s protection/destruction.
Comparing the strategies of the leader and those of the follower, it immediately becomes apparent that the
situation is not symmetric: while the leader has to guard against all possible actions of the follower by
making assumptions concerning the goals and actions of the follower, the follower has no such problem.
All he needs to do is observe the course of action of the leader and then make the decision that is in his
own best interest.
2.3 Minimizing the Damage
So far, all the models that we have discussed assume planning has been done prior to a terrorist attack
with the objective of minimizing the fallout should one occur (considering the fact that the attack may
have compromised some of the evacuation routes as well). An entire stream of research deals with
optimal responses given that an attack has occurred. Most such works go under the topic of “Disaster
Planning” or “Evacuation Planning”. Waeckerle (1991) is a good source regarding the medical response
to such attacks. As far as evacuation planning is concerned, a standard reference is Perry et al. (1981). It
is interesting to note that the subject of optimally designing evacuation routes has received considerable
attention in the operations research and computer science literature; see for example Osman et al. (2009),
Lu et al. (2003), de Silva and Eglese (2000), just to name a few. Hamacher and Tjandra (2002) provide a
good reference for research on this subject.
Whereas these models are developed for evacuation of people from various unsafe sites to safe ones, little
work has been done on the optimal evacuation planning of multi-level buildings. One reference is by
Osman (2009), who addresses that problem by modeling and visualizing evacuation routes from low-rise
regional buildings and out of an affected area and develops and proposes optimization models for the
problem. In this context, the account by Waldau et al. (2006) concerning the evacuation of the World
Trade Center during and after the September 11 attacks is an important contribution. Finally, it is
important for counterterrorism planning to locate facilities such that if the need arises, evacuation
planning is as expeditious as possible. In other words, what is needed are models that integrate evacuating
planning into facility location and facility layout decisions. Due to the inherent complexity of these
models, they have not been widely studied. Notable exceptions are Sherali et al. (1991) and Eiselt (1985).
The first paper develops both a planning and an operational computer-based tool through a particular
location-allocation model that selects a set of candidate shelters from among a given set of admissible
alternatives in a manner feasible to available resources, and prescribes an evacuation plan which
minimizes the total congestion-related evacuation time. Computational experience is also provided
against a set of realistic test problems formulated on the Virginia Beach network. In contrast, the second
paper, Eiselt (1985) describes a location model, in which given numbers of “supplies” (i.e., people,
vehicles, or any similar entity) are to be routed parallel to the axes (such as in cities planned on a grid), so
as to minimize the maximal flow. The underlying assumption is that the larger the traffic volume, the
higher the propensity of panic, confusion, and the slower the actual evacuation.
Finally, what the literature presently misses are models that integrate facility location, interdiction and
evaluation planning. Given the complexity of such models, the most practical plan of research would be
to develop initial models involving few facilities on simple graphs (linear graphs or trees) and use the
insight gained to propose heuristics for more complex and realistic problems.
The following paragraphs present a somewhat generic model that chooses emergency exits among a
number of possible locations (determined by an engineering feasibility study), and then routes people
from their present location to an exit or any other safe area. In order to implement the results, it would be
most beneficial if the system were automated in the following sense. Sensors count the number of people
walking into rooms, so that a system knows at any point in time how many people are present in different
locations of the building. Whenever there is a change (i.e., somebody walks from one room into another),
the system recomputes the optimal evacuation routes in real time. The results of that optimization process
are then displayed outside each room, where arrows, not unlike the emergency floor lighting in airplanes,
direct individuals from their present location to a safe place.
One limitation of this formulation is that it only addresses the task of getting people out. At the same
time, though, first responders would have to get in. Not only does this opposing flow make the problem
significantly more difficult, but it also—and arguably more importantly—adds to the confusion and panic.
Given this scenario, we can formulate an optimization problem as follows. For the purpose of simplicity
of the exposition, we ignore the temporal component, which means that we assume that all edges can be
passed in unit time. In real life, we would work with (typically very large-scale) dynamic networks. First
assume that the rooms and walkways of the building are displayed as a graph G = (N', E) with the set of
nodes N' = (n1, n2, …, nn) and the set of edges E = (eij: i, j, ∈N'). Each node represents a room with si
denoting the number of people in it at some chosen point in time. Suppose now that I denotes the set of all
locations, in which people are present (i.e., the set of rooms), and J is the set of potential exits, which are
also represented by nodes in N. For convenience, we connect all nodes in J with an artificial node nn+1,
which represents the safe place (or “outside,’ if you will). Denote now the total set of nodes N = N' ∪
{nn+1}. Also, we have penalty functions f(xij) for all edges in the network. These penalty functions indicate
the penalty to the walkway eij that results if xij people use that walkway or corridor. We only require that
f(xij) are increasing functions of xij. One simple penalty function uses the capacity κij of edge eij, so that
f(xij) = xij/κij, which is nothing but the proportion of the used capacity of the edge. The higher this
proportion, the more highly congested the edge is, and the more reasons for panic and delays. This means
that the penalty function is to be minimized. However, since each walkway produces such a penalty, we
will have to determine an overall penalty by “somehow” aggregating individual penalties. In our example
below, we choose to use an objective that minimizes the maximum individual proportional usage of any
of the edges.
Defining binary locational variables yj, which assume a value of one, if we choose to locate an exit at
node j∈J, and zero otherwise, and continuous variables xij, which denote the flow of people from node ni
to node nj, we can formulate a basic location-flow evacuation model as follows:
P: Min z = max {xij/κij} s.t. ij ji i
j j
x − x =s ∀ ∈i N
∑
∑
xj,n+1≤Myj∀j∈J
j j
y = p
∑
xij≥ 0 ∀i∈I, j ∈J.
The first |N| constraints ensure that all people leave the rooms, the second |J| constraints, in which M >> 0
denotes a suitably large constant, ensure that the flow of people is directed only through exits that actually
exist, and the last constraint ensures that exactly p exits are located, a number that is chosen by the
decision maker, e.g., the fire marshal, or building engineer. If the emergency exists have already been
located, the problem reduces to a simple minimax flow problem.
As a numerical example, consider the graph in Figure 9, where the numbers next to the nodes indicate the
number of people located at the nodes, and the numbers in round brackets next to the edges indicate the
[image:26.612.231.384.573.719.2]capacities of the walkways. The broken lines to node n6 show the exits and paths to the safe place.
Figure 9
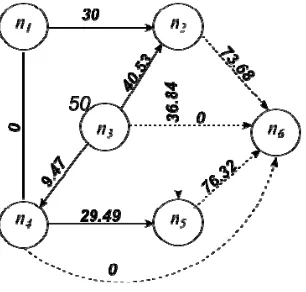
The optimal solution of the problem is shown in Figure 10. It is important to realize that the bottlenecks
in the network are the flows on the arcs e32, e45, e25, and e26, all of which have a capacity utilization of
36.84%, which appears quite reasonable.
Figure 10
However, observe that while some of the people who either are at node n2 or who enter node n2, are
directed from that node directly to the safe place n6, while others are first sent to node n5. This is not only
unacceptable, but also very confusing, requiring a modification of the model that guarantees that all
people, once that have arrive at one room, get directed to the outside along the same walkways. “Single
source” models of this type have been discussed in the literature by Galvao and Marianov (2011).
3. Summary and Research Outlook
This paper first outlines a general game-theoretic model of attacker and defender that provides some
insight into the players’ reactions given some ordinal ranking of preference functions. We then describe
mathematical methods for some of the major areas that deal with international terrorism: the detection of
terrorist cells, the optimal fortification of assets, and the optimal evacuation given existing buildings and
areas. The models described here are, of course, simplistic. The idea is to provide a starting point for
future research and to outline potential directions that may improve knowledge about and understanding
of potential reactions of terrorists to defenders’ policies and ways to deal with strikes once they have
happened.
Much work remains to be done, particularly in the area of “detect and destroy.” The present knowledge
concerning terrorist cells (at least the part that is available in the open literature, which, given the nature
of the field, will be very much limited), their organization, and their command structure is crude and
insufficient. One potentially interesting thread of research is the use of game-theoretic models that
involve network design. In particular, we refer to competitive models, in which the attacker designs the
cell he wants to use for future attacks with the objective to minimize detection, while maintaining easy of
communication. The defender will attempt to optimally intercept the cell structure. In this game, the
attacker is the von Stackelberg leader, while the defender is the follower. An analysis of the modus
operandi of the terrorists regarding their choice of targets will improve solutions that deal with the
fortification of assets. Opportunistic attackers will result in a fortification strategy by the defender that is
close to a maximin solution. Finally, major improvements of practical evacuation models will devise
systems for street closures (to let first responders to the site) and appropriate (and simple) escape routes
for victims. Again, network design techniques can be used to plan access routes given that an asset is hit.
Furthermore, one may also plan for added protection if access routes are destroyed as well.
An important strand of research involves the design of terrorist cells. Given the (reasonable) assumption
that terrorists are actively and intelligently planning the design of their cell structure, Hartnell and
Gunther (2009) show how one such robust cell structure could look like. Knowledge of this result can
accommodate the defender in their task to detect, destroy, and defend their assets.
Acknowledgments
This research was in part supported by a grant from the Natural Sciences & Engineering Research Council of Canada under grant number 0009160. This support is gratefully acknowledged. The insightful comments of an anonymous referee are much appreciated. They helped streamline the exposition.
References
Abrahms M (2008). What terrorists really want: terrorist motives and counterterrorism strategy.
International Security31/4: 78-105.
Artificial Intelligence Lab, The University of Arizona, http://ai.arizona.edu/research/terror/, last accessed on November 24, 2011
Bard JF (1999). Practical bilevel optimization: Algorithms and applications, Springer-Verlag.
Barr D, Baker A (2001). Getting the message from “eco-terrorists:” mystery group takes its campaign east. New York Times, January 8, 2001: A15.
Bier V, Oliveros S, Samuelson L (2007). Choosing what to protect: strategic defensive allocation against an unknown attacker. Journal of Public Economic Theory9:563-587.
Bobeica M, Jéral J-P, Garcia T, Best C (2008). A quantitative analysis of “root causes of conflict,” pp. 115-139 in Chen HC, Reid E, Sinai J, Silke A, Ganor B (eds.) Terrorism informatics: knowledge management and data mining for homeland security, Springer-Verlag, New York.
Carley K, Fridsma D, Casman E, Altman N, Chang J, Kaminsky B, Naves D, Yahja A (2003). BioWar: scalable multi-agent social and epidemiological simulation of bioterrorism events. NAACSOS Conference 2003, Day 4, Electronic Publication, Pittsburgh, PA, IEEE SMCA03-11-0274.,
http://www.casos.cs.cmu.edu/publications/papers/carley_2003_biowarscalablemulti.pdf, last accessed on November 24, 2011
Carley KM, Lee J-S, Krackhardt D (2002). Destabilizing networks. Connections 24/3: 79–92.
http://www.insna.org/PDF/Connections/v24/2001_I-3-10.pdf, last accessed on November 24, 2011.
Charters DA (2007) 9/11: Seven years into history. The Journal of Conflict Studies 27/2: 173-187.
Church RL, Scaparra MP (2007). Protecting critical assets: the r-interdiction median problem with fortification. Geographical Analysis39, 129-146.
Church RL, Scaparra MP, Middleton RS (2004). Identifying critical infrastructure: the median and covering facility interdiction problems. Annals of the Association of American Geographers94, 491-502.
Dempe S (2002). Foundations of bilevel programming, Springer-Verlag.
de Silva FN, Eglese RW (2000). Integrating simulation modelling and GIS: spatial decision support systems for evacuation planning. The Journal of the Operational Research Society51/4: 423-430.
Eiselt, H.A. (1985). A location problem with minimax objective. pp. 85-99 in Noltemeier, H. (ed.),
Proceedings of the WG ’85: International Workshop on Graphtheoretic Concepts in Computer Science, Universitätsverlag R. Trauner, Linz, West Germany.
Eiselt HA (1986). Continuous maximin knapsack problems with GLB constraints. Mathematical Programming36/1: 114-121.
Eiselt HA (1998). Perception and information in a competitive location model. European Journal of Operational Research108/1: 94-105.
Eiselt HA, Sandblom C-L (eds. & authors) (2004). Decision analysis, location models, and scheduling problems. Springer-Verlag, Berlin-Heidelberg-New York.
Farley JD (2003). Breaking Al Qaeda cells: a mathematical analysis of counterterrorism operations (a guide for risk assessment and decision making),” Studies in Conflict and Terrorism 26: 399-411.
Freeman L (1977). A set of measures of centrality based on betweenness. Sociometry40: 35-41.
Frey, BS, Luechinger, S, Stutzer A (2007). Calculating tragedy: assessing the costs of terrorism. Journal of Economic Surveys21/1: 1-24.
Galvao RD, Marianov V (2011). Lagrangean relaxation-based techniques for solving facility location problems. pp. 391-420 in Eiselt HA, Marianov V (eds) Foundations of location analysis. Springer-Verlag, New York.
Ghosh A, Buchanan A (1988). Multiple outlets in a duopoly: a first entry paradox. Geographical Analysis
20/2: 111-121.
Gross O, Wagner R (1950). A continuous Colonel Blotto game. Research memorandum, The Rand Corporation RM-408.
Gutfraind A (2009). Understanding terrorist organizations with a dynamic model. Studies in Conflict and Terrorism32/1: 45-59.
Hamacher H, Tjandra S (2002). Mathematical modeling of evacuation problems: a state of the art. pp 227-266 in: Pedestrian and Evacuation Dynamics, Schreckenberg M, Sharma SD (eds). Springer-Verlag, Berlin.
Hartnell B, Gunther G (2009). Security of underground resistance movements, pp. 185-204 in: Memon N, Farley JD, Hicks DL, Rosenorn T (eds.) Mathematical methods in counterterrorism, Springer-Verlag, Vienna.
Hoffman B (2006). Inside terrorism. Columbia University Press, New York, NY.
Klerks P (2001). The network paradigm applied to criminal organisations: theoretical nitpicking or a relevant doctrine for investigators? Recent developments in The Netherlands. Connections24/3: 53– 65.
Krebs VE (2002). Mapping networks of terrorist cells. Connections 24/3: 43–52.
Krebs V (2008). Connecting the dots: connecting two identified terrorists.
http://www.orgnet.com/tnet.html last accessed on November 24, 2011.
List of designated terrorist organizations (2011). http://en.wikipedia.org/wiki/Terrorist_groups, last accessed November 24, 2011.
Lu Q, Huang Y, Shekhar S (2003). Evacuation planning: a capacity constrained routing approach.
Proceedings of the 1st NSF/NIJ conference on Intelligence and security informatics. Springer-Verlag Berlin, Heidelberg.
Martello S, Toth P (1990). Knapsack problems: algorithms and computer implementations. Wiley-Interscience, Chichester.
McGehee RW (1983). Deadly deceits: My 25 years in the CIA. Sheridan Square Publications, New York.
Milgram S (1967). The small world problem. Psychology Today, May issue: 60-67).
Niskanen WA. (1968). The peculiar economics of bureaucracy. The American Economic Review 58(2): 293–305.
Orgnet.com (2011). Social network analysis. A brief introduction. http://www.orgnet.com/sna.html, last accessed November 24, 2011.
Osman MS, Ram B, Stanfield P, Davis L, Samanlioglu F, Bhadury J (2009). “Optimization models for distributed scheduling for disaster area logistics,” Proceedings of the IEEE International Conference on Service Operations, Logistics, and Informatics, Chicago, IL.
Osman MS (2009). Evacuation route optimization models for low-rise building groups. Dissertation thesis at Department of Industrial and Systems Engineering, NC A&T State University, North Carolina.
Perry RW, Lindell MK, Greene M (1981). Evacuation planning in emergency management. Lexington Books, Lexington, Mass.
Pinker EJ (2009). A mathematical analysis of short-term responses to threats of terrorism, pp. 141-160 in: Memon N, Farley JD, Hicks DL, Rosenorn T (eds.) Mathematical methods in counterterrorism, Springer-Verlag, Vienna.
Political Research Associates (2010). The roots of the leaderless resistance concept.
http://www.publiceye.org/liberty/terrorism/insurgency/cells.html, last accessed on November 24, 2011.
Rodriguez JA (2005) The March 11th Terrorist Network: in its weakness lies its strength. WP EPP-LEA: 03, http://www.ub.edu/epp/wp/11m.PDF, last accessed on November 24, 2011?
Posner RA (2008). Privacy, surveillance, and law. The University of Chicago Law Review75/1: 245-260.
Rapoport D (2004). The four waves of modern terrorism. In Cronin A, Ludes J (eds) Attacking Terrorism. Georgetown University Press, Washington, DC, pp. 46–73.
Rhodes CJ (2009). Inference approaches to constructing covert social network topologies, pp. 127-140 in: Memon N, Farley JD, Hicks DL, Rosenorn T (eds.) Mathematical methods in counterterrorism, Springer-Verlag, Vienna.
Sageman M (2004). Understanding terror networks. University of Pennsylvania Press, Philadelphia, PA.
Sageman M (2008) Leaderless Jihad. University of Pennsylvania Press, Philadelphia, PA.
Sandler R, Enders W (2004). An economic perspective on transnational terrorism. European Journal of Political Economy20: 301-316.
Sherali HD, Carter TB, Hobeika AG (1991). A location-allocation model and algorithm for evacuation planning under hurricane/flood conditions. Transportation Research Part B: Methodological Volume
25/6: 439-452.
Silke A (2008). Research on terrorism: A review of the impact of 9/11 and the global war on terrorism, pp. 27-50 in Chen HC, Reid E, Sinai J, Silke A, Ganor B (eds.) Terrorism informatics: knowledge management and data mining for homeland security, Springer-Verlag, New York.
Skillicorn D (2009). Extracting knowledge from graph data in adversarial settings, pp. 33 – 54 in: Memon N, Farley JD, Hicks DL, Rosenorn T (eds.) Mathematical methods in counterterrorism, Springer-Verlag, Vienna.
State Department (2011) http://www.state.gov/. last accessed November 24, 2011
The Age (2004). http://www.theage.com.au/articles/2004/08/27/1093518081060.html, last accessed on November 24, 2011.
30
Transcript of Usama Bin Laden Video Tape, December 13, 2001
http://www.defense.gov/news/Dec2001/d20011213ubl.pdf, last accessed on November 29, 2011.
Waeckerle JF (1991). Disaster planning and response. New England Journal of Medicine324/12: 815-21.
Waldau N, Gattermann P, Knoflacher H, Schreckenberg M (eds) (2006). Pedestrian and evacuation dynamics ’05. Springer-Verlag, Berlin-Heidelberg.
Weinberg L, Eubank W (2010). An end to the fourth wave of Terrorism? Studies in Conflict & Terrorism
33/7: 594-602