Munich Personal RePEc Archive
Do pension wealth, pension cost and the
nature of pension system affect coverage?
Evidence from a country where
pay-as-you-go and funded systems coexist
Carpio, Miguel Angel
Universidad de Piura
21 November 2011
Online at
https://mpra.ub.uni-muenchen.de/34926/
Do pension wealth, pension cost and the nature
of pension system affect coverage? Evidence from
a country where pay-as-you-go and funded
systems coexist
Miguel Ángel Carpio
∗November 15, 2011
Abstract
This paper proposes a nested model, based on an additive random util-ity model, to analyze whether pension wealth and pension cost affect the probability that a worker affiliates to a pension program, and to observe differentiated effects regarding the nature of the pension system (pay-as-you-go or funded). The analysis focuses on Peru because the peculiar coexistence of a pay-as-you-go and a funded system allows observing first whether a worker is subscribed or not, and then his choice between pay-as-you-go and funded system. The data consists in five cross sections from the ENAHO between 2005 and 2009. Results show that changes on costs have a greater impact over the probability of affiliation than changes on benefits, and that changes affect more when applied to the funded system than when applied to the pay-as-you-go. Variables related with the con-tracting firm have a large impact. Hence, this paper provides a tool to evaluate measures to solve the coverage problems of pension programs.
JEL codes:H55; J32; J82
Keywords:pension; coverage; pay-as-you-go; funded; nested; pension wealth.
∗Associate Professor, Department of Economics, Universidad de Piura. Email address:
1
Introduction
The performance of a pension program is usually assessed by considering its coverage, which can be defined twofold. On one hand, coverage refers to the proportion of the elderly population protected by the program. On the other hand, coverage refers to the proportion of young adults affiliated to the pro-gram or, if the indicator looks to predict future protection more effectively, to the proportion of those paying contributions to the program. This paper focuses on coverage of young adults.
The coverage of pension programs is low in several countries, with special em-phasis in Latin America. Rofman, Lucchetti and Ourens (2008), who collected information on coverage based on households surveys, show that less than 40% of the labor force made regular contributions to pension systems in eleven of the fifteen Latin American countries considered in the mid 2000s. It is noteworthy that low coverage is a problem that neither countries that preserved pay-as-you-go systems nor countries that introduced funded pension systems have solved. How would the uncovered workers finance their consumption when they retire? Would the traditional intergenerational arrangements be enough in a context of population aging?
There is little empirical evidence useful to increase coverage because of two problems. First, the lack of microeconomic data on expected benefits and costs of the pension programs has led the analysis to focus on probability models that include many explanatory variables related to the individual (mainly, income and age) and its labor position. This strategy does not help to improve the design of pension programs because it does not identify whether the effect of these variables operates through benefits, costs or other channel. Second, the fact that Peru and Colombia are the only countries where the pay-as-you-go and the funded systems coexist has led the literature to analyze the coverage problem for one system or the other, but not in a comparative way.
This paper analyzes empirically whether the probability that a worker is cov-ered by the Peruvian pension program is determined by pension wealth, pension cost and the nature of the pension system. The analysis is conducted for Peru because, as opposed to other countries, the pension reform of 1993 established that a worker has the opportunity to choose between a pay-as-you-go system and a funded system. The coexistence of these systems is unusual since a group of reforming countries introduced a funded system by phasing out the preexist-ing pay-as-you-go system and another group created a unified multiple pillars system. The data consists in five cross sections of a Peruvian household survey carried out by the Peruvian Statistics Institute between 2005 and 2009.
future benefits from retirement, is constructed for each worker in the survey under the three possible alternatives: not subscribed to any pension system, subscribed to the pay-as-you-go system and subscribed to the funded system. Pension cost, defined as the discounted sum of contributions until retirement, is computed similarly. In both cases, the analysis focuses on workers that receive monetary income, including wage workers and self-employed workers.
The second stage proposes a nested model, based on an additive random util-ity model, to analyze the subscription of the worker to the pension program, observing first whether he is subscribed or not, and then his choice between the pay-as-you-go and the funded systems. An additional model observes first whether the worker is contributing to the pension program or not, and then what system receives the contributions. The explanatory variables of interest are pension wealth and pension cost, which vary over the worker and the alter-native. A set of controls that vary over the worker are also included, such as income, age and characteristics of the employer.
Results from both models are similar. On one hand, the affiliation model con-firms that pension wealth has a positive impact on affiliation, while pension cost has a negative impact. The marginal effects’ analysis reveals additional patterns. First, a small change on pension cost has a greater impact over affiliation than the same change on pension wealth, which holds in both the pay-as-you-go sys-tem and the funded. Second, changes over the funded syssys-tem have larger impact over affiliation than changes over the pay-as-you-go system, which is true for both pension wealth and pension cost. Hence, the nature of the pension system (whether it is pay-as-you-go or funded) affects the impact of pension wealth and cost over affiliation. On the other hand, the contribution model shows that pension wealth does not have a significant impact on contribution, while pen-sion cost does have a negative impact. Again, the marginal effects’ analysis reveals that a change on pension cost has a larger impact in the funded system than in the pay-as-you-go. Finally, a number of control variables have a signif-icant impact over affiliation and contribution, such as income, age, as well as self-employment, number of workers and economic sector of the contracting firm.
The literature review confirms that the analysis of pension programs does not incorporate information on benefits and costs, and that research has focused in each system in isolation. Holzmann, Packard y Cuesta (2000) use a cross section for Chile and Argentina. Auerbach, Genoni y Pagés (2007) use many cross sections for Brazil, Chile, Colombia, Costa Rica, El Salvador, Nicaragua and Peru. The results show that the income and age variables are significant, but do not establish whether they affect the subscription directly or through expected benefits or costs.
al-ternatives: subscribed to the pay-as-you-go system, subscribed to the funded system and not subscribed at all. Although this document does explore the dif-ferential effects taking into account the nature of the regimes, the explanatory variables do not include specific characteristics of the pension systems. Besides, the author points out that the multinomial model used is not econometrically appropriate because there is substitution between the alternatives, and he pro-poses a nested model as a future line of research.
This paper contributes to the literature on three dimensions. First, it con-structs variables associated with benefits and costs of pension programs, for both pay-as-you-go and funded system. These variables allow the direct evalua-tion of its impact over affiliaevalua-tion and contribuevalua-tion to pension programs. Second, the paper uses the coexistence of the two systems in Peru to find differentiated effects of changes on benefits and costs over affiliation and contribution. Fi-nally, it provides an econometric tool to evaluate the possible impact of policy measures to solve the low coverage of pension programs.
This paper is organized as follows. Section 2 explains the Peruvian regulatory framework at the time of analysis. Section 3 presents a simple theoretical model, modified from Galiani and Weinschelbaum (2007). Section 4 briefly presents the database. Section 5 describes the empirical methodology. Section 6 presents the estimation strategy and results of the construction of pension wealth and cost. Section 7 presents the results. Finally, section 8 concludes.
2
Institutional framework
The Peruvian pension model consists of three independent regimes: the pay-as-you-go system1, the funded system2and the military and police pension system.
The first two are aimed at civilian workers from both private and public sectors, while the latter is aimed exclusively at police and armed forces. There is a fourth system aimed at particular groups of civil servants3, but it was closed to new
members due to severe financial problems. In short, a civilian worker currently has the pay-as-you-go system and the funded system available for membership.
The pay-as-you-go system provides benefits set through a legal formula that yields pensions proportional to an average of final salaries. It includes minimum and maximum pensions, which had the purpose of introducing income redistri-bution. This system is managed by a public office attached to the Ministry of Economics and Finance. Despite a series of modifications on its parameters (age of retirement, minimum contribution period, contribution rate, etc.) this
1Created by Law Decree N◦19990.
2Created by Supreme Decree N◦054-97-EF. 3
regime is in financial deficit4.
The funded system was introduced in 1993 as part of a structural reform. Peru was the second country to privatize social security, a reform conducted by 28 countries in the last years. The funded system provides benefits based on the contributions made by the worker along its individual career, so that pensions are the result of individual saving and the return on those savings. This system does not have a redistribution purpose. It is managed by private pension funds administrators under the supervision of a public agency.
The coexistence of the pay-as-you-go and the funded systems is an almost unique characteristic of the Peruvian pension model. Mesa-Lago (2002) di-vides the structural pension reforms implemented on Latin-American on three groups: 1) substitution model, which involves the closure of the pre-existing pay-as-you-go system and the opening of a fully funded system (Chile, Bolivia, El Salvador, Mexico); 2) mixed model, which introduces a funded pillar within the pre-existing pay-as-you-go system (Argentina and Uruguay); and 3) parallel model, which maintains the pay-as-you-go system and introduces the funded system as an alternative (Peru and Colombia).
Membership to pension systems is legally compulsory for wage employees and voluntary for self-employed workers. For a wage worker, the employer is required to withhold pension contribution from his wage and pay this amount to the pay-as-you-go system or to the funded system, accordingly. For a self-employee, he must report the contribution that corresponds to his wage and pay this amount to the corresponding system.
What are the affiliation and transfer rules between systems? Newcomers in the labor force are able to choose between the pay-as-you-go and funded sys-tem, while individuals in the labor force at the time of reform were allowed to stay in the pay-as-you-go system and to switch to the funded system. Indi-viduals switching from the pay-as-you-go to the funded system are entitled to recognition bonds if they have made a minimum number of past contributions, which increases their future pensions. The return from the funded system to the pay-as-you-go system is allowed only for special cases specifically included in the legal framework, such as workers affiliated without their explicit consent or workers that had fulfilled the requirements for a pay-as-you-go pension at the time of their affiliation to the funded system.
The costs applicable to the members of both systems are similar. The pay-as-you-go system applies a rate of 13% to wage. The funded system applies a contribution rate to the pension fund equal to 10% of wage (however, succes-sive laws set the contribution rate at 8% from 1997 to 2005). Additionally, the
funded system applies a commission rate for the pension funds administrator and an insurance premium rate that covers the risks of death and disability. These two rates are freely determined by each institution. The sum of the rates is, in all cases, somewhat lower than 13%.
Retirement age is 65 in both systems and the mechanisms of pension bene-fits computation within the pay-as-you-go and funded systems are explained in detail in the next sections.
The calculation of the pensions is different in each system. In the pay-as-you-go, pensions are calculated using a legal formula and require a minimum of 20 years of contributions. In the funded system, pensions are calculated as a direct func-tion of the accumulated resources in an individual account during the working life and do not require a minimum number of years of contributions. Appendix A explains in detail the computation of pensions within systems.
3
Theoretical Framework
This model departs from Galiani and Weinschelbaum (2007). They develop a model that, as opposed to the pre-existing literature, includes worker’s decisions as a determinant of the formality level of the economy, where formality is defined as the right to exercise health insurance as a socially mandated benefit. This model defines formality as the right to exercise retirement pensions and allows two coexisting pension systems. Hence, the model helps observing the determi-nants of the formality level of the economy and the size of the pay-as-you-go and the funded systems, including pension benefits and costs of each system.
The model assumes that there are four types of agents: firms, workers, gov-ernment and pension funds administrator. Firms, heterogeneous in their man-agerial ability, maximize profits by choosing between formality and informality, and by hiring labor. Workers, heterogeneous in their human capital endow-ment, maximize utility by choosing whether to work in the formal or informal sector. If they work in the formal sector, they also have to choose between the pay-as-you-go and the funded system. The government collects payroll taxes, provides pensions based on the pay-as-you-go system and discourage informal activities. The pension funds administrator collects contributions and provides pensions based on the funded system. The behavior of the former two agents is not modeled.
3.1
Firms
distributed according to the density functiong(a) in theR+ support.
Each firm takes two decisions: the number of units of labor hired and the market where they operate. On one hand, if a firm opts for the formal market, the profit function is given by:
πf(l) =pf(a, l)−wfl(1 +t)−τ (6)
Wherepis the price,f(a, l) is the production function,wf is the wage per unit
of labor paid in the formal market,tis the tax levied on firms5andτis the fixed
cost of operating formally. On the other hand, if a firm opts for the informal market, the expected profit function is:
πi(l) = [pf(a, l)−wil]∗(1−q) (7)
Wherewi represents the wage per unit of labor paid in the informal market and
q represents the probability that the government detect the informal firm, in which case the firm loses profits.
The model assumes that the homogeneous good is sold in a competitive market and that, for simplicity, its price is equal to one. In the same way, the labor market is assumed to be competitive. Finally, the production function is Cobb-Douglas with constant returns to scale: f(a, l) =aβl1−β
Firms maxime profit by choosing the quantity of labor demanded. A firm with managerial abilityahas the following demand functions, as operating formally or informally:
lf =a
1−β
wf(1 +t) 1/β
(8)
li=a
1−β
wi 1/β
(9)
Note that both derived demand functions are linear in managerial ability.
The profit functions Q f(a) y
Q
i(a) can be easily obtained inserting the
de-mand functions (8) and (9) in the equations (6) and (7), respectively. Figure 1 shows how the functions depend on the inherent managerial ability.
5
Figure 1: Profits as a function of managerial ability
The fixed costτ of formality determines that firms with less managerial ability find more profitable to operate in the informal sector. To the extent that a firm has more managerial ability, the profits of operating formally increase relative to the profits of operating informally if the condition dΠf(a)
da >
dΠi(a)
da holds,
which means:
1
wf(1 +t)
1−β β
>(1−q)
1
wi
1−β β
(10)
The condition (10) is necessary for the existence of the formal and the informal sector, as it is observed.
From the equality Πi(¯a) = Πf(¯a), is possible to implicitly define the critical
pointathat determines two groups: 1) the firms with managerial abilitya < a, which informally operate, and 2) the firms with managerial abilitya > a, which formally operate.
The total labor demand is composed of the formal market demand and the informal market demand, according to the following expression:
Ld(wf, wi) =lfd(wf, wi) +ldi(wf, wi)
where:
lfd(wf, wi) = Z ∞
¯
a
a
1
−β wf(1 +t)
1/β
ldi(wf, wi) = Z ¯a
0
a
1−β wi
1/β
·g(a)da
3.2
Workers
Workers are endowed with units of homogeneous labor (l), which are distributed by the density functionh(l) in theR+support. In order to consider social
pro-tection against old age, the original model is converted to a two-period model. In the first period, the worker has to adopt a unique decision: whether to sell the units of labor to a formal firm or to an informal firm. However, if he decides to sell to a formal firm, the employee must further decide whether to affiliate to the pay-as-you-go system or to the funded system. In the second period, the worker in the formal sector receives a pension according to the chosen system and the worker in the informal sector does not receive any pension.
The utility function of a formal worker who opts for the pay-as-you-go system is:
upayg(l) =wfl(1−tpayg)−γ+
bpayg
1 +ρ (11)
Wherewf is the wage per unit of labor, l is the total assigned and sold units
of labor, tpayg is the contribution to the pay-as-you-go system, γ is the fixed
cost for working in the formal sector, bpayg is the pension provided by the
pay-as-you-go system in the second period andρis the intertemporal discount rate. According to the nature of the pay-as-you-go system, the future pension is assumed to be constant and financed by contributions collected from young workers in the second period.
The utility function of a formal employee who chooses the funded system is:
uf unded(l) =wfl(1−tf unded)−γ+bf unded
1 +ρ (12)
where:
bf unded= (1 +r)tf undedwfl
wheretf unded denotes the rate of contribution to the pension fund andbf unded
represents the pension received. Note that, according to the nature of the funded system, this pension is equal to the contribution made in the first period multiplied by the return rateroffered by the pension funds administrator6.
Finally, the expected utility of a worker who chooses the informal sector is:
ui(l) =wil(1−q) (13)
where wi represents the wages per unit of labor in the informal sector and q
represents again the probability that the government detects the informal firm, in which case the firm closes and the worker does not receive any payment7.
Obviously, the worker chooses the alternative that means getting the highest utility. Figure 2 shows how the utility functions given by (11), (12) and (13) depend on the number of units of labor innate to each worker. The present value of the pay-as-you-go pension is assumed to be smaller than the fixed cost associated to formality, i.e., bpayg
1+ρ < γ. In this framework, since clearly dupayg(l)
dl <
duf unded(l)
dl , it is possible to have workers spread over the three
al-ternatives only if dui(l)
dl is smaller than a certain critical value. This critical
value is equal to the slope of the ray joining the origin to the intersection where
upayg(l) =uf unded(l). It can be shown that this condition is equivalent to the
following expression:
dui
dl <
dupayg(l)
dl +wftf unded(1+r)
1 1 +ρ−
γ bpayg
+wf(tpayg−tf unded)
1−γ(1 +ρ) bpayg
(14)
Condition (14) is necessary to allow the formal and the informal sectors to co-exist, as well as the pay-as-you-go and the funded systems. Intuitively, if the payroll tax of the pay-as-you-go system is bigger or equal to the rate of con-tribution of the funded system, condition (14) can be interpreted as follows: a labor market with a funded system would demand a parallel pay-as-you-go system if, for example, the pension in this system (bpayg) is high enough, or if
the fixed cost associated with working in the formal sector (γ) is low enough.
Figure 2: Utility as a function of the labor units
The fixed cost associated with formality determines that workers with a low endowment of labor find more profitable the informal market. To the extent that labor endowment increases, the utility of working formally rises in both systems. However, the marginal utility is greater in the funded system than in the pay-as-you-go system because more labor in the former system not only allows a higher salary in the first period, but also a higher pension in the second period.
From the equalities ui( ¯l1) = upayg( ¯l1) and ui( ¯l2) = uf unded( ¯l2), it is
possi-ble to explicitly define two critical points ¯l1and ¯l2that determine three groups:
1) workers with labor endowmentl <l¯1, who work informally; 2) workers with
labor endowment ¯l1< l <l¯2, who work formally and choose the pay-as-you-go
system; and 3) the workers with labor endowmentl > l¯2, who work formally
and choose the funded system.
The listed critical values correspond to the following expressions:
¯
l1=
γ−bpayg
1+ρ
wf(1−tpayg)−wi(1−q)
(15)
¯
l2= bpayg
wf(1 +r)tf unded+wf(1 +ρ)(tpayg−tf unded)
This analysis, as previously noted, assumes that the time-discounted pay-as-you-go pension is smaller than the fixed cost associated to formality. Assuming otherwise, it is possible to have workers spread over the three alternatives only if dui(l)
condition given by (14) holds. This case will not be discussed in this paper8.
The total labor supply consists of the formal sector supply and the informal sector supply, according to the following expression:
Ls(wf, wi) =lfs(wf, wi) +lis(wf, wi) =Ls
where:
lfs(wf, wi) = Z l¯2
¯
l1
lf(l)dl+
Z ∞
¯
l2
lf(l)dl
lis(wf, wi) = Z l¯1
0
lf(l)dl
Since labor is inelastically offered (the individual does not choose how much to work, only in which sector), wages do not determine the total number of supplied hours, but only the composition between formal and informal sectors.
3.3
Equilibrium
An equilibrium is ahwf, wi, lfs, lis, l f d, ldi
i
vector such that there is a market clear-ing in both the formal and informal sectors:
lfs(wf, wi) =lfd(wf, wi) (17)
lsi(wf, wi) =lid(wf, wi) (18)
The analysis is restricted to equilibriums where, according to reality, formal and informal markets exist, so as the pay-as-you-go and the funded systems. Hence, wages are assumed to fulfill conditions (10) y (14).
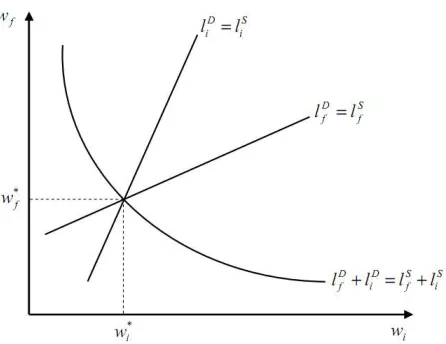
In order to provide a graphical representation of equilibrium, we first draw the locus of wages wf(wi) where the total labor demand is equal to the total
labor supply, that is Ld(wf, wi) = Ls. As it can be shown by deriving this
equality with respect towt, the curve wf(wi) is downward-sloping as long as
the derivative of the total demand function with respect to each wage is negative.
The graphical representation of equilibrium is completed by drawing the wage pairswf(wi) where labor demand and labor supply are equal within each sector
of the economy. If equations (17) and (18) are derived with respect towi, the
following expressions can be obtained for the formal and the informal sector, respectively:
dwf
dwi
=−
∂lf s(wf,wi)
∂wi −
∂lf d(wf,wi)
∂wi
∂lfs(wf,wi)
∂wf −
∂lfd(wf,wi)
∂wf (19) dwf dwi =− ∂li s(wf,wi)
∂wi −
∂li d(wf,wi)
∂wi
∂li s(wf,wi)
∂wf −
∂li d(wf,wi)
∂wf
(20)
Although it is easy to conclude analytically that both derivatives are posi-tive, determine further which one is bigger requires two additional observations. First, given that total labor supply is inelastic, changes in wages only generate migration from one market to another, that is:
∂lf
s(wf, wi)
∂wf
=−∂l
i
s(wf, wi)
∂wf
∂lf
s(wf, wi)
∂wi
=−∂l
i
s(wf, wi)
∂wi
Second, since total labor demand is assumed negative with respect to wages, a wage increase in one market implies a decrease in labor demand in that market that exceeds the increase in labor demand in the other market. Specifically:
−∂l
f
d(wf, wi)
∂wf
> ∂l
i
d(wf, wi)
∂wf
∂lfd(wf, wi)
∂wi <−
∂li
d(wf, wi)
∂wi
Figure 3: Equilibrium wages in the formal and informal markets
The model formally identifies a number of factors that affect coverage of pen-sion programs, as well as the choice between the pay-as-you-go and the funded system. Productivity of workers, which is directly related with their wages, ensures a minimum income to face the costs of formality, but also increases contributions to pension systems and raises pension levels. Since these changes have effects of different sign over the probability of being formal, an empirical model on coverage should simultaneously include income, pension wealth and pension cost. Another identified factor is managerial ability of firms, which is directly related with the number of hired workers, because allows affording the fixed and variable costs of formality. Finally, the probability that a firm is caught operating informally also affects formal hiring. Hence, an empirical model on coverage has to account for all these effects.
4
Database
Microdata used in this study consists in five cross sections of a Peruvian house-hold survey called "‘Encuesta Nacional de Hogares" (National Househouse-hold Survey, ENAHO), carried out by the Peruvian Statistics Institute (INEI) since 1997, of which we have used databases from 2005 to 2009.This survey, applied through-out the Peruvian territory, has approximately 400 questions on demography; family income and family spend; wealth and education of their members, hous-ing characteristics, social programs access, among other variables.
paper considers surveys only from year 20059.
The ENAHO has an annual sample size equal to twenty thousand households and allows obtaining estimations for different levels of inference that reach the 24 departments of Peru, each one as a domain study. The methodology of esti-mation to process the data of the ENAHO involves the use of a weighting factor for each register.
The unit of analysis in this study is the individual of the labor force, occu-pied and paid, with age between 25 and 65 and residents of urban areas of Peru. The analysis excludes workers that receive only non-monetary compensations because the design of pension systems assumes the receipt of monetary income10.
The lower limit of 25 years is established because, as explained below, the con-struction of the pension wealth variable requires assuming that the educational level does not change across time. The upper limit of 65 years is introduced because the analysis is oriented to active workers, but not to the retired ones. Residents of rural areas are excluded because their economic activities are infor-mal and oriented to the self consumption. Hence, social security has historically excluded them or has reached them with social assistance programs. Finally, the analysis excludes the members of the military and police pension system and the members of the special system aimed at particular groups of civil ser-vants because the affiliation to these systems has a different nature from the pay-as-you-go pension system and to the funded pension system.
The resulting database for the five years of observation contains information for 79.717 individuals, which 21.664 claim to be affiliated to the funded system, 6.984 to the pay-as-you-go system and 51.069 unaffiliated. The section 7.1.1 will show the descriptive statistics about these groups.
5
General methodology
5.1
Additive random utility model
An Additive Random Utility Model (ARUM) for pension status is described, based on the theoretical model described in section 3. This theoretical model consideres that a worker has a utility level associated to deterministic factors for each of the following three situations: unaffiliated to a pension system, affiliated to the pay-as-you-go system and affiliated to the funded system. The proposed ARUM adds an unobserved random component to each utility, with mean zero
9Questionnaires of the ENAHO from 1999 to June 2004 asked if the individual was affiliated to any pension system (without specifying to what system) and under what labor condition was affiliated (salaried or independent). The ENAHO of 1999 and 2000 additionally asked the pension funds administrator to which he was affiliated.
and variance equal to one, such that the equations (11),(12) and (13) can be reexpressed as:
upayg(l) =wfl(1−tpayg)−γ+ bpayg
1 +ρ+ǫpayg (11
′ )
uf unded(l) =wfl(1−tf unded)−γ+bf unded
1 +ρ +ǫf unded (12
′ )
ui(l) =wil(1−q) +ǫi (13′)
The structural model of interest is characterized by equations (11′ ), (12′
) and (13′
). Recall that wages of the formal and informal sector, represented by vari-ables wf and wi respectively, come from equalizing labor demand and labor
supply in the formal and informal sectors. Hence, the parameters that charac-terized the profit-maximization of firms (benefits and pension costs, detection probability, taxes to the employer, fixed cost of operating formally, etc.) are found in the above equations through the equilibrium wage.
The empirical analysis is performed on a simplified structural model, assum-ing linear relationships between the utility levels and the variables considered. Let indext∈[1, n] denote the worker and indexj∈ {1,2,3}denote the alterna-tive as: unaffiliated to a pension system, affiliated to the pay-as-you-go system and affiliated to the funded system.
ut,1(l) =vt,1+ǫt,1 (21)
ut,2(l) =vt,2+ǫt,2 (22)
ut,3(l) =vt,3+ǫt,3 (23)
The deterministic model is given byvt,j =x′t,jβ+z
′
tδj, where xt,j are the set
of variables that change with the worker and the specific alternative, whilezt
are the set fo variables that change only with the worker. The subsection 5.2 presents the explanatory variables.
The empirical model implies observing the dependent variable yt = j if that
Pij =P r(yt=j)
=P r(ut,j≥ut,k) f or all k
=P r(ut,k−ut,j≤0) f or all k
=P r(ǫt,k−ǫt,j≤vt,j−vt,k) f or all k
The model is estimated by maximum likelihood. The density function for worker
tis:
f(yt) =pyt,
1
t,1 ∗p
yt,2
t,2 ∗p
yt,3
t,3 (24)
whereyt,1, yt,2,yt,3 are indicator variables withyt,1= 1 ifyt=j and yt,1= 0
otherwise. That is, for each worker only one variable of the setyt,1,yt,2,yt,3is
equal to one.
The maximum likelihood function for a sample ofnobservations is the product ofndensities, so thatL=Qn
t=1
Q3 j=1p
yt,j
t,j . The maximum likelihood estimator h
ˆ
β,δˆj i
maximizes the logarithm of the maximum likelihood function:
lnL(β, δj) = n X t=1 3 X j=1
yt,j.lnFj(xt,j, zt, β, δj) (25)
The estimation is based on a nested model. This model requires specifying the nesting structure that separates the alternatives in groups, where the errors of the ARUM model are correlated within groups, but not between groups. The proposed model considers a tree where the first level is to be affiliated to a pen-sion system or not to be, while the second level (applied only for affiliates) is to be affiliate to the pay-as-you-go or to the funded systems.
The first advantage of the nested model is that assumes that there is an elas-ticity of substitution estimable between the pension alternatives, which differs from the elasticity between the choice of affiliating or not. This exceeds the multinomial and conditional logit models, which must assume that the distur-bances are independent and identically distributed. Chacaltana (2004) says that in the Peruvian pension context the multinomial model "do not consider the overwhelming evidence that in the last decade there has been a huge process of transfering people from one system to another. That is, there is substitution between alternatives in pension system". This author proposes as a future line of research using nested logit model with the same structure as used herein.
specific alternatives. This paper specifically seeks to build variables associated benefits and costs for each worker under the three possible alternatives: affili-ated to a pay-as-you-go system, affiliaffili-ated to a funded system and unaffiliaffili-ated.
5.2
Dependent and explanatory variables
A model for affiliation and a model for contribution are estimated, where the difference relies on the dependent variable. The affiliation model uses a cate-gorical dependent variable where each worker can be whether not subscribed to any pension system, subscribed to the pay-as-you-go system or subscribed to the funded system. The contribution model uses a categorical dependent vari-able where each worker can be whether not contributing to any pension system, contributing to the pay-as-you-go system or contributing to the funded system.
The explanatory variables were selected according to the model proposed in section 3. This allowed the identification of determinants of worker’s pension status, some related to pension systems (benefits and pension costs), other re-lated with the contracting firm (managerial ability, probability of informality detection and costs associated to productivity), and other associated to workers (productivity).
The explanatory variables of interest are those directly related to the pension systems: pension wealth, defined as the present value of expected retirement benefits, andpension costs, defined as the present value of the expected future contributions until retirement. These variables, whose construction is explained in detail in Appendix B, change with the individual and the alternative. There are three estimations for pension wealth: one assuming that he is not affiliated to any pension system (i.e., zero), other assuming that he is affiliated to the pay-as-you-go and the last one assuming his affiliation to the funded system. Similarly, each worker has an estimated pension cost in three possible scenarios.
A first set of control variables seeks to capture microeconomic determinants not incorporated in the simple theoretical model. It includes the logarithm of labor income, age, age squared, years of education, gender and a dummy variable if the worker lives in Lima. Previous literature has income as the main explanatory variable because it determines pension wealth. The theoretical model of section 3, however, explained that productivity of workers has three roles: 1) ensures a minimum income to overcome the costs of formal-ity; 2) increases the contributions to pension systems and 3) raises the level of pensions. Hence, this paper directly introduces pension wealth and pension cost, while income and age only control for additional effects. Dumies for occu-pational groups are also included.
employee of a large firm should be more likely to be affiliated to a pension system than an employee of a small firm. Sector of economic activity of the contracting firm is also included using dummies. Each economic sector has different level of technology and faces different detection probability, elements present in the theoretical model. For example, a mining company is capital intensive and has a higher probability of being detected if informal, than a ser-vices company. For the same reasons, a dummy for theworker’s employment status(salaried/independent) is included.
The last group of control variables are dummies for each year of analysis. It seeks to control a possible trend in the worker’s behavior that responds to macroeco-nomic factors, consists of dummies for each .
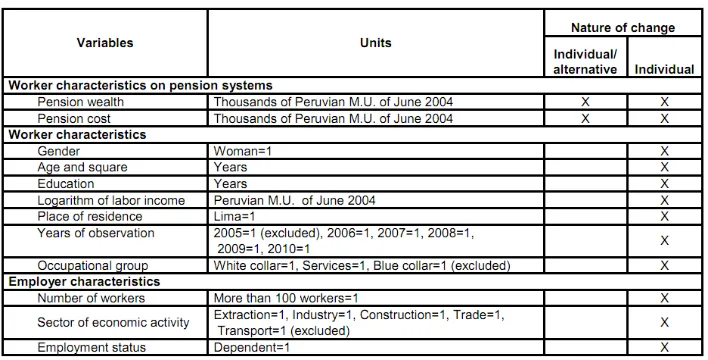
[image:20.612.134.488.343.523.2]Table 1 provides information on the units of measurement of the explanatory variables.
Table 1: Characteristics of the explanatory variables
6
Pension wealth and pension cost
estimated pension in both systems by income quintiles. Pension in the pay-as-you-go system is relatively stable to different levels of income, consistently with its redistributive nature. Pension in the funded system is a direct function of income, which is consistent with its capitalization nature. The right panel presents the average estimated pension in both systems by age. Pension in the pay-as-you-go system is again relatively stable to different levels of income, while pension in the funded system has a negative relation with the age because the investment horizon of young individuals allows a larger capitalization.
Figure 4: Estimated pension
Figure 4 gives preliminary information about worker’s preferences on pension systems by age and income. Note that, without control variables, pay-as-you-go pension wealth dominates funded pension wealth in the first income quintile; dominance is reversed from the third income quintile and increases in the next quintiles. Similarly, again without controlling, funded pension wealth dominates pay-as-you-go pension wealth until 55 years, but the situation is opposite for the workers older than 56 years. In short, older workers with low income would pre-fer the pay-as-you-go system and the younger workers with high income would prefer the funded system.
Figure 5: Average of the pension cost
7
Results
7.1
Affiliation model
7.1.1 Descriptive statistics
This section presents descriptive statistics of the three identified groups: af-filiated to the pay-as-you-go system, to the funded system and not affiliated. Weights available in the ENAHO have been used.
Figure 6: Occupied individuals by previsional status
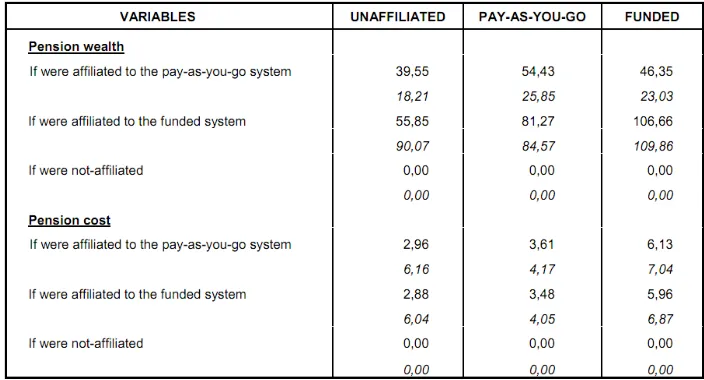
Table 2: Descriptive statistics for the pension wealth and pension cost variables
7.1.2 Econometric results
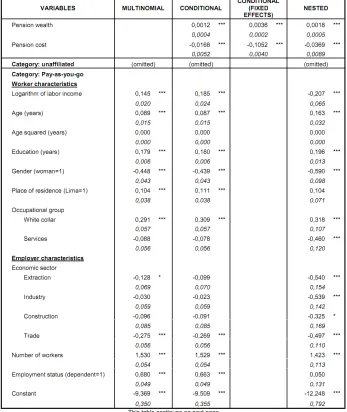
The first column of Table 4 presents a multinomial logit that can be compared with previous literature, which relied on income and age to recover the effect of pension wealth and pension cost on coverage. The second column presents a conditional logit, which includes pension wealth and pension cost, but assumes that the perturbationsǫt,1, ǫt,2, ǫt,3are independent. The third column presents
a slight variation of the previous model: a conditional logit model with fixed effects per worker. The fourth column presents the estimation of the proposed nested model, which is considered more appropriated because it includes pen-sion wealth and penpen-sion cost variables and it allows dependent disturbances. The interpretation of the results exclusively focuses on this nested model.
The coefficients related to the pension wealth and pension cost are highly sig-nificant and have the correct signs. The positive sign of pension wealth means that, if the variable is increased for any of the three options considered, then this option is more likely to be selected by workers. The negative sign of pen-sion cost means that, if the variable is increased for any of the three options considered, then this option is less selected by workers. It is noteworthy that the coefficients of pension wealth and pension cost have opposite signs despite of their positive correlation (0.69)12.
12
The individual characteristics have been included as controls. Affiliation strongly increases with the income, the age and the education of a worker. Notice that, given that pension wealth and pension cost are included, the co-efficients of these variables recover effects not related with pension systems. Additionally, women tend to contribute less than males. Finally, occupational group plays an important role. For instance, relatively to the probability of being unaffiliated to any pension system, a white-collar worker has a higher probability than a blue-collar worker of being both in pay-as-you-go and funded system.
Job characteristics are also important in determining affiliation probability. On first place, variables related to the economic sectors are important. Coefficients for each sector (with the exception of trade) are significant, showing that the characteristics of the contracting firm affect pension status, as the theoretical model concluded. On second place, the size of the firm has a significant and positive coefficient in the pay-as-you-go category and in the funded category. This confirms that firms with little managerial ability find more profitable op-erating informally. Finally, while the regulatory framework in Peru establishes that membership to the pension program is compulsory for wage workers and voluntary for self-employed workers, results confim that the variable for employ-ment status is statistically significant in the funded category. However, it is not significant in the pay-as-you-go category.
Finally, it should be noted that the nested model, besides its conceptual ad-vantages, has better statistical indicators. Based on the information criterion (AIC and BIC), which prefers lower values, the best model is the nested model. Using as the test of maximum likelihood ratio, also the nested model is the best.
7.1.3 Average marginal effects
The first simulation is a change of one unit in the pension wealth variable, that is, a change of 1000 monetary units of June 2004 in the present value of the lifetime pensions received from 65 years old on13. An increase of 1000
monetary units of pension wealth under the option of not being affiliated (the reader may think, for example, in a non-contributory pension for the elderly) would increase the average probability of not being affiliated to any pension system (0.00026) and would simultaneously decrease the average probability of being affiliated to the pay-as-you-go system (-0.00007) as to the funded system (-0.000018)14. An increase in pension wealth in the pay-as-you-go system (for
example, by a change in the legal formula) would decrease the probability of being affiliated to the funded system (0.00001). An increase in pension wealth in the funded system (for example, by a higher return on pension funds) would decrease the probability of not being affiliated to any pension system (-0.00018), would marginally increase the probability of being affiliated to the pay-as-you-go system (0.00001) and would increase the probability of being affiliated to the funded system (0.00018).
The second simulation is a change of one unit on the pension cost, that is, a change of 1000 monetary units of June 2004 in the present value of the con-tributions realized from the period of observation to the retirement year15. An
increase of 1000 monetary units of the pay-as-you-go pension cost (for example, by a decrease in the contribution rate) would increase the probability of not being covered by any system (0.00146), would decrease the probability of being affiliated to the funded system (-0.00135) and also would marginally decrease the probability of being affiliated to the funded system (-0.00012). An increase in the funded pension cost (for example, by increasing the commission of the pension funds administrators) would increase the probability of not being affil-iated to any pension system (0.00370), would decrease the probability of being affiliated to the funded system (-0.00012) and would decrease the probability of being affiliated to the funded system (-0.00358).
The analysis of marginal effects shows three additional results. First, measures implemented on the funded system more efficiently increase social protection against old age than measures applied on the pay-as-you-go. Notice that an increase on funded pension wealth is almost three times more effective rising af-filiation (0.00018) than a similar increase on the pay-as-you-go (0.00007); also, a decrease in funded pension cost is almost three times more effective rising membership (0.00358) to any pension system than a similar decrease on the pay-as-you-go (0.00135). Second, the average probability of affiliation is more sensitive to changes on pension cost than to changes in pension wealth in all cases (for example in the case of not affiliation, 0.00026 is less than 0.00516). This is
13
Consider for instance that, for a 40 years old worker, 1000 monetary units of pension wealth equal to a lifetime pension of S/.12
14Note that the sum of these changes on probabilities is one.
probably related to an intertemporal myopia that would make the perception of an increase in future pension more diffuse than a decline in contributions. Third, econometric evidence shows that the pay-as-you-go and the funded system do not compete with each other for members because, for instance, an increase in pension wealth on one system does not decrease membership to the other sys-tem, but slightly increases it. This is consistent with the utilization of a nested model.
7.2
Contribution model
7.2.1 Descriptive statistics
This section presents descriptive statistics for three different groups: contrib-utors to the pay-as-you-go system, contribcontrib-utors to the funded system and not contributors to any system. To the purposes of this paper, a worker is consid-ered contributor if he reports having paid his last contribution in the month prior to the implementation of the survey.
[image:32.612.134.485.472.643.2]Figure 7 shows how the participation of the three identified groups evolves during the period of analysis. The left panel shows that, although there was a positive evolution in both the pay-as-you-go and the funded system, the coverage problem is still serious. Only 25% of workers contributed in 2009, representing 59% of the affiliated workers. Moreover, the right panel shows that the partic-ipation of the contributors in the total of affiliates has decreased in the case of the funded system.
7.2.2 Econometric results
Table 6 shows the results of the contribution model. The columns show again the estimates according to the multinomial logit model, conditional logit model, conditional logit model with fixed effects and nested model. The interpretation is again made on the results of the nested model.
The coefficients of pension wealth and pension cost have different results. Pen-sion wealth has no significant coefficient, which means it does not affect the probability of contributing. Pension cost, as happened in the affiliation model, has a significant and negative coefficient. This means that, if this variable in-creases for any of the three alternatives considered, then workers contribute less in that alternative.
The coefficients of all variables associated to the contracting firm are highly significant in both categories. This emphasizes that, beyond the design of the pension systems, the labor market has an important role in contribution.
7.2.3 Average marginal effects
By contrast, the relevance of the variables associated to the contracting firm remains and in some cases increases. The importance of the labor situation (wage worker /self-employed), for example, is greater in the contribution model (-0.25011) than in the affiliation model (-0.15215). Hence, a marginal increase in the participation of the wage workers on the total would favor a greater contri-bution to the pension program. This is because the employer of a wage worker is legally forced to withhold pension contribution from his wage and pay it to the pension program, while this responsibility relies on the worker in the case of self-employed.
8
Conclusions
This paper, on the basis of an ARUM micro-founded model, empirically analy-ses the subscription and the contribution of the Peruvian workers to the pension program, taking advantage of the almost unique coexistence between a pay-as-you-go and a funded system. The estimated model is a nested whose first stage determines if a worker is affiliated to a pension system or not, and whose sec-ond stage involves choosing between the pay-as-you-go and the funded system. In order to have variables that change over alternatives, the paper constructs pension wealth and pension cost.
The nested model confirms that pension wealth has a significant positive impact on affiliation, while pension cost has a significant negative impact. The marginal effects reveal that a marginal change on benefits has less impact on affiliation than a marginal change on costs, which is consistent with an intertemporal my-opia; also, marginal effects reveal that a marginal change on the funded system has a higher impact than a marginal change on the pay-as-you-go system, which reveals different behaviors in each system.
This paper carries important implications for pension policies as it provides a tool to estimate the impact of a number of policy measures on coverage. To illuestrate how, appendix C discusses the non contributory pension scheme re-cently launched by the Peruvian President Ollanta Humala16. The program
"Pension 65", as branded by Humala, will provide 125 Peruvian monetary units (about US$46) to older people over 65 years who live in poverty. A simple ap-plication of the estimated marginal effects allows predicting that "Pension 65" would cause approximately 400 urban workers to become informal, from which 30% would come from the pay-as-you-go and 70% from the funded system.
In general terms, the marginal effects are useful to predict the impact of several policies including subsidies on pension contributions of young workers, deduc-tion of pension contribudeduc-tions from income tax, non contributory pension schemes and subsidies on hiring. Marginal effects are a tool to estimate the number of workers that migrate from informality to the pay-as-you-go or to the funded system, or that leave the pension systems to become informal. It is also useful to estimate the number of workers that would start or stop contributing to the pension system. An early Spanish version of this paper (Carpio 2009) presents preliminary estimates of the impact of other policy measures using a similar strategy. A line of future research is adapting this general framework to specific proposals in order to obtain more accurate estimations.
Appendices
A Legal framework for calculation of pensions
This appendix explains how pensions are computed within the pay-as-you-go and the funded system.
A.1 Pay-as-you-go pension
The pay-as-you-go system requires, in general terms, a minimum of 20 years of contributions to be eligible for benefits. Pensions are set using the legal formula that corresponds. Previously to 2002, the pension was calculated as the 50% of a "reference wage" plus an extra of 4% for each additional year of contribution to the minimum required (20 years). This reference wage was established as the income average of the last five years for those individuals with 20 to 24 years of contribution, the income average of the last four years for those individuals with 25 to 29 years of contribution, and the income average of the last three years for those individuals with more than 30 years of contribution. The following equation shows the formula explained above:
Ppayg= 0.5∗rw+ 0.04∗rw∗(q−20) if q≥20
= 0 if q <20
whererwis the reference wage andqis the number of years of contribution.
Legal norms issued in 200217established a new condition for individuals younger
than 55 years old at the date of publication. On one hand, reference wage be-came equal to the average income of the last five years, independently of the number of years of contribution. On the other hand, formulas were introduced differentiated according to age at the time of publication.
Ppayg= 0.30∗rw′+ 0.02∗rw′∗(q−20) if q≥20 and age2002<30
= 0.35∗rw′
+ 0.02∗rw′
∗(q−20) if q≥20 and age2002∈[30,40)
= 0.40∗rw′+ 0
.02∗rw′
∗(q−20) if q≥20 and age2002∈[40,50)
= 0.45∗rw′
+ 0.02∗rw′
∗(q−20) if q≥20 and age2002∈[50,55)
= 0 if q <20
17
whererw′
is the reference wage for individuals younger than The computation of pensions in the pay-as-you-go system includes minimum and maximum lim-its, which generate redistribution within this regimen. The legal framework in force18 establishes that the maximum pension is equal to 857 Peruvian
mon-etary units (about US$ 246,41), while the minimum pension is equal to 415 Peruvian monetary units (about US$119,32), which applies only if the time of contribution is more than twenty years19.
A.2 Funded pension
Pensions in the funded system are calculated as a direct function of the accumu-lated resources in the Individual Capitalization Account (ICA) during working life. As opposed to the pay-as-you-go, the funded system does not require a minimum number of contributions. The following formula calculates the ex-pected value of the ICA at the age of retirement, which is 65 years regardless of the gender:
ICA=
T X
t=t0
at∗et
vt !
∗vT (3)
Whereatis the rate of contribution,etis the annual wage andvtis the pension
fund price per share. Additionally, t0 is the period of affiliation to the funded
system andT is the period of retirement. Thus, the final level of the ICA is the total number of periodically purchased fund shares, multiplied by the pension fund price per share at the period of retirement.
The funded system temporarily includes a recognition bond, a governmental transfer given in recognition for the contributions made to the pay-as-you-go system. Individuals switching from the pay-as-you-go to the funded system are entitled to these recognition bonds if they have made a minimum number of past contributions. The face value of the bonds is given by the following formula:
B= 0.1831∗rw′′
∗m (4)
where rw′′
is the reference wage for the calculation of the recognition bond, calculated as the average of the wages of the last year, andmis the number of months of contributions in the pay-as-you-go system. The value of a recogni-tion bond has an upper limit equal to 60.000 Peruvian monetary units (about US$17.251,30) of December of 1992, which is updated periodically with a con-sumer price index.
18Decree of Urgency N◦105-2001 and Supreme Decree N◦028-2002-EF.
Finally, the pension is computed as a direct function of the sum of the ICA and the recognition bond:
Pf unded=
ICA+B
U RC (5)
where URC is the unit required capital, i.e., the amount of money necessary to deliver one monetary unit as a life-time pension. The table of this URC, which depends on age and gender of the individual, is established in the regulatory framework and meets actuarial computations.
B. Estimation of pension variables
This appendix explains the construction of the explanatory variables used in the analysis.
B.1 Income profile and occupation probability estimation
The calculation of pension wealth and cost for each worker requires not only the current wage, but the entire income profile, which is not available in the surveys. While one alternative is assuming that the reported wage does not change over time, this paper simulates earning histories by taking the reported wage of each worker as one point of his income profile and then applying a set of growth rates to this wage backwards and forwards20
The growth rates’ sets are computed from estimated group-income profiles, whose computation requires a number of steps. First, the available data is used to estimate a Mincer’s earnings equation of human capital (1958, 1974) with selection bias correction by employment status21. Specifically, the logarithm
of income from the main occupation is regressed on years of education, years of occupational experience (equal to current age minus age at the final year of education) and a number of controls. Second, groups are defined as all possible combinations of the explanatory variables different from years of occupational experience (i.e. years of education and other controls). Third, for each defined group, the estimated equation is use to obtain the predicted logarithm of income that correspond to simulated years of occupational experience. Finally, every group-income profile allows computing one set of growth rates. Hence, every worker will receive the growth rate set that corresponds to the group he belongs
20
Mincer and Ofek (1982), Blundell, Meghir and Smith (2002), Banks, Emmerson and Tetlow (2005), Quintanilla (2008) and Carpio (2008) present alternative methodologies for the estimation of earning profiles and pension wealth.
to.
The Mincer’s equation used to estimate group-income profiles includes the occu-pational experience variable alone, to the square and interacted with dummies for education level. The square is included to recover a plausible non linear effect. The interactions are included because a year of occupational experience has different effects on income regarding the educational level of the worker. This procedure is consistent with Murphy and Welch (1992), who reported dif-ferences in income profiles for different educational levels in the United States.
The results of the Mincer’s regression are presented by Table 822. The first
column presents the outcome equation. Notice that the returns to occupational experience do depend on the educational attainment as five from the eight con-sidered interactions are statistically significant. The control variables are also highly significant. The second column shows the selection equation. Note that almost all the explanatory variables are significant, including marital status and its interaction with gender. The opposite signs of these two variables reveal that being married increases the probability of working for males, but decreases it for females.
The previous regression is the main input to construct the group-income pro-files. First, groups are defined as every possible combination of the control variables (for instance, a group is composed by single males from Lima with primary education, whose survey was applied in 2005). Second, for each group, the predicted logarithm of income is estimated by considering different levels of occupational experience23. Third, the predicted income is obtained by taking
antilogarithm to the previous estimations. Once the group-income profiles are available, the growth rates’ sets are computed for each group.
[image:43.612.140.470.336.551.2]The income profiles are then computed by taking the reported wage of each worker as a point of the income profile and using the growth rates’ sets corre-sponding to his group. Each profile is delimited from the first year in the labor market (six plus years of schooling) to the retirement age. Figure 8 illustrates the construction of the income profiles for four specific individuals that belong to three different groups. The methodology allows not resigning to the variabil-ity provided by the income variable.
Figure 8: Reported wages and constructed income profiles
The calculation of pension wealth also requires profiles of the probability of working. The selection equation of the Mincer’s model allows obtaining group-probability of working profiles. First, groups are defined as all possible com-binations of the explanatory variables different from occupational experience. Second, for each group, the predicted probability is obtained by simulating
different years of occupational experience. Finally, every worker receives the probability of working profile that corresponds to his group.
In short, each individual of the four surveys receives an income profile, denoted
{ei} and a profile of the probability of being occupied, denoted{pi}.
B.2 Pay-as-you-go pension
Section 2 explained that a worker must contribute for a minimum number of years to be eligible for pay-as-you-go pension and that this pension is calculated by applying a legal formula. This section explains how this regulatory frame-work was applied to the individuals of the survey.
In order to evaluate whether a worker will complete the minimum number of contribution years, the number of years from the beginning of his working life (equal to six plus his years of education) to the legal retirement age (equal to 65) is computed. Since the worker may experience unemployment for some years, the previous number of years is multiplied by the average probability of working, obtained from series{pi}. This product, the expected number of years
of employment, is used to check whether the worker fulfill the required years of contribution.
Pay-as-you-go pension for eligible workers is calculated by applying the legal formula in force during the year of observation. The legal formula requires a reference wage, which is calculated taking the last wages from the income pro-files{ei}. Once the pension is calculated, it is restricted to the minimum and
maximum in force.
B.3 Funded pension
Section 2 also explained that the funded pension is computed as a direct func-tion of the contributed resources plus the return obtained by pension funds administrators. Moreover, a Recognition Bond is added if a worker started to work before the pension reform of 1993 and if he fulfills a minimum number of contribution years. This section explains how funded pensions are estimated for the individuals of the survey.
The ICA is calculated by applying equation 3 to the income profile {ei} in
the equation 3, which requires assuming a rate of contribution and a rate of growth in share value. The contribution rate, consistently with the regulatory framework, is assumed 10% for contributions from 1993 to 1996, 8% for contri-butions from 1997 to 2005 and 10% for contricontri-butions from 2006 onwards. The rate of growth in share vale is assumed to be risk-less and equal to 6
Recognition Bond is estimated in two stages. First, to evaluate whether a worker fulfills the minimum number of contribution years, the number of years between the beginning of working life and 1992 (last year of recognition accord-ing to the law) is multiplied by the average probability of workaccord-ing in the same period (computed from{pi}). Second, the bond is computed for eligible
work-ers by using equation 4, which requires estimating reference wage from income profiles ei and accounting for the upper limit of S/.60000 monetary units of
December 1992.
The monthly pension of the individual is directly estimated using equation 5, that is, as the sum of the resources of the ICA and the Recognition Bond, di-vided by the corresponding URC. According to the legal table, the URC is 168 for 65 years-old men and 168 for 65 years-old women.
B.4 Pension wealth and pension cost
Pension wealth, both in the pay-as-you-go and the funded system, is estimated as the present value of pensions that each individual would receive from retire-ment until decease. Operatively, pension wealth in the funded systems is simply the sum of the ICA resources and the Recognition Bond, discounted from the retirement year to the year of observation. Similarly, pension wealth in the pay-as-you-go is the product of the calculated pension and the URC, discounted from the retirement year to the year of observation. Finally, pension wealth is equal to zero in the scenario of not being affiliated to any pension system.
Pension cost in the pay-as-you-go system is calculated as the present value of contributions from the year of observation to the retirement year. Hence, a contribution rate of 13% is applied to the income profileei. Pension cost in the
funded system is calculated similarly, but using the contribution rate of 10% plus the average commission and premium applied by the AFP in the period of observation. The total rate increases is 11.15% , 12.78% , 12.69% , 12.67% and 12.82% in the years 2005, 2006, 2007, 2008 and 2009, respectively.
C. "Pension 65"
The Peruvian President Ollanta Humala recently launched the non contribu-tory pension scheme "Pension 65"24. This program will provide 125 Peruvian
24
monetary units (about US$46) to older people over 65 years who live in poverty.
[image:46.612.134.492.247.321.2]This program may affect the incentives to affiliate to pension systems of workers under 65 years old who live in poverty, as they can expect to receive a pension in the future without contributing. This appendix estimates how many urban workers living in poverty may have incentives to leave formality.