Munich Personal RePEc Archive
Real Exchange Rate and the Structure of
Exports
Cimoli, Mario and Fleitas, Sebastian and Porcile, Gabriel
1 March 2011
Online at
https://mpra.ub.uni-muenchen.de/37846/
Real Exchange Rate and the Structure of Exports
Mario Cimoli (ECLAC and University of Venice) Sebastián Fleitas (IECON-UDELAR) Gabriel Porcile (ECLAC and UFPR)1
Abstract
This paper discusses the effects of the real exchange rate (RER) on the structure of exports. Based on a North-South Ricardian model, two hypotheses are suggested and tested. The first one is that a higher RER allows for a higher diversification of exports. The second hypothesis is that this diversification raises the technological intensity of exports. We find favorable evidence for the two hypotheses from a panel data study including 111 counties in the period 1965-2005. From these results it is argued that a competitive RER should be considered a relevant variable in the process of economic development as it encourages the transformation of the pattern of specialization.
Introduction
The idea that the economic structure plays a crucial role in development is certainly not new, at least not in the heterodox tradition in economics. Schumpeter (1911) placed qualitative change at the centre of his theory of economic development. The works of Nelson and Winter (1982) and Freeman (1995), among other evolutionary economists, significantly advanced the Schumpeterian view of technical change and “creative destruction” as the main drivers of growth. On the other hand, in the neoclassical tradition structural change was for a long time confined to a marginal position, almost a footnote in aggregate growth models. But in the early 1990s the topic was rediscovered and has received increasing attention2.
In open economies structural change is closely related to the pattern of specialization. The economic structure is shaped by what the economy can competitively produce for both domestic and external markets. This has been a long-standing point in ECLAC’s structuralist school, which regards different patterns of specialization in centre and periphery as crucial for explaining why the periphery fails to develop3. It has been present as well in models based on structuralist ideas4 and in new versions of mainstream models in which growth depends on the
1 The ideas and opinions expressed in this paper are the sole responsibility of the authors, and do not necessarily
represent those of their respective institutions.
2 See for instance Acemoglu (2009), pp. 783-805.
3 The seminal contribution is Prebisch (1949).
4
diversification and composition of exports5. Moreover, the historical evidence points out that all successful processes of catching up in the international economy relied on building technological capabilities and the diversification of the export structure6.
In conventional trade theory the pattern of specialization depends on endowments, which define the relative cost of producing goods with different factor intensity. But this theory is at the very least insufficient, as has been repeatedly argued in the literature. Technology leads and lags play the dominant role in trade of goods with medium and high technological intensity7. Moreover, the very concept of endowments changes when technological change allows countries to discover and/or exploit natural resources not used before. In the same vein, natural resources that are highly valuable within a certain technological regime may be made redundant by technical change. Even an infinite supply of labor means very little if there is no technology-driven process of structural change creating new jobs in emerging industries.
While technology and endowments contribute to define competitive advantages in international trade, policy variables play a role too. The real exchange rate (RER) is a significant policy variable affecting trade that may give rise to hysteresis effects8. Since the RER allows countries to compensate for asymmetries in technological capabilities or endowments, its appreciation or depreciation redefines the pattern of specialization9. In aggregate models, a change in RER leads to the reallocation of resources across sectors. Such a reallocation, however, means more than just producing different quantities of the same goods produced before. It frequently implies beginning new activities and/or closing those that cease to be competitive. Behind reallocation there is a story of structural change that may either strengthen or dampen sectors intensive in technology and knowledge. As a result, managing the RER may have significant implications for the subsequent trajectory of technological learning.
In effect, if periods of appreciation of the RER reduce the share of technology-intensive sectors in exports, path-dependence phenomena will compromise the recovery of these sectors in the future. Patterns of specialization presents a high degree of path-dependence, defined as a “dynamic process whose evolution is governed by its own history”10. Path-dependence is more likely to occur in medium and high-tech activities because the intensity of learning by doing
5 Hausmann et al (2007) and Agosin (2009).
6 Katz, (1987), Reinert (1995), Chang (2001) and Bell (2006).
7 Dosi et al (1990).
8
Baldwin (1988), Baldwin and Krugman (1989) and Cimoli (1992). For a discussion of the RER as an instrument in development policy see Rapetti (2011).
9 This point is presented more formally in section 1. Naturally, the whole arsenal of trade policies (tariffs, non-tariff
protection, preferential trade agreements, export subsidies, export and import financing) may also change the export structure. Still, the focus of this paper lies on the RER because its appreciation has been a recurrent problem in some regions as Latinamerican countries since the late seventies, and is related to the major external crises that occurred in Latin America in the past forty years (Bresser, 2008; Nassif et al, 2010; Frenkel and Rapetti, 2011; Ocampo, 2011).
(cumulative) mechanisms is higher, externalities and complementarities across sectors stronger and technology changes faster11. This tends to reinforce the prevailing technological and growth trajectories and change the long run equilibrium in the process. Short term shocks that change the pattern of specialization may then have persistent effects on growth.
The paper is organized in four sections besides the introduction and the concluding remarks. Section I presents the Ricardian trade model with a continuum of goods, in which the role played by the RER in changing the pattern of specialization is discussed. The main result of the model is to show that a higher RER favors the diversification of the export structure towards sectors with higher technological intensity. Section 2 tests the relationship between export diversification and RER, while section 3 tests how the RER affects the technological intensity of exports. Finally, brief concluding remarks are presented.
1. RER and the pattern of specialization
1.1. The pattern of specialization
The Ricardian model with a continuum of goods offers a simple framework in which the effects of the RER, technology and specialization can be put together12. The focus is on North-South trade based on the following assumptions:
a) The international economy produces a large number of goods using two factors of production, labor and technology;
b) Goods differ in terms of technological intensity and can be continuously ranked from the good with the lowest technological intensity (z = 0) to the good with the highest technological intensity (z = 1).
c) There is a technology gap (G) between the advanced North and the laggard South, defined as the ratio between the aggregate stock of technology in the North and the same
stock in the South ( );
d) For a given technology gap, the difference between labor productivity in the North and labor productivity in the South is higher for goods that are more technology intensive. In other words, the comparative advantage of the country on the technological frontier is in goods which are more technology intensive.
Point (b) implies that ranking the goods in terms of increasing North-South productivity gap (
S N
z π π
π = , where S is South, N is North, z denotes the good, πis productivity and
π
zis the productivity gap) is the same as ranking them in terms of increasing technology intensity. This gives rise to an upward sloping curve of Northern comparative advantage in which the
11 If there is cumulativeness in learning, a rapidly moving international technological frontier implies that even a
short period of contraction of investments in physical capital, human capital and R&D may lead to a large gap in technological capabilities, which would be difficult to overcome thereafter. Baldwin (1988) stresses sunk costs in entering new markets as a source of hysteresis in international trade (more on this later).
12
See Dornbush et al (1977).
S
N T
productivity gap is a function of z, (
π
z =π
( )
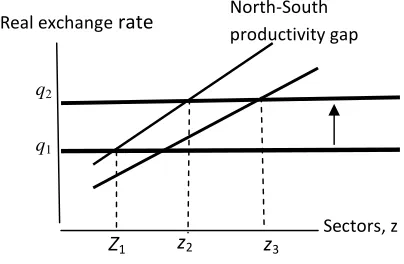
z ), where z is an index of technological intensity (see figure 1; see also Krugman, 1979).A good z is produced in the South if:
1)
In equation (1) W are nominal wages and e is the nominal exchange rate (units of foreign currency per unit of domestic currency) The left-hand-side of inequality 1) is the inverse of the
wage-based real exchange rate defined as 13. It is clear from (1) that z will be produced in the South if:
2) q≥
π
zThe pattern of specialization defined by equation (2) is depicted in Figure 1, which shows that the South will produce the goods between 0 and z1.
[Figure 1 about here]
If there is a change in the RER (after a change in macro policies, for instance), and the RER increases from q1 to q2, the Southern economy diversifies from z1 to z2.
The Ricardian model provides a simple form of directly linking RER and technology to the production structure and renders simple empirical predictions. First, a higher RER favors the diversification of exports (increase in z). If there is a change in the RER, and the RER increases from q1 to q2, the Southern economy diversifies from z1 to z2. Secondly, a rise in RER is not
neutral across sectors. The move from z1 to z2 implies moving towards activities that are more
technology-intensive than before (an increase in z implies an increase in the technological intensity of the goods produced in the South).
1.2. Specialization, learning and growth
The adjustment process does not end in point z2. New exports will shift the position of the
productivity gap curve to the right, out of cumulativeness in learning and productivity growth
13 There are alternative definitions of the RER, being the most frequent . If prices are indexed to
nominal wages and hence the ratio moves hand by hand with P*e/P, then the wage-based real exchange
rate q will move pari passu with the RER, or at least both rates will not move too markedly apart.
N z S z N S e W W π π < S N W e W q= P e P RER= *
S Ne W
(the mechanisms of the Kaldor-Verdoorn Law). The learning process that accompanies structural change prompts further diversification in the South until the good denoted by z3. The economy
emerges from the adjustment process with new technological capabilities and skills. The intensity of this shift (and hence the new equilibrium z3) depends in turn on to forces. One of
them is path dependence, the fact that learning occurs around the initial technological basis, and this force will tend to keep the economy moving along the previous learning trajectory. The second force are industrial and technological policies (ITP) that shape the intensity of the Kaldor-Verdoorn effects and the institutions that provide incentives to innovation and coordinate decisions, particularly when these decisions imply moving away from the dominant pattern of industrialization14.
It is important to recall the importance of changes in the pattern of specialization for economic growth and development. From a pure supply-side perspective, adopted in most neoclassical models, potential growth is driven by the accumulation of human and physical capital and the rate of technical change. Effective demand adjusts in the long run to conform to the growth of potential output (Setterfield, 2009a). How does specialization affect potential growth? Sectors are different: some of them boost externalities, complementarities, innovation and technological innovation and diffusion, while others do not. Countries in which high tech sectors have a higher share in exports and production will therefore show higher rates of technical change and productivity growth.
The existence of technological asymmetries between sectors is as well a key concern of heterodox theory. Innovation and diffusion occur unevenly across sectors: this is why heterogeneity is the inevitable result of Schumpeterian competition15. The centre–periphery system emerges precisely because the most dynamic activities of the continuum of (heterogeneous) activities concentrate in a few areas, while lower-end activities prevail in the rest of the world. In addition, the heterodox tradition brings into the analysis the demand side of the equation, particularly the effects of the pattern of specialization in the income elasticity of the demand for exports and imports (Thirlwall, 2011). The empirical evidence suggests that demand for high-tech goods tends to grow faster in the international economy16. There is a clear association between technological capabilities and the ability to compete in sectors whose demand grows faster17.
1.3. A brief overview of the literature
The effect of the RER on exports is not free of controversy in the empirical literature. Differences in methodology, models, the measurement of the RER, the concepts of over and
14 See Metcalf (2001), Nelson (1993) and Narula (2002)
15 Saviotti and Pyka (2004) and Dosi et al (2010).
16 ECLAC (2007, 2010) and UNCTAD (2010).
17
undervaluation, the countries included in the sample and the periods considered, among other factors, make it difficult to compare different results. However, it general terms, the empirical literature supports the idea that a stable and slightly depreciated RER favors export diversification and the upgrading of the export structure, while appreciation and a high RER volatility give rise to the opposite outcomes.
Thus, for instance, Freund and Pierola (2008a and 2008b) highlight the key role of a depreciated (and stable) RER in opening new lines of (and new destinations for) exports from developing economies. These authors found that devaluations were important for explaining export surges, which in turn contributed to accelerate growth. Their view is compatible with the finding of Berg et al (2006), who emphasize that openness is associated with higher growth only if at the same time the RER is competitive18. Chit et al (2008) underline the negative role of RER volatility on export diversification in Asian emerging economies.
Moreover, the findings of Freund and Pierola do not support the “export pessimism” view regarding the price-elasticity of exports from developing economies (see also Sekkat and Varoudaki, 2000). Eichengreen (2008) concludes that the RER can “help to jump-start growth by
encouraging the redeployment of resources into manufacturing and reaping immediate productivity gains”. Similar results are set forth by Rodrik (2008), Berg and Miao (2010) and McMillan and Rodrik (2011) and Rapetti et al (2009). Saviotti and Frenken (2008) show that export diversification towards related goods enhances growth in the short run, while export diversification towards unrelated goods does so in the long run. However, not all the literature shares this perspective. Fang et al (2006) report very low price-elasticities for exports from Asian developing economies, while Agosin et al (2011) report no significant effect of the RER in export diversification in a broad panel of countries for the period 1962-2000.
Bilateral trade models based on the gravity equation point out that the effects of the RER are asymmetric across sectors and conditioned by institutional and geographical variables that shape competitiveness and the costs of trade. Colacelli (2008), for instance, shows the RER has a stronger effect on exports of differentiated goods than on exports of homogeneous goods, while Berthou (2008), working with trade between the OECD and different regions in 1989-2004, observes that the price elasticity of OECD exports to countries with weak institutions (developing economies) tend to be lower. This author also offers evidence of the presence of hysteresis phenomena due to sunk entry costs into the export market à la Baldwin-Krugman, a finding confirmed by Freund and Pierola (2008b).
In the next sections we test the two hypotheses derived from the Ricardian framework presented in this section. The hypothesis that the RER affects the level of export diversification is tested in section (2); the relationship between RER and the technological intensity of exports is tested in section (3); and finally section (4) tests the relationship between specialization and growth.
2. RER and export diversification
18
The model presented in section 1 highlights two explanatory variables of the pattern of specialization, RER and technology, which contribute to define relative unitary costs. In addition the model emphasizes the role of path dependency in technological learning and specialization. To discuss the effects of these variables on export diversification we run a panel data regression for a large sample of countries (111) in the period 1965-2005. Three alternative indicators of export concentration are used as the endogenous variable: the Gini Index (IG), the Herfindahl Index (IH) and the Theil Index (IT). The RER is obtained from the Penn Tables. As a proxy of technological capabilities, we use the country’s GDP per capita19. In order to take into account the dynamic forces of path dependence, and at the same time control for the possible endogeneity of the explanatory variables (for instance, there may exist an association between levels of productivity and the RER), we used the standard Arellano Bond (1991) procedure for dynamic panel data estimation as shown in equation (1). The importance of the lagged value of the dependent variable in the theoretical model gives rise to autocorrelation in the estimation for which Arellano-Bond (1991) accounts for. Additionally, it is possible to think that some variables of the model can cause one to each other. The use of instruments in this technique allows to avoid the endogeneity bias that the possible bi-directional causality in the variables. Given the expected existence of heteroscedasticity in the data the robust standard errors will be reported. In order to get good estimations the tests of validity of instruments in presence of heteroskedasticity (Hansen, 1982) of the instruments and the test of autocorrelation Arrellano-Bond (1991) were instrumented.20.
(1)
where , represents the variable of interest (Gini Index (IG), the Herfindahl Index (IH) or the
Theil Index (IT)), , the lagged value of this variable, X represents the matrix with RER and
GDP per capita), Z represents a set of control variables (detailed below), an unobserved country specific effect and , the random term.
According with the model, we expect that higher RER and GDP per capita, and a lower level of concentration in the previous period, should reduce concentration in the export structure. To assess the robustness of that relationships, a set of control variables are included in different specifications of the model. Differences in factor endowments are captured by proxies of human capital, physical capital and the stock of natural resources (land, minerals and energy sources). Human capital may be seen (from a Schumpeterian perspective) as another proxy for technological capabilities and learning potential. In addition, openness and the volatility of the RER are taken into account. The degree of openness is relevant because high barriers to trade would affect the pattern of exports. This variable also helps to control for the size of the country, recalling that large countries tend to have lower openness coefficients. As regards the volatility
19
The GDP per cápita of the countries in relation with the GDP of the United States were used later as a proxy of technological gaps, but as we will see the results of the paper remains equal.
20 More details about sources and definitions of the variables of the model can be found in the statistical appendix at
of the RER, there are several mechanisms by which this variable may affect diversification. Volatility heightens uncertainty about future profits and market shares in tradable goods, and thereby makes less attractive investing in tradables beyond the traditional export activities.
A caveat is necessary. Many studies on RER and exports uses a misalignment measure respecting an equilibrium RER and estimate such misalignment through the Balssa-Samuelson correction. The latter, in turn, is based on a fixed effect regression of the RER on productivity per capita for the sample of countries included in the study. The difference between the actual RER and the RER estimated through this regression gives the degree of misalignment. Still, in the model presented above the level of the RER plays a role on its own on exports, along with a technological variable which is captured by GDP per capita. For this reason, we have chosen to include RER and productivity as separate independent variables on the right hand side of the model. This allows us to interpret the results in a form compatible with the theoretical model. It is likely that what other studies identify as misalignment, from the perspective of the Ricardian model, combine effects stemming from both the management of the RER and the dynamics of technology.
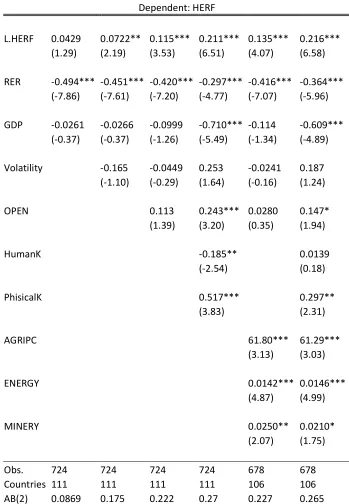
The results of the regressions analysis are shown in Table 1, 2 and 3.
Some of the conclusions that can be drawn from the result of the estimations presented in Table 1, 2 and 3 are the following (Table 2 and 3 are shown in the appendix:
[ Table 1 about here ]
a) Export diversification responds positively to a higher RER21. This is a robust result, verified with all the different specifications of the model and for the three different indicators of the degree of concentration (IG, IH and IT).
b) The variable GDP per capita reduces the degree of concentration. This result is less robust than that of the RER, as the coefficient is insignificant in some of the specifications of the model22.
21 Our results are compatible with the literature that relates RER, exports and growth in developing economies.
However, they do not validate the findings of Agosin et al (2011). The divergence between results may be due to the use of different methodologies of estimation (dynamic GMM instead of GMM) and different control variables. For instance, these authors included in the model the terms of trade but not physical capital. We decided not to include the terms of trade as an explanatory variable since the degree of overlapping of this variable with the RER is too high in our sample. Indeed, it should be expected that under a regime of fluctuating exchange rates, positive (negative) shocks will be associated with the appreciation (depreciation) of the RER (see Broda, 2002). Such a response, however, varies with the international conditions of capital markets and the behavior of macro-policies and inflation.
22 In another exercise, not reported in the paper, we used as an indicator of technological capabilities the ratio
c) The coefficient of the lagged endogenous variable is positive and significant (lower than the unity, as required for stability in the system). The higher the export concentration in a certain period, the higher this concentration will be in the next period. Path-dependence is at work in the evolution of the pattern of specialization, as argued before.
As regards the control variables, some of them work according with what is predicted in trade models. The availability of human capital and physical capital favors diversification. From a Schumpeterian perspective, this is related to the accumulation of technological capabilities that fosters both the moving towards new sectors and the ensuing upgrading of the production structure. In particular, the indicator of human capital is suggestive of the existence of institutions and policies that support learning and innovation. From a more conventional perspective, this may be seen as the result of the accumulation of factors of production which in turn redefines comparative advantages though time. Independently of how one interprets the control variables, the results confirm the importance of the RER and technology as explanatory variables.
The volatility of the RER is not significant in most of the specifications of the model. Openness, on the other hand, is positively associated with export concentration. This fact points out to the effect of the specialization once the economies are open to world economy. In general, the higher the abundance of natural resources, the higher export concentration. However, in the case of the abundance of land, in the more general specification (when human capital and physical capital are included), the coefficient is no longer significant. We will come back to this point later, when we discuss the effects of natural resources on the technological content of exports.
In sum, a higher RER is consistently related to a more diversified export structure (measured by three indicators of export concentration, namely Gini, Herfindahl and Thail indexes), even after controlling for the variables stressed by conventional trade theory (endowments of natural resources, physical and human capital). Technology levels play a positive role in diversification, although its effects are less robust. Path dependence is significant and robust and reveals the importance of inertia in production and specialization. The accumulation of physical and human capital enhances export diversification, while the endowment of natural resources tends to lower such diversification.
3. RER and the Technological Intensity of Exports
A higher RER not only increases export diversification but that it does so by encompassing new exports which are more technology-intensive than previous exports. The reason is that a rise in the RER makes competitive the production of goods whose productivity gap is higher. Under the assumptions of the simple model of section 1, goods with a higher productivity gap are at the same time more technology-intensive.
percentage) of medium and high technological exports (MHTE). These sectors are defined according with Lall’s classification (cf. Lall, 2000). As in the previous exercise, we made estimations using the Arellano-Bond technique, including the lagged dependent variable among the explanatory variables in order to capture path-dependence. We expect positive signs for the lagged endogenous variable, the RER and GDP per capita.
The control variables are the same as in the previous exercise. There are no straightforward predictions regarding the sign effect of the availability of natural resources on the technological intensity of exports. The key question in this case is how the rents from natural resources are used. If rents are used to foster the consumption of imported goods or diverted from investment in any way, then the availability of natural resources will favor exports with lower technological content. Inversely, if natural resources are used as a competitive basis for further leaning, upgrading and diversification, then the effect of MHTE will be positive.
The same ambiguity exists for the variable openness. More openness implies stronger competitive pressure that would strengthen the efforts of local firms for catching up with the leaders. On the other hand, such a pressure may eliminate local producers before they have time to learn. The timing of both processes – catching up versus competitive advantages of the leaders –, and the existence of policies to speed up technological diffusion, will define the emerging pattern of specialization and market shares in the international economy23.
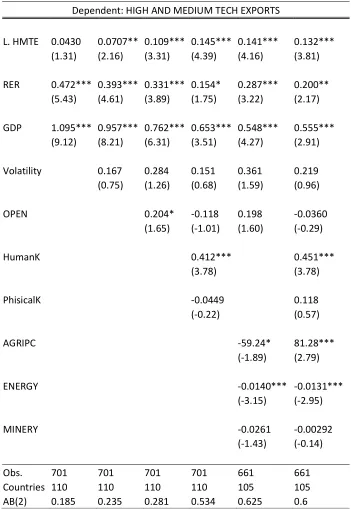
[ Table 4 about here ]
The results of the econometric test are presented in Table 4. They can be summarized as follows.
a) The RER has a significant influence on the technological intensity of exports and the effect is robust to various specifications of the model.
b) The coefficient of the GDP per capita is positive and consistently associated with a higher technological content of exports. The result conforms to what we expected, considering this variable as a proxy for the technological level of the economy.
c) The laggard endogenous variable is significant, which supports the idea that specialization in MHTE is subject to path-dependence. The reasons are the same as in the case of export diversification, namely sunk costs and increasing returns. Sunk costs are higher in goods with higher technological content, as more specialized assets (human and physical capital) and production bases are required to compete in MHTE. At the same time, cumulativeness in productivity and innovation also tends to be higher in high tech sectors, where both technological opportunities are and the possibility of furthering the division of labor are higher.
Although the control variables are not the main focus of the analysis, some of the results are worth commenting. Natural resources are negatively associated with HMTE except when we include human and physical capital in the model. In the latter specification, arable land per capita
23 In other words, production and market shares will be more concentrated in Northern firms if the velocity with
changes signs and minerals per capita looses significance. Only the indicator for energy resources (oil, natural gas, and coal) is consistently related to lower HMTE, probably reflecting the influence of large oil exporters with very little diversification in Asia and Latin America. This suggests that the effect of natural resources on the technological content of exports may be associated with the accumulation of human capital and the ITPs for technological innovation and diffusion. When this variable is controlled, then the initial competitive advantage based on natural resources does not compromise HMTE, at least in the case of the land and minerals endowments.
In sum, the RER is associated with a higher technological intensity of the exported goods. The variable GDP per capita (a proxy for technological capabilities) has a similar effect, as well as human capital. Both results are in conformity with the hypotheses set forth in section (1). In addition, “endowments are not fate”24: having natural resources does not necessarily lead to a lower technological intensity of exports if we control for human capital (understood as a proxy for a broad set of institutions that foster learning).
Concluding remarks
The paper discussed the role of the RER on the transformation of the pattern of specialization – a key issue in economic development and long run growth. Several developing economies have gone through periods of currency appreciation with subsequent external crises, particularly in Latin America, either as a result of cyclical improvements in the terms of trade or (more frequently) cycles of high liquidity in the international financial markets. Appreciation discouraged the production of tradable goods, particularly those of medium and high technological content. The outcome of appreciation, in the absence of ITP, has been slowing down structural change and growth.
Path-dependence is an important concept linking short run shocks with long run outcomes. The econometric evidence confirms the existence of path dependence. This sends a clear message to policy-makers: there are significant endogenous factors that reproduce the dominant pattern of specialization. To overcome a slow-growth trap (or sustain the momentum of growth) it is necessary to use active policies in order to alter the parameters governing structural change. Only strong policy measures can compensate for the endogenous forces that perpetuate structural constraints on growth. A depreciated RER may serve as a starter for a surge in exports that – via increasing returns – gives rise to the upgrading of the export structure. But for this upgrading to occur, a competitive RER should be combined with active ITP boosting both, the learning coefficients of the Kaldor-Verdoorn Law and the implantation of new sectors not related to current comparative advantages.
The cases of catching up and convergence (in technology and income with rising equality) in the post-war years have included high RER and an active ITP in the policy mix. The experience of the most successful Asian economies (from Korea in the sixties to China nowadays) points out in the same direction. RER and ITP should be seen as complementary -- two mutually reinforcing instruments – rather than as substitutes in spurring structural change.
24
References
Acemoglu, D. (2009) Introduction to Modern Economic Growth. Princeton U. Press.
Agosin, M.R. (2009) “Export Diversification and Growth in Emerging Economies”, Revista de
la Cepal 97, pp. 115-131, April.
Agosin, M.R., Alvarez, R. and Bravo-Ortega, C. (2011) “Determinants of Export Diversification Around the World”, Central Bank of Chile, Working Paper N. 605, January.
Amsden, A. (1989), Asia’s Next Giant: South Korea and Late Industrialization, New York, Oxford University Press
Araujo, R.A. and G. Lima (2007) ‘A Structural Economic Dynamics Approach to Balance of Payments Constrained Growth’, Cambridge Journal of Economics, September.
Arellano, M., and S. Bond. 1991. Some tests of specification for panel data: Monte Carlo evidence and an application to employment equations. Review of Economic Studies 58: 277{97.
Arthur, B. (1994) Increasing Returns and Path-Dependency in Economics. Ann Arbor: Michigan University Press.
Baldwin, R. (1988) “Hysteresis in Import Prices: The Beachhead Effect”, American Economic Review, 78, pp. 773-785.
Baldwin R., Krugman P. R. (1989) “Persistent Trade Effects of Large Exchange Rate Shocks, Quarterly Journal of Economics, 104, pp. 635-654.
Bastourre, D.; Casanova, L. And Espora, A. (2011)”Tipo de Cambio Real y Crecimiento: Síntesis de la Evidencia y Agenda de Investigación”, Departamento de Economía, Universidad Nacional de la Plata, Documento de Trabajo n. 82, February 2011.
Bell, M. (2006), “Time and technological learning in industrialising countries: how long does it take? How fast is it moving (if at all)?, International Journal of Technology
Management, vol. 36, No. 1–3, pp. 25–39
Bernard, A. and B. Jensen (2004) “Entry, Expansion and Intensity During the U.S. Export Boom 1987-1992.” Review of International Economics 12(4): 662-675.
Berthou, A. (2008) “An Investigation on the Effect of the Real Exchange Rate Movements on OECD Bilateral Exports”, European Central Bank”, Working Paper Series n. 920, July. Blecker, R. (2009) “Long-Run Growth in Open Economies: Export-Led Cumulative Causation
or a Balance-of-Payments Constraint?, Paper prepared for presentation at the 2nd Summer School on “Keynesian Macroeconomics and European Economic Policies,” Research Network Macroeconomics and Macroeconomic Policies, 2-9 August, 2009, Berlin, Germany.
Broda, C.M (2002) “Terms of Trade and Exchange Rate Regimes in Developing Countries”, FRB of New York Staff Report No. 148, March.
Berg, A. and Miao, Y (2010) “The Real Exchange rate and Growth Revisited: The Washington Consensus Strikes Back?”, IMF Working Paper, March.
Cadot, O.; Carrère, C. and Strauss-Kahn, V. (2011) “Export Diversification: What’s Behind the Hump?”, Review of Economics and Statistics, 93(2), pp. 590-605.
Ciarli, T., Lorentz, A., Savona, M., & Valente, M. (2010). “The Effect of Consumption and Production Structure on Growth and Distribution. A Micro to Macro Model”,
Metroeconomica, 61(1), pp. 180–218
Chang, H.J. (2001), “Infant Industry Promotion in Historical Perspective. A Rope to Hang Oneself or a Ladder to Climb With?”, document prepared for the conference Development Theory at the Threshold of the Twenty-first Century”, Economic Commission for Latin America and the Caribbean (ECLAC), August 2001.
Cimoli, M. (1988), “Technological gaps and institutional asymmetries in a North-South model with a continuum of goods”, Metroeconomica, vol. 39, No. 3, pp. 245–74.
Cimoli, M., G. Dosi and J. Stiglitz (eds.) (2009), Industrial Policy and Development, The
Political Economy of Capabilities Accumulation, Oxford, Oxford University Press
Cimoli, M. and Porcile, G. (2009) “Sources of Learning Paths and Technological Capabilities: An Introductory Roadmap of Development Processes”, Economics of Innovation and
New Technology, 1476-8364, Volume 18, Issue 7, 2009, pp. 675 – 694
Cimoli, M.; Porcile, G. Rovira, S. (2010) “Structural Convergence and the Balance-of-Payments Constraint: Why Did Latin America Fail to Converge”, Cambridge Journal of
Economics, v. 34, n. 2, March, pp. 389-411.
Cimoli and Porcile (2011) “Learning, Technological Capabilities and Structural Dynamics”, in Ocampo, J.A. and Ros, J. (2011) The Oxford Handbook of Latin American Economics, Oxford University Press, in press.
David, P. (2007) “Path-Dependence: A Foundational Concept for Historical Social Science”, Cliometrica, 1(2), pp. 91—114.
Dornbusch, R., Fischer, S. and Samuelson, P. (1977) “Comparative Advantage, Trade and Payments ina Ricardian Model With a Continuum of Goods”, American Economic
Review, 67, pp. 823-309.
Dosi, G., K. Pavitt and L. Soete (1990), The Economic of Technical Change and International
Trade, London and New York, Harvester Wheatsheaf Press/New York University Press.
Dosi, S. Lechevalier, A. Secchi (2010) “Introduction: Interfirm heterogeneity? Nature, sources
and consequences for industrial dynamics”,
Industrial And Corporate Change, 19(6), pp. 1867-1890.
ECLAC, (2007), “Progreso Técnico y Cambio Estructural en América Latina”, (LG/W. 136),
Division of Production, Productivity and Management, United Nations, Santiago (Chile), October 2007.
Eichengreen, B. (2008) “The Real Exchange Rate and Growth” Working Paper N. 4, Commission on Growth and Development.
Fang, W., Y. Lai and S. Miller (2006) “Export Promotion through Exchange Rate Changes: Exchange Rate Depreciation or Stabilization?” Southern Economic Journal, 72(3): 611-626.
Feenstra, R., Lipsey, R., Deng, H, Alyson C. and Mo, H (2005) World Trade Flows: 1962-2000. NBER Working Paper Series, Vol. w11040, 2005.
Freeman, C. (1995) “The National System of Innovation in Historical Perspective”, Cambridge
Journal of Economics, v. 19 (1), pp. 5-24.
Frenkel, R. and Rapetti, M. (2011) “A Concise History of Exchange Rate Regimes in Latin America”, in Ocampo, J.A. and Ros, J. (2011) The Oxford Handbook of Latin American
Economics, Oxford University Press.
Freund, C. and Pierola, M.D. (2008a) “Export Surges: The Power of a Competitive Currency”. The World Bank, Policy Research Working Paper 4750, October.
Freund, C. and Pierola, M.D. (2008b) “Export Entrepreneurs: Evidence From Peru”, Word Bank Workin Paper, December.
Gouvea, R.R. and G.T. Lima (2010) “Structural Change, Balance of Payments Constraint and Economic Growth : Evidence from the Multi-Sectoral Thirlwall’s Law”, Journal of Post Keynesian Economics, 33 (1), October, pp. 169-204.
Hansen, L. 1982. Large sample properties of generalized method of moments estimators. Econometrica 50(3): 1029,54
Hausmann, R.; Hwang, J. and Rodrik, D. (2007) "What you Export Matters," Journal of Economic Growth, 12(1), pp. 1-25, March.
Haber and Menaldo (2011) ”Do Natural Resources Fuel Authoritarianism? A Reappraisal of the Resource Curse”, American Political Science Review, Vol. 105, No. 1, pp. 1-26, 2011.
Imbs, J. and Wacziarg, R. (2003) Stages of Diversification, American Economic Review, 93 (1), pp. 63-86.
Katz, J. (1987), Technology Generation in Latin American Manufacturing Industries: Theory
and Case-Studies Concerning its Nature, Magnitude and Consequences, London, The Macmillan Press.
Lall, S. (2000) “The Technological Structure and Performance of Developing Country Manufactured Exports, 1985–98”, Oxford Development Studies, vol. 28, n. 3, pp. 337-369.
McMillan, M. and Rodrik, D. (2001) “Globalization, Structural Change and Productivity Growth”, Joint ILO-WTO paper, February.
Metcalfe, J. S. (2001), "Institutions and Progress," Industrial and Corporate Change, Oxford University Press, vol. 10(3), pages 561-86, September.
Moreno-Brid, J. (2003) “Capital Flows, Interest Payments and the Balance of Payments Constrained Growth Model: A Theoretical and Empirical Analysis”, Metroeconomica , 54 (3), pp. 346-365.
Narula, R. (2004)“Understanding Absorptive Capacities in an Innovation Systems Context: Consequences for Economic and Employment Growth”, DRUID Working Paper n. 04-02, December.
Nassif, A., Feijó, C. and Almeida, M.A.S. (2010) “Why Does Real Exchange Rate Overvalue in Brazil? Theoretical Determinants, Empirical Evidence and Economic Policy Dilemmas”,
38th Encontro Nacional de Economia, ANPEC, 7-10 December, Salvador, Brazil.
Nelson, R. (ed.) (1993), National Systems of Innovation, Oxford, Oxford University Press.
Nelson, R. and Winter, S. (1982) A evolutionary Theory of Economic Change, Harvard U. Press. Nugent, J. B.; Robinson, J. A. (2010) “Are Factor Endowments Fate?”, Revista de Historia
Económica. Journal of Iberian and Latin American Economic History 28(1), pp. 45-82.
Ocampo, J.A. (2011) “Macroeconomía Para el Desarrollo: Políticas Anticíclicas y Transformación Productiva”, Revista CEPAL 104, pp. 7-35, August.
Pacheco-Lopez, P. and Thirlwall, A.P. (2006) “Trade Liberalization, the Income Elasticity of Demand for Imports and Economic Growth in Latin America”, Journal of Post-Keynesian
Economics 29 (1), pp. 41-61.
Peres,W. (2010), “The (slow) return of industrial policies in Latin America and the Caribbean”, M. Cimoli, G. Dosi and J. E. Stiglitz (eds) The Political Economy of Capabilities
Accumulation: the Past and Future of Policies for Industrial Development, Oxford University Press.
Prebisch, R. (1949) El Desarrollo Económico de América Latina y su Principales Problemas (New York: United Nations, 1950).
Rada, C. (2007) “Stagnation or transformation of a dual economy through endogenous productivity growth”, Cambridge Journal of Economics 31(5), pp. 711-740.
Rapetti, M. (2011) “Macroeconomic Policy Coordination in a Competitive Real Exchange Rate Strategy for Development”, Working Paper, Department of Economics, University of Massachusetts, Amherst, 2011-9.
Rapetti, M.; Razmi, A. and Skott, P. (2009) “The Real Exchange Rate as an Instrument of Developing Policy”, Working Paper, Department of Economics, University of Massachusetts, Amherst, 2009-07.
Reinert, E.S. (1995) “Competitiveness and its predecessors - a 500 Year cross-national perspective” in Structural Change and Economic Dynamics, Vol. 6, pp. 23-42.
Rodríguez, O. (2007) El Estructuralismo Latinoamericano. México: Siglo XXI.
Rodrik, D. (2008): “The Real Exchange Rate and Economic Growth,” Brookings Papers on Economic Activity, 2008:2.
Ros, J. (2002) Economic Growth and Development Theory, Michigan University Press.
Saviotti, P. and Pyka, A. (2004) “Economic Development, Variety and Employment”, Revue
Économique 55 (6), pp.1023-1050.
Saviotti, P and Frenken, K. (2008) “Export Variety and the Economic Performance of Countries”, Journal of Evolutionary Economics (18), pp. 201-218.
Schumpeter, J.A. (1911) The Theory of Economic Development: An inquiry into profits, capital,
credit, interest and the business cycle). New Jersey: Transaction books, 1984 (translation of 1934).
Setterfield, M. (2009a) “Neoclassical Growth Theory and Heterodox Growth Theory: Opportunities For and Obstacles To Greater Engagement”, Trinity College Department of Economics, Working Paper 09-1, December.
Setterfield, M. (2009b) "Path dependency, Hysteresis and Macrodynamics," in P. Arestis and M. Sawyer (eds) Path Dependency and Macroeconomics (International Papers in Political
Economy 2009), London, Palgrave, Macmillan.
Stalling, B. and Peres, W. (2000) Growth, Employment and Equity: The Impact of Economic
Reforms in Latin America and the Caribbean, Washington, DC: Brookings Institution Press.
Sekkat, K. and Varoudakis, A. (2000) “Exchange Rate Management and Manufactured Exports in Sub-Saharan Africa”, Journal of Development Economics, 61 (1), pp. 237-253.
Thirlwall, A.P. (1979) “The Balance of Payments Constraint as an Explanation of International Growth Rate Differences”, Banca Nazionale di Lavoro, March, 128, pp. 45-53.
Thirwall, A. (2011) “Balance of Payments Constrained Growth Models: History and Overview”. University of Kent, School of Economics Discussion Paper 1111, May.
Wade, R. (1990), Governing the Market: Economic Theory and the Role of Government in East
Asian Industrialisation, Princeton, Princeton University Press.
WITS (2000-2008), World Integrated Trade Solution (WITS) http://wits.worldbank.org/wits/ .
[image:18.595.68.270.286.418.2]Figures and Tables
Figure 1, RER and Specialization
Sectors, z
z2
Real exchange rate
z3 q1
q2
North-South productivity gap
Table 1: Dependent Variable: Gini Index
Dependent: GINI
L.GINI 0.214*** 0.241*** 0.316*** 0.183*** 0.266*** 0.184*** (6.60) (7.43) (10.02) (5.67) (8.13) (5.62)
RER -0.549*** -0.453*** -0.479*** -0.389*** -0.504*** -0.450*** (-9.88) (-8.41) (-9.29) (-7.97) (-10.08) (-9.43)
GDP -0.352*** -0.283*** -0.504*** -0.0946 -0.464*** -0.0676 (-5.49) (-4.48) (-7.69) (-0.97) (-6.76) (-0.72)
Volatility -0.431*** -0.129 -0.0957 -0.230* -0.163 (-3.29) (-0.99) (-0.80) (-1.87) (-1.40)
OPEN 0.667*** 0.726*** 0.511*** 0.628*** (9.51) (12.09) (7.69) (10.54)
HumanK -0.448*** -0.373*** (-7.30) (-5.87)
PhisicalK -0.179* -0.309*** (-1.74) (-3.15)
AGRIPC 59.98*** -9.065
(3.82) (-0.59)
ENERGY 0.0150*** 0.0139***
(6.24) (6.13)
MINERY 0.0336*** 0.0255***
(3.34) (2.72)
Obs. 724 724 724 724 678 678 Countries 111 111 111 111 106 106 AB(2) 0.488 0.637 0.574 0.558 0.559 0.43
Table 2: Dependent Variable: Herfindhal Index
Dependent: HERF
L.HERF 0.0429 0.0722** 0.115*** 0.211*** 0.135*** 0.216*** (1.29) (2.19) (3.53) (6.51) (4.07) (6.58)
RER -0.494*** -0.451*** -0.420*** -0.297*** -0.416*** -0.364*** (-7.86) (-7.61) (-7.20) (-4.77) (-7.07) (-5.96)
GDP -0.0261 -0.0266 -0.0999 -0.710*** -0.114 -0.609*** (-0.37) (-0.37) (-1.26) (-5.49) (-1.34) (-4.89)
Volatility -0.165 -0.0449 0.253 -0.0241 0.187 (-1.10) (-0.29) (1.64) (-0.16) (1.24)
OPEN 0.113 0.243*** 0.0280 0.147* (1.39) (3.20) (0.35) (1.94)
HumanK -0.185** 0.0139 (-2.54) (0.18)
PhisicalK 0.517*** 0.297** (3.83) (2.31)
AGRIPC 61.80*** 61.29***
(3.13) (3.03)
ENERGY 0.0142*** 0.0146***
(4.87) (4.99)
MINERY 0.0250** 0.0210*
(2.07) (1.75)
Obs. 724 724 724 724 678 678 Countries 111 111 111 111 106 106 AB(2) 0.0869 0.175 0.222 0.27 0.227 0.265
Table 3: Dependent Variable: Theil Index
Dependent: THEIL
L. THEIL 0.222*** 0.259*** 0.330*** 0.219*** 0.268*** 0.218*** (6.94) (8.17) (10.67) (6.91) (8.31) (6.75)
RER -0.533*** -0.429*** -0.456*** -0.363*** -0.482*** -0.417*** (-9.71) (-8.12) (-9.00) (-7.46) (-9.91) (-8.87)
GDP -0.382*** -0.213*** -0.532*** -0.187* -0.466*** -0.137 (-5.99) (-4.05) (-8.12) (-1.92) (-6.87) (-1.48)
Volatility -0.407*** -0.0645 -0.0364 -0.162 -0.0971 (-3.15) (-0.50) (-0.30) (-1.35) (-0.84)
OPEN 0.666*** 0.701*** 0.484*** 0.594*** (9.58) (11.68) (7.41) (10.07)
HumanK -0.413*** -0.318*** (-6.72) (-5.07)
PhisicalK -0.119 -0.266*** (-1.16) (-2.72)
AGRIPC 65.73*** 2.815
(4.24) (0.18)
ENERGY 0.0149*** 0.0140***
(6.33) (6.22)
MINERY 0.0373*** 0.0284***
(3.78) (3.06)
Obs. 724 724 724 724 678 678 Countries 111 111 111 111 106 106 AB(2) 0.349 0.557 0.976 0.999 0.936 0.925
Table 4: Dependent Variable: Medium and High Technology Export Share
Dependent: HIGH AND MEDIUM TECH EXPORTS
L. HMTE 0.0430 0.0707** 0.109*** 0.145*** 0.141*** 0.132*** (1.31) (2.16) (3.31) (4.39) (4.16) (3.81)
RER 0.472*** 0.393*** 0.331*** 0.154* 0.287*** 0.200** (5.43) (4.61) (3.89) (1.75) (3.22) (2.17)
GDP 1.095*** 0.957*** 0.762*** 0.653*** 0.548*** 0.555*** (9.12) (8.21) (6.31) (3.51) (4.27) (2.91)
Volatility 0.167 0.284 0.151 0.361 0.219 (0.75) (1.26) (0.68) (1.59) (0.96)
OPEN 0.204* -0.118 0.198 -0.0360 (1.65) (-1.01) (1.60) (-0.29)
HumanK 0.412*** 0.451*** (3.78) (3.78)
PhisicalK -0.0449 0.118 (-0.22) (0.57)
AGRIPC -59.24* 81.28***
(-1.89) (2.79)
ENERGY -0.0140*** -0.0131*** (-3.15) (-2.95)
MINERY -0.0261 -0.00292
(-1.43) (-0.14)
Obs. 701 701 701 701 661 661 Countries 110 110 110 110 105 105 AB(2) 0.185 0.235 0.281 0.534 0.625 0.6
Appendix I: Variables and Sources
Real GDP per capita, rgdpc:Penn World Tables, in PPP adjusted to 2005.
Stock of physical capital per capita, capital: estimated using the method of permanent inventory, based on the series of investment (ki) of the Penn World Tables.
Real exchange rate in PPP, pRER: it is estimated by dividing the exchange rate (XRAT in the PWT) by the conversion factors of the PPP (variable P in Pen World Tables). This is the same indicator used by Rodrik (2008).
Volatility of the RER, volpRER: Variance of the RER within 5-year periods.
Human capital, humancapital: measured by educational attainment of the population above 14 years-old, as reported in Barro & Lee, http://www.barrolee.com.
Adaptability Index, IA: Ratio between the share of sectors whose demand grows above the average and the share of sectors whose demand grows below average. Data was obtained from the data bank of Feenstra et al (1962-2000) and WITS (2000-2008) at a 3-digit level.
Index of Theil, Gini and Herfindahl: Data obtained from the data bank of Feenstra et al (1962-2000) and WITS (2000-2008) at a 3-digit level.
Share of sectors of medium and high technology in total exports, MHT: Based on the classification of Lall (2000), using the SITC at a 2-digit level.
Terms of trade, TOT: World Bank, World Development Indicators.
Openness, openc: Exports plus imports as percentage of GDP, Penn World Tables.
Share of agricultural production in GDP, VBAgri: World Bank, World Development Indicators.
Agricultural land per capita, Algrilandpc: km2 de arable land per capita, World Bank, World Development Indicators.
Appendix II: List of Countries
Countries
Afghanistan Gambia, The Nicaragua
Albania Ghana Niger
Algeria Greece Norway
Argentina Guatemala Pakistan Australia Guyana Panama
Austria Haiti Papua New Guinea Bahrain Honduras Paraguay
Bangladesh Hong Kong Peru Barbados Hungary Philippines Belgium Iceland Poland
Belize India Portugal
Benin Indonesia Rwanda
Bolivia Iran Senegal
Brazil Iraq Sierra Leone Bulgaria Ireland Singapore Burundi Israel South Africa
Cambodia Italy Spain
Cameroon Jamaica Sri Lanka
Canada Japan Sudan
Central African Republic Jordan Sweden Chile Kenya Switzerland
China Korea Syria
Colombia Laos Taiwan
Congo, Republic of Liberia Tanzania Costa Rica Macao Thailand Costa de Marfil Malawi Togo
Cuba Malaysia Trinidad &Tobago
Cyprus Mali Tunisia
Denmark Malta Turkey
Ecuador Mauritania Uganda
Egypt Mauritius United Kingdom El Salvador Mexico United States
Fiji Mongolia Uruguay
Finland Morocco Venezuela France Mozambique Vietnam
Gabon Nepal Zambia