Munich Personal RePEc Archive
Determinants of FDI inflows to
developing countries: a panel data
analysis
Khachoo, Ab Quyoom and Khan, Mohd Imran
Department of economics, Pondicherry university, Centre for
Development Studies, Trivandrum, Kerala
February 2012
Online at
https://mpra.ub.uni-muenchen.de/37278/
Determinants of FDI inflows to Developing Countries: A Panel Data Analysis
Ab Quyoom Khachoo
Department of economics Pondicherry University, Pondicherry
Mohd Imran Khan
Centre for development studies Trivandrum, Kerala.
Abstract
The aim of this paper is to identify, by estimating a panel econometric model, the factors
determining FDI inflows to developing countries over a long period. The study is based on a
sample of 32 developing countries. In our analysis, FDI inflows are modeled as a function of the
market size, total reserves, infrastructure, labour cost and degree of openness-for the host
countries. Using data from 1982 to 2008, a panel data estimator suggests that the market size,
total reserves, infrastructure and labour costs are the main determinants of FDI inflows to
developing countries.
Key words: FDI Inflows, Fully Modified Ordinary Least Squares (FMOLS), Pedroni’s Panel
Cointegration Methodology, Developing Countries.
JEL Classification: C23, F21, F23.
1. Introduction
One of the economic problems of developing countries is that they do not have enough national
savings to finance their investments. They are in constant need of foreign capital in forms of both
direct and indirect investments. Initially, they took loans from international commercial banks.
But in the 1980s the drying-up of commercial bank lending, because of debt crises, forced many
of the countries to reform their investment policies so as to attract more stable forms of foreign
capital, and FDI appeared to be one of the easiest way to get foreign capital without undertaking
any risks linked to the debt. Thus, it became an attractive alternative to bank loans as a source of
capital inflows. Foreign direct investment (FDI) is a process whereby the residents of the source
other activities of a firm in the host country. The International Monetary Fund’s Balance of
Payments Manual defines FDI as, “an investment that is made to acquire a lasting interest in an
enterprise operating in an economy other than that of the investor, the investor’s purpose being to
have an effective voice in the management of the enterprise”. The United Nations World
Investment Report (UNCTAD, 1999) defines FDI as, “an investment involving a long-term
relationship and reflecting a lasting interest and control of a resident entity in one economy
(foreign direct investor or parent enterprise) in an enterprise resident in an economy other than
that of the foreign direct investor (FDI enterprise, affiliate enterprise or foreign affiliate)”. The
most important feature of the FDI definitions given above lies in terms ‘control’ and ‘controlling
interest’ which distinguishes FDI from portfolio investment. Since portfolio investment is short
-term in nature and does not involve control or lasting interest. FDI is all about the ownership and
control of a foreign investor on a foreign company. The investor, in exchange of this ownership
usually transfers some of its financial, technical, managerial, trademark and other resources to
the company he invests on in the foreign land.
There is no consensus on what constitutes a controlling interest, but generally a minimum of 10
per cent shareholding is considered as allowing the MNCs to exert a significant effect over the
key policies of the underlying project. Razin et al. (1999b) argue that the element of control over
the management policy and decisions gives the foreign direct investors an informational
advantage over the foreign portfolio investors and over domestic savers. But what actually the
term ‘control’ implies is that the foreign direct investors have some discretionary power in
making decisions regarding the management policies and strategy. Simply it reflects the ability
of the investor to elect one or more members on the board of directors of the foreign company or
foreign subsidiary. However, Lall and Streeten (1977) argue that a majority shareholding is not
an essential condition for exercising control, as it may be achievable with a low equity share and
even without an explicit management contract.
This paper is organized as follows. Section 2 explains the theoretical framework of FDI. Section
3 gives empirical evidence of earlier studies on determinants of FDI. Data and methodology are
discussed in section 4 and section 5 explains the econometric results. Conclusion of the study is
2. Theoretical Background
There are many theories which attempt to explain the determinants of FDI. These theories are
significant steps towards the development of a systematic framework for the emergence of FDI.
However, the capacity to serve as a self contained general theory, which could explain all types
of FDI (i.e., outward as well as inward FDI at the firm, industry, and country level), has been
questioned in the works of various scholars. Agarwal (1980), Parry (1985), Itaki (1991) can be
given as examples.
The theory of capital movements was the earliest explanation for FDI, which was viewed as a
part of portfolio investments. Hymer’s pioneering contribution was the first explanation of FDI
in the industrial organization tradition. Hymer explains that MNCs indulge in FDI only if they
possess some advantages or have an edge over local firms arising from intangible assets such as
well-known brand name, patent- protected technology, managerial skills, and other firm specific
factors. FDI may arise because it is difficult to sell or lease these intangible assets even thought
the MNCs want to do so. In comparison to Industrial organization theory, the Internalization
approach emphasizes that firms carry out FDI because of the imperfections in product and factor
markets and as a result of which firms try to replace market transactions with internal
transactions. They do so because it helps them to save certain marketing costs. The advantage of
internalization is the dodging of time lags, bargaining and buyer uncertainty. In contrast to it, the
location theory states that the main cause of FDI is the immobility of some factors of production
such as labour and natural resources across nations. This stillness in factors of production leads
to location-related discrepancy in their costs. John Dunning (1981) proposed an all-inclusive
theoretical structure of FDI flows. He established the eclectic theory of FDI by way of the so
called OLI paradigm (ownership-location-internalization), a theory that even today hasn’t lost its
authenticity and relevance. It represents a mishmash of three partial theories of FDI, which
focused on the ownership advantages, the location advantages and the internalization advantages.
3. Empirical Evidence
So for various empirical studies have been conducted by researchers to identify the factors that
FDI vary from study to study and from country to country. Therefore, in reviewing these studies
it is difficult to derive one list of determinants, especially as some have gained or lost importance
over time. This review focuses on the empirical studies conducted by various researchers on
determinants of FDI in developing countries.
Reuber et al. (1973) in their study on the determinants of US FDI into Western Europe found that
the main factors that attracted the US investment were lucrative market, liberal host govt.
policies, technological infrastructure and cultural proximity. In contrast to it Agarwal (1980) in
his study named “Determinants of FDI”: A Survey based on developing countries experience
tried to make use of some factors as FDI determinants. The factors used were comparative labour
cost, country size, the nature of exchange rate regime and political factors including political
stability and he got satisfied results. Similarly Schneider and Frey (1985) conducted a research
on 80 developing countries and concluded that the country’s level of development plays a major
role in attracting overseas capital. Moreover, they found that political instability in a country
leads to a sharp decline in the inflow of foreign capital. Likewise Munteanu (1991) in his studies
found that MNCs desire to operate within a developed nation, possessing a reliable infrastructure
because that will result in more efficient distribution system. The World Investment Report of
1998 published by UNCTAD states that infrastructure definitely exerts its influence on the
inflow of FDI. Wheeler and Mody (1992) too have shown, “well developed infrastructure” as a
determinant of capital investment by multinationals. In line with above, Lucas (1993) conducted
a study to find out the main determinants of FDI on seven East and South-East Asian economies
over the years 1960-87 used an innovative theoretical model based on derived demand for
foreign capital of a profit maximizing multiple product monopolists. Two versions of the model
were employed. The basic model is estimated in logarithmic and linear form separately for each
country. The empirical results reflect that for five of the seven countries studied, FDI positively
respond to the rental equivalent of cost of capital and the product price.
Tsai (1994) in his empirical study used economic variables like market size and growth factors,
trade balance and hourly wage rate in manufacturing to examine their effect on inflows of FDI.
The study uses Simultaneous Equations Approach to find out whether the said variables affect
the FDI inflows or not. The time span of the study was split into two different time periods viz.
1975-78 and 1983-86. The results of the study show that market size and growth have positive
on 36 developing countries found that per capita GDP, wage cost, investment climate
represented by per capita debt, volatility of prices and availability of energy have significant
effects on foreign investment. Whereas Clegg et al. (1995) have found that the variation of FDI
inflow into developing countries can be explained by various factors such as GDP and its
growth, R&D intensity, economies of scale, per capita exports and imports, exchange rate
differentials, the level of development of the country’s infrastructure, tariff barriers, dependence
on host country’s raw materials, the level of political stability and political risk, proximity of
host country to investing country and availability of skilled manpower. Similarly Urata, S. &
Kawai (2000) conducted a study on determinants of Japanese FDI in 117 developing, developed
and Asian countries over the period 1980-1994. They conducted the analysis for four
manufacturing sub-sectors, viz. textiles, general machinery, electric machinery and transport
machinery which account a dominant share of Japanese FDI. They employed the conditional
Logit model to examine their objectives. They had taken profits of firm as a dependent variable
and included demand and supply side factors such as cheap labour, infrastructure, good
governance, industrial agglomeration, and exchange rate and its variability, schooling and market
size as explanatory variables. They found that supply side variables are important for attracting
Japanese FDI in developing countries while demand side variables account for attracting
Japanese FDI to developed countries. In an attempt to analyze the determinants of FDI in
transition economies Garibaldi et al. (2001), while examining the determinants of foreign capital
in 26 transition over a period 1990 to 1999 concluded that the important factors that influence the
FDI inflows in these economies were market size, fiscal deficit, inflation, and exchange rate
regime, risk analysis, economic reforms, trade openness, availability of natural resources,
barriers to investment and bureaucracy. Peter and Julius (2002) in their study on the FDI
determinants analyzed the data from 28 countries from 1987-2000 and found that per capita
GNP, risk factors, years of schooling, foreign trade restrictions, administrative bottlenecks and
cost factors were very important in determining FDI inflows. Whereas population, GNP growth,
firm entry restrictions, post-entry restrictions and technology all proved to be insignificant.:
sound institutions, trade openness, & lower restrictions to FDI inflows.
Anjuman Aqeel and Nishat (2004) conducted a study to examine the determinants of foreign
capital inflows into Pakistan for the years 1961-2003. To examine the objectives of their study
inflows as dependent variable and market size, wage rate, exchange rate, tariff rate, tax rate,
credit to private sector and index of general share prices as independent variables. Their
empirical results reflects that all the explanatory variables except wage rate and share price index
are statistically significant and exert a great influence in attracting FDI inflows into Pakistan.
In contrast to it, Pravakar Sahoo (2006) conducted a study to identify the determinants of FDI in
South Asian countries over the period 1975-2003.The countries included in sample were India,
Pakistan, Bangladesh, and Srilanka. The methods used to find out the FDI determinants were
Panel Cointegration and Pooled OLS and variables included in the model were FDI as dependent
variable and other 11 explanatory variables. The empirical results of the study reflect that major
determinants of FDI were market size, labour force growth rate, infrastructure index and trade
openness. The study suggests that in order to attract more and more inflows of foreign capital
these countries have to maintain growth momentum to improve their market size, trade policies,
to make better use of their abundant labour supply, address infrastructure bottlenecks and follow
more open trade policies.
A study by Abdulla Azizov on determinants of FDI in CIS countries with transition economy
using dynamic panel model suggests that key determinants of FDI inflows to transition
economies of Commonwealth of Independent States were market size, inflation rate, fiscal
balance, main telephone lines are all significant and have expected sign. The results also indicate
that FDI inflow is not influenced by corruption in host countries. Results show that control of
corruption has no significant effect on FDI inflows into these economies. Similar other study
conducted by Dawn Holland and Nigel Pain on the determinants of FDI in the Transitional
Economies using panel data suggests that method of privatization, proximity to the EU and the
extent of trade linkages with the advanced economies have significant effects on the level of
foreign investments. The authors also detect a role for risk and relative labour costs in host
countries, suggesting a degree of competition to attract inward investment.
The review of the above empirical studies on determinants of FDI indicate lack of uniformity in
the regressors considered for determining their relationship with FDI and also the results of these
studies are not similar. Further, all the relevant variables were not considered in a single model,
and not all the determinants were found relevant for each country. Besides, none of the above
empirical studies have employed the Fully Modified Ordinary Least Square method to find out
flows by addressing the above limitations. The study makes use of FMOLS technique to look
into the determinants of FDI in 32 developing countries.
3. Data and Methodology
The data set consists of yearly observations for the period 1982-2008 for the 32 developing
countries.. All the selected countries belong to the category of developing economies according
to classification given in the World Investment Report of 2003. As many of the developing
countries started the process of financial sector reforms since middle of 1980s therefore the
reference period for the study is taken from 1982 to 2008. The required data set for the selected
countries were obtained from UNCTAD-World Investment Reports, World Development
Reports, RBI Bulletins, CMIE, and IMF’s International Financial Statistics.
Foreign Direct Investment (lnfdi):FDI have been taken as the inflows of foreign capital. It is the sum
of equity capital, reinvested earnings, and other long-term and short-term capital as shown in the
capital account of balance of payments. In the study the variable is used in its natural log form
and is denoted as lnfdi. The figures of the FDI are in current US $ and are compiled from various
issues of World Investment Report.
Gross Domestic Product (lngdp): Gross domestic product is the measure of all final goods and
services produced domestically in a given year. It is the sum of gross value added by all residents
in the domestic country plus any taxes minus subsidies. It is calculated without making
deductions for depreciation of capital. In our study it is used in natural log form and is denoted as
lngdp. The GDP figures are in current US $ and the data are collected from World Bank (IBRD)
and International Monetary Fund (IMF).
Total Reserves (lntr):Total reserves comprise holdings of monetary gold, special drawing rights, reserves of IMF members held by the IMF, and holdings of foreign exchange under the control
of monetary authorities. The variable is used in its natural log form and is denoted as lntr. Data
are in current U.S. dollars. The data has been compiled from World Bank website.
Electric power consumption (lnpc): Electric power consumption(kWh per capita) measures the
production of power plants and combined heat and power plants less transmission, distribution,
electric power consumption as a proxy for infrastructure. The variable is symbolized as lnpc. The
data has been taken from World Development Indicators (2007).
Wage rate (lnwgr): Wage rate is the Workers' remittances and compensation of employees. It
comprises current transfers by migrant workers and wages and salaries earned by non- resident
workers. Wage rate is used as a proxy for labour cost. The variable is denoted as lnwgr. Data are
in current U.S. dollars and has been taken from World Bank staff estimates based on IMF
balance of payments data.
Openness (opn): Openness is used to measure the trade openness of a country. It is computed as the
ratio of imports and exports of goods and services to gross domestic product. The data for the
variables used to construct the openness variable are in current US$ and is taken from World
Bank. The variable openness is constructed as
100 /
exp imp gdp
opn
Where opn stand for openness, exp is for exports, imp for imports and gdp denoted gross
domestic product.
3.2. Methodology
The study uses panel data technique to estimate the model since panel data has some advantages
over cross- section and time series data in using all the information available, which is not
detectable in pure cross-sections or in pure time series. Panel data controls for individual
heterogeneity whereas time-series and cross-section data did not control it and as a result run the
risk of obtaining biased results. Further, panel data are capable of identifying and measuring the
effects that are not detectable in pure cross-section or pure time-series data.
To identify the factors that influences the FDI inflows, the above mentioned variables are
incorporated in the following equation
it it i it i
it i it i it i
it
gdp
tr
lpc
wgr
opn
fdi
1ln
2ln
3 4ln
5ln
(i=1…….N, where N=number of cross sectional units; t=1…....T, where T is the time period)
The study uses recently developed panel unit root and panel cointegration tests and Fully
Modified Ordinary Least Squares (FMOLS) to identify and estimate the impact of factors that
exert influence on the inflows of overseas capital. The FMOLS technique was first proposed by
Pedroni (1996, 2000). FMOLS technique is having an edge over the Ordinary Least Square
(OLS) technique in the sense that it is able to take into account both the serial correlation and
endogeneity problems present in the variables which is not true in case of OLS.The OLS
estimator is only used in case of exogeneity of the regressors and homogeneous dynamics across
the individual members of the panel Hence, the estimates obtained using Panel FMOLS are
unbiased. The panel data estimation is employed in the study to capture the dynamic behaviour
of the parameters and to provide a more estimation and information of the parameters.
Therefore, taking into the consideration the advantages of FMOLS over other methods of
estimation, our study makes an attempt to employ the former in order to get better results.
The OLS estimates as mentioned above are not reliable because they suffer from different
problems. For example, most of the macroeconomic variables employed in this study are likely
to exhibit stochastic and/or deterministic time trends and therefore non-stationary; thus the
reported estimates are likely to be spurious in nature. It is therefore highly important to test for
the presence of unit roots (non-stationarity) of the variables in the model.
This study employs several panel unit root testing methodologies to determine the order of
integration of the variables included in the model. If the order of integration is zero, the series is
considered to be stationary and thus free from a unit root. Traditionally DF (Dicky Fuller) or
ADF (Augmented Dicky Fuller) tests have been used to test for the unit roots in time series data.
However, these tests suffer from low power in rejecting the null of non-stationarity series as well
as limiting distributions which are complicated and not well defined. In order to avoid these
problems ,the study uses the more reliable and well –behaved panel unit root tests such as Levin,
Lin and Chu (LLC,2002), Im, Pesaran and Shin (IPS, 2003), Fisher type-ADF and
Philips-Perron(Fisher-PP) tests. These tests are based on the null of a unit root against the alternative of
stationarity of the series. The results of the panel unit root tests for the chosen variables, both in
level and first difference are reported in tables 1.1 and 1.2 presented in section 3.3 of the present
3.2.1. Panel Cointegration Tests
Once the presence of the unit root is detected in the variables, then it becomes necessary to check
for the presence of a co-integrating relationship among the variables. If the variables are of the
same order, and if there is a long run relationship between the variables, an estimation of such a
relationship will give errors which are stationary. To determine if such a long run relationship
exists among the variables, panel co-integration techniques generated by Pedroni (1999) are
employed. Pedroni developed seven different statistics to test for panel co-integration and they
are based on either a within-dimension or between-dimension statistics. Within-dimension based
statistics are referred as panel co-integration statistics, while between-dimension statistics are
termed as group-mean co-integration statistics. Pedroni extends the two step residual-based
strategy of Engle and Granger (1987) to develop the panel co-integration tests. These tests are
based on the null of no co-integration and work with the assumption of heterogeneous panels.
The major advantage of Pedroni test is that it allows for individual member-specific fixed
effects, deterministic trends and slope coefficients. The methodology involved in testing for
co-integration among a set of variables is discussed below with respect to the model used in this
study
it it i it i
it i it i it i
it
gdp
tr
lpc
wgr
opn
fdi
1ln
2ln
3 4ln
5ln
(1)The variables in (1) are integrated of the same order and are said to be co-integrated if the error
term ( it) is a stationary process. Hence testing for co-integration among variables requires that a
regression of the following form is performed on the residuals from (1)
it t
i i
it , 1 (2)
The null is i
= 1 implies that it has a unit root. Based on the estimation of (2), seven
different statistics are calculated. Panel-v, panel-rho, panel-PP and panel-ADF are based on the
within-dimension while, group-rho, group-PP and group-ADF are based on the
between-dimension of the panel. In the within-between-dimension framework, the null of no co-integration is given
as
Against, the alternative of H1: ρi=ρ<1 for all i. The alternative hypothesis implies that there is
co-integration among all the variables in the panel. On the other hand the null hypothesis pertaining
to between-dimension framework is defined as H0: ρi= 1 for all i against the alternative of H1: ρi<1 for at least one i. Thus, the between-dimension test is less restrictive and allows for heterogeneity across members. In case of within-dimension test a common value for all cross
section is imposed i.e. ρi=ρ
3.2.2. FMOLS Method
Once co-integration has been established among the relevant variables, the model is estimated
utilizing the FMOLS technique first proposed by Pedroni (1996, 2000). According to Pedroni
(2000), standard OLS estimation of a panel will lead to an asymptotically biased estimator
because the estimates would be dependent on the nuisance parameters that are associated with
the dynamics of the underlying system. He argues that only in case of exogeneity of the
regressors and homogenous dynamics across the individual members of the panel, the OLS
estimates are unbiased.
The FMOLS estimator accounts for both serial co-relation and endogeneity problems, and hence
is preferable to simple OLS estimation. One of the merits of using FMOLS techniques is that it
allows for the country-specific fixed effects to be heterogeneous while estimating long run
relationships (Pedroni, 2000). Pedroni (2000) argues that the t-statistic for group mean panel
FMOLS offers more flexible alternative hypothesis than pooled FMOLS because the former is
based on the between-dimension as opposite to within-dimension of the panel: Thus it estimates
the cointegrating vectors for a common value under the null hypothesis, while under the
alternative hypothesis the values for the cointegrating vector are allowed to vary across groups.
4. Empirical Results
This section presents the integration properties of the variables included in the model using
various panel unit root tests. The results were obtained by using LLC, IPS, Fisher-ADF and
PP-Fisher unit root tests. Tables 4.1 and 4.2 below respectively report panel unit root results in level
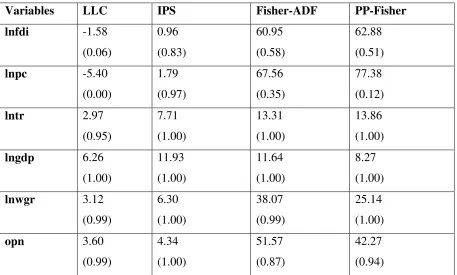
Table 4.1. Panel unit root results (level)
Variables LLC IPS Fisher-ADF PP-Fisher
lnfdi -1.58
(0.06) 0.96 (0.83) 60.95 (0.58) 62.88 (0.51)
lnpc -5.40
(0.00) 1.79 (0.97) 67.56 (0.35) 77.38 (0.12)
lntr 2.97
(0.95) 7.71 (1.00) 13.31 (1.00) 13.86 (1.00)
lngdp 6.26
(1.00) 11.93 (1.00) 11.64 (1.00) 8.27 (1.00)
lnwgr 3.12
(0.99) 6.30 (1.00) 38.07 (0.99) 25.14 (1.00)
opn 3.60
(0.99) 4.34 (1.00) 51.57 (0.87) 42.27 (0.94)
Note: The numbers in parenthesis are p –values and all the variable in the table are in natural log form expect ‘opn’ (openness).
As is clear from the Table 4.1, the LLC, IPS, Fisher-ADF and PP-Fisher test fail to reject the
null hypothesis that ‘fdi’ in level is non-stationary. Hence we test for stationarity of ‘lnfdi’ in
first difference. The results are reported in table 4.2 and it is clear that all the test results for fdi
indicate that in first difference it is stationary. This means that for all the countries under study,
the variable ‘fdi’ follows an I(1) process.
Next, we examine whether the explanatory variables included in the model such as lnpc, lntr,
lngdp, lnwgr and openness ‘opn’ are stationary. From table 4.1 all these variables are
non-stationary in levels as evident from the reported p-values. Therefore we test for non-stationary of
these variables at first difference. The results are presented in Table 4.2 given below. From the
p-values obtained by using various tests it is evident that they are all stationary at first difference.
This implies that all the variables included in this study are I(1) for all the countries under
consideration. Since all variables follow an I(1) process and therefore we suspect that there may
exist cointegration between them. To have an idea of cointegrating relationship among the
Table 4.2.: Panel unit root results (first difference)
Variables LLC IPS Fisher-ADF PP-Fisher
lnfdi -26.02
(0.00) -27.86 (0.00) 635.64 (0.00) 723.17 (0.00)
lnpc -18.57
(0.00) -16.34 (0.00) 373.04 (0.00) 408.48 (0.00)
lntr -16.64
(0.00) -18 (0.00) 406.61 (0.00) 485.21 (0.00)
lngdp -15.84
(0.00) -15.08 (0.00) 333.55 (0.00) 337.33 (0.00)
lnwgr -21.67
(0.00) -20.35 (0.00) 454.97 (0.00) 495.83 (0.00)
opn -20.3
(0.00) -19.6 (0.00) 435.88 (0.00) 462.48 (0.00)
Note the numbers in parenthesis are p –values and the entire variables in the table are in natural log form except
‘opn’.
To test for cointegration, we employ panel cointegration test proposed by Pedroni (1999).
Pedroni (1999, 2004) proposes two sets of tests for cointegration within-dimension and
between-dimension. The panel tests based on the within dimension approach includes four statistics (i.e.
panel cointegration statistics): panel v-statistics, panel rho-statistics, panel pp-statistics, and
panel ADF-statistics. These statistics essentially pool the autoregressive coefficients across
different countries for the unit root tests on the estimated residuals and take into account
common time factors and heterogeneity across countries.
The group statistics are based on between dimension approaches which include three statistics
(i.e. group mean panel cointegration statistics): group rho-statistics, group pp-statistics, and
group ADF-statistics. These statistics are based on averages of the individual autoregressive
coefficients associated with the unit root tests of the residuals for each country in the panel.
Of the seven tests, the panel v-statistic is one- sided test where large positive values reject the
null of no cointegration, whereas large negative values for the other test statistics reject the null
of no integration among variables. Table 4.3 below reports four of the Pedroni panel
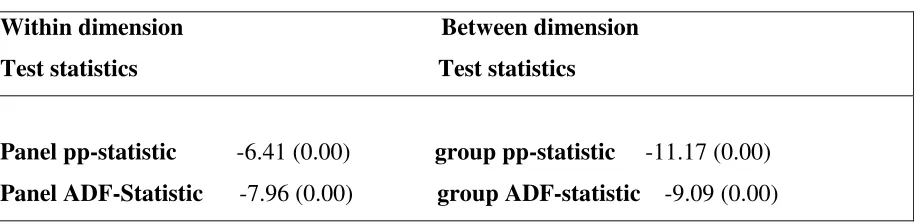
Table4.3. Panel cointegration test results
Within dimension Between dimension
Test statistics Test statistics
Panel pp-statistic -6.41 (0.00) group pp-statistic -11.17 (0.00)
Panel ADF-Statistic -7.96 (0.00) group ADF-statistic -9.09 (0.00)
Note: the numbers in parenthesis are p-values
From the above estimates, it is evident that the variables are cointegrated and there exists a long
run equilibrium relationship between them. After detecting the cointegration among the variables
the study proceeds to FMOLS results which have been displayed in Table 4.4.
To identify the determinants of foreign direct investment the study employs the group mean
panel FMOLS method developed by Pedroni (2000). The results are reported below in Table
4.4.The results support the theoretical prediction that the market size and quality of infrastructure
[image:15.612.72.529.87.199.2]determine the inflows of FDI to developing countries.
Table 4.4: Group Mean Panel FMOLS results
Variable Coefficient t-stat
lgdp 0.88 3.39***
ltr 0.45 6.18***
lpc 0.45 3.53***
lwgr -0.27 -3.84***
Note: ***denotes1% level of significance.
These results show that coefficients of lngdp, lntr, lnpc and lnwgr are highly significant. Except
openness coefficient (not reported in the above table), all other coefficients are statistically
significant at 1% level and given that the variables are expressed in natural logarithms the
coefficients can be interpreted as elasticities. The results signify that a 1% increase in GDP
increases FDI inflows by 0.88%; a 1% increase in total reserves causes FDI inflows to rise by
0.45%, and a 1% rise in energy usage boosts FDI inflows by 0.45%. Further, the results reveal
that a 1% rise in wages is associated with a decline of 0.27% in FDI inflows. The empirical
results depict that market size, total reserves, infrastructure and wage rate significantly determine
infrastructure are positively related to FDI inflows. And low wage rate seem to stimulate the FDI
inflows. The impact of total reserves on the inflow of FDI implies that accumulation of more
reserves by a country helps it to pull more FDI. It seems that more forex reserves amassed by a
country influences the investment decisions of MNCs and helps the host country to stimulate the
FDI.
The variable power consumption ‘lnpc’ which is used as a proxy for infrastructure is also one of
the main determinants of FDI as our study proves. This implies countries with better and
improved infrastructure facilities out-compete others in attracting the foreign investment. Good
and well developed infrastructure facilities increase the productivity of the investments and
therefore may stimulates FDI inflows into the country. Evidence of infrastructure being a
significant determinant of FDI has been reported by earlier studies like Wheeler and Moody
(1992), Kumar (1994) and Asidu (2002).
The impact of wage rate (lnwgr) which is used as a proxy for labour cost on inflows of foreign
capital is found to be negative and significant as expected. This implies that higher labour cost
would discourage inflows of FDI. In other words, countries with availability of cheap labour are
preferred FDI destinations. Earlier, empirical research has also found an inverse relation between
labour cost and FDI particularly for the foreign investment in labour intensive industries and for
export oriented subsidiaries. However when the labour cost is relatively insignificant (when
wages vary little from country to country), the skills of the labour force are expected to have an
influence on decisions about FDI location.
Interestingly, the study reveals that the variable openness is not significant which implies that
foreign investors did not place much importance to the economic openness of the host country
while deciding about the location of their projects in developing countries. This is contradictory
to some of the theories as well as to some empirical studies (Garibaldi et al 2001, Compos, et al.
2003) which show that openness of country does influence the FDI inflows. The reason why in
our study coefficient of openness turned out to be insignificant may be explained in terms of the
nature of FDI inflows into developing countries. The developing countries attract mostly market
seeking investments and when investments are market-seeking, trade restrictions (and therefore
less openness) can have a positive impact on FDI (Jordaan 2004). The reason stems from the
tariff jumping hypothesis, which argues that MNCs that seek to serve local markets may decide
contrast, MNCs engaged in export-oriented investments may prefer to invest in a more open
economy since increased imperfections that accompany trade protection generally imply higher
transaction costs associated with exporting. Therefore, it may be concluded that FDI inflows to
developing countries are primarily of market-seeking type or tariff- jumping type and hence least
affected by trade restrictions.
The empirical results reveal that the gross domestic product, total reserves, and infrastructure are
positively related to FDI inflows to developing countries. In other words FDI inflows to
developing countries are determined by the market size, total reserves and infrastructure
facilities. Further, the variable wage rate negatively affects the foreign investment inflows into
the developing countries. Also the openness of the economy does not influence the FDI inflows
to the developing countries.
5. Conclusion
This study makes an attempt to identify the factors determining overseas investment in
developing countries. The empirical results derived using the technique of FMOLS clearly
reveals that all the variables (except openness) have a strong bearing on the inflows of overseas
capital. There is strong empirical evidence of positive relation between FDI and the level of
GDP. It implies that the countries with large market size (higher GDP) are getting a large amount
of overseas investments. The result commensurate with the Dunning’s OLI Paradigm according
to which a great deal of market-seeking investment flows into the countries with large market
size. The impact of total reserves on the inflow of FDI implies that accumulation of more
reserves by a country helps it to pull more FDI. It seems that more reserves amassed by a country
influences the investment decisions of MNCs and helps the host country to stimulate the FDI.
The variable power consumption which is used as a proxy for infrastructure is also one of the
main determinants of FDI as revealed by the empirical results. This implies countries with better
and improved infrastructure facilities out-compete others in attracting the foreign investment.
Infrastructure facilities increase the productivity of the investments and therefore may stimulates
FDI inflows into the country. The impact of wage rate on inflows of foreign capital is found to
be negative and significant as expected. This implies that higher labour cost would discourage
destinations. Earlier, empirical research has also found an inverse relation between labour cost
and FDI particularly for the foreign investment in labour intensive industries and for export
oriented subsidiaries. Interestingly, the empirical results reveal that the variable openness
implying that foreign investors did not place much importance to the economic openness of the
host country while deciding about the location of their projects in developing countries. This is
contradictory to some of the theories as well as to some empirical studies (Garibaldi et al 2001,
Compos, et al. 2003) but matching with tariff jumping hypothesis, which argues that FDI to
developing countries is market-seeking type or tariff- jumping type and hence least affected by
trade restrictions.
The study proposes that in order to compete with other countries to attract more FDI, the country
should make the investment climate much better and conducive to foreign players. This requires
a critical examination of the firm-specific motivations that make them to indulge in FDI. The
study proposes that there is a need to increase the productive efficiency which is possible only if
the infrastructure bottlenecks are properly addressed and the wages and other relative costs are
kept low. The findings of the present study suggest that in order to attract more inflows of FDI
and to maximize the gains from it, the improvement in infrastructure, adequacy of foreign
exchange reserves and growth of GDP should be the key agenda of the foreign policy of
developing countries.
References
Agarwal, J.P. (1980), “Determinants of Foreign Direct Investment: A Survey”,
Weltwirtschaftliches archive, vol. 116, pp. 739-773.
Asiedu (2005) ,“Foreign Direct Investment In Africa: The Role Of Natural Resources, Market
Size, Government Policy, Institutions And Political Instability”, world institute for
development economics research, Research paper no. 2005/24, UNU-WIDER.
Azam, M. (2010), “Economic determinants of FDI in Armenia, Kyrgyz Republic and
Turkmenistan: Theory and Evidence.” Eurasian journal of business of economics,
vol.3, pp. 27-40.
Baltagi, H. (2005), “Econometric Analysis of Panel data.” John Wiley and Sons, New York.
Bhasin, N. (2008), “Foreign Investment in India from 1947-48 to 2007-08.” New Century
Publications New Delhi, India.
Buckley, P. J. and Casson, M. (1976), “The Future of Multinational Enterprise”, London:
MacMillan.
Caves, R.E. (1982), “Multinational Enterprise and Economic Analysis, New York: Cambridge
Chopra, C. (2004), “Foreign Investment in India, Liberalization and WTO: The Emerging
Scenario”, Deep and Deep Publications Private Ltd. New Delhi.
Dhakal, D. (2007),“Foreign Direct Investment and Transition Economies: Empirical Evidence
from Panel Data Estimator”, Economics Bulletin, vol. 6(33), pp 1-9.
Dunning, J.H. (1988), “The Eclectic Paradigm of International Production: A Restatement and
Some Possible Extensions”, Journal of International Business Studies, vol. 19, pp.
1-52.
Hymer, S. (1976), “The International Operations of Multinational Firms (1959): Ph.D. Thesis,
Cambridge, MA: MIT Press.
Im, K.S., Pesaran, M. and Shin, Y. (2003), “Testing for Unit Root in Heterogeneous Panels”,
Journal of Econometrics, vol. 115, pp.53-74.
Itaki, M. (1991), “A Critical Assessment of the Eclectic Theory of the Multinational
Enterprise”, Journal of International Business Economics, vol. 25, pp. 445-460.
Lall, S. and Streeten, P. (1980), “Foreign Investment Transnational’s and Developing
countries”, Macmillan Press Ltd. London.
Levin, A, C.F. Lin and C.J. Chu (2002), C.F. and Chu, C.J. (2002), “Unit Root Tests in Panel
Data: Asymptotic and Finite-Sample Properties”, Journal of Econometrics, vol. 108, pp. 1-24.
Moosa, I. A. (2002), “Foreign Direct Investment, Theory Evidence and Practice”, Palgrave Publishers Limited, New York.
Naeem, Ijaz and Azam, M. (2005), “Determinants of Foreign Direct Investment in Pakistan: An
Econometric Approach”, Sarhad J. Agric.vol. 21, pp. 761-764.
Nunnenkamp, P. and Julius, S. (2002), “Determinants of FDI in Developing Countries: Has
Globalization Changed the Rules of the Game?” Transactional Corporations, vol. 11.
Parry, T.G. (1985), “Internalization as a General Theory of Foreign Investment: A Critique”,
Weltwirtschaftliches Archive, vol. 121, pp.564-569.
Pedroni, P. (2000), “Fully Modified OLS for Heterogeneous Cointegrated Panels”, Advances in
Econometrics, vol.15, pp. 93-130.
Root, F. and Ahmad, A. (1979), “Empirical Determinants of Manufacturing Direct Investment
in Developing Countries”, Economic Development and Cultural Change, vol. 27, pp.
751-767.
Sahoo, P. (2006), “Foreign Direct Investment in South Asia: Policy, Trends, Impact and
Determinants”, ADB Institute Discussion Paper No. 56.
Shamusddin, A. (1994), “Economic Determinants of Foreign Direct Investment in Less
Developing Countries”, the Pakistan Development Review, vol. 33, pp. 41-51.
Tsai, P. (1994), “Determinants of Foreign Direct Investment and Its Impact on Economic
Growth”, Journal of Economic Development, vol. 19, pp. 137-163.
Usha, B. (2006), “Foreign Direct Investment in India: Contemporary Issues”, Deep and Deep
Publications Private Ltd. New Delhi, India.
Vijayakumar, N. (2010), “Determinants of FDI in BRICS Countries: A Panel Analysis”,
International Journal of Business Sciences and Applied Management, vol. 5.
Wheeler, D and Mody, A. (1992), “International Investment Location Decisions: The Case of
US Firms”, Journal of International Economics, vol. 33, pp.57-76.
Wooldridge, M. (1999), “Econometric Analysis of cross Section and Panel Data”, MIT Press,