m e t h o d s of a s s e s si n g v e r ti c al
ju m p fo r c e a s y m m e t r y a g r e e ?
L a k e , J, M u n dy, P, C o mf o r t , P a n d S u c h o m e l, T
h t t p :// dx. d oi.o r g / 1 0 . 1 0 8 0 / 1 4 7 6 3 1 4 1 . 2 0 1 8 . 1 4 6 5 1 1 6
T i t l e
D o t h e p e a k a n d m e a n fo r c e m e t h o d s of a s s e s si n g v e r ti c al
ju m p fo r c e a s y m m e t r y a g r e e ?
A u t h o r s
L a k e, J, M u n dy, P, C o mf o r t , P a n d S u c h o m e l, T
Typ e
Ar ticl e
U RL
T hi s v e r si o n is a v ail a bl e a t :
h t t p :// u sir. s alfo r d . a c . u k /i d/ e p ri n t/ 4 7 1 0 0 /
P u b l i s h e d D a t e
2 0 2 0
U S IR is a d i gi t al c oll e c ti o n of t h e r e s e a r c h o u t p u t of t h e U n iv e r si ty of S alfo r d .
W h e r e c o p y ri g h t p e r m i t s , f ull t e x t m a t e r i al h el d i n t h e r e p o si t o r y is m a d e
f r e ely a v ail a bl e o nli n e a n d c a n b e r e a d , d o w nl o a d e d a n d c o pi e d fo r n o
n-c o m m e r n-ci al p r iv a t e s t u d y o r r e s e a r n-c h p u r p o s e s . Pl e a s e n-c h e n-c k t h e m a n u s n-c ri p t
fo r a n y f u r t h e r c o p y ri g h t r e s t r i c ti o n s .
Title: Do the peak and mean force methods of assessing vertical jump force 1
asymmetry agree? 2
3
Preferred running title head: Vertical jump force asymmetry method agreement 4
5
Corresponding author: Jason P. Lake, Department of Sport and Exercise 6
Sciences, University of Chichester, College Lane, Chichester, West Sussex, PO19 7
6PE, UK, Tel: +44 1243 816294, Fax: +44 1243 816080, email: j.lake@chi.ac.uk. 8
9
Co-authors:
10
Peter D. Mundy, Department of Applied Sciences and Health, Coventry University, 11
Coventry, UK 12
Paul Comfort, Directorate of Sport, Exercise and Physiotherapy, University of 13
Salford, Salford, UK 14
Timothy J. Suchomel, Department of Human Movement Sciences, Carroll University, 15
Waukesha, WI, USA 16
17
Abstract
19
The aim of this study was to assess agreement between peak and mean force 20
methods of quantifying force asymmetry during the countermovement jump (CMJ). 21
Forty-five men performed four CMJ with each foot on one of two force plates recording 22
at 1000 Hz. Peak and mean were obtained from both sides during the braking and 23
propulsion phases. The dominant side was obtained for the braking and propulsion 24
phase as the side with the largest peak or mean force and agreement was assessed 25
using percentage agreement and the kappa coefficient. Braking phase peak and mean 26
force methods demonstrated a percentage agreement of 84% and a kappa value of 27
0.67 (95% confidence limits: 0.45 to 0.90), indicating substantial agreement. 28
Propulsion phase peak and mean force methods demonstrated a percentage 29
agreement of 87% and a kappa value of 0.72 (95% confidence limits: 0.51 to 0.93), 30
indicating substantial agreement. While agreement was substantial, side-to-side 31
differences were not reflected equally when peak and mean force methods of 32
assessing CMJ asymmetry were used. These methods should not be used 33
interchangeably, but rather a combined approach should be used where practitioners 34
consider both peak and mean force to obtain the fullest picture of athlete asymmetry. 35
36
Keywords: Countermovement jump, movement symmetry, kinetics, method 37
comparison 38
39
Introduction 41
The vertical jump provides practitioners with a way of assessing their athletes’ capacity 42
to accelerate their body mass within a relatively controllable methodological 43
framework (Aragon, 2000; Balsalobre-Fernandez, Glaister, & Lockey, 2015; Bosco, 44
Luhtanen, & Komi, 1983; Hatze, 1998; Impellizzeri, Rampinini, Maffiuletti, & Marcora, 45
2007; Mundy, Smith, Lauder, & Lake, 2017). Jumping on a force plate can provide 46
practitioners with information regarding the forces that accelerate their whole body 47
centre of gravity (CoG) and how long these forces are applied for (Hatze, 1998; Lake, 48
Mundy, & Comfort, 2014; Mundy et al., 2017; Street, McMillan, Board, Rasmussen, & 49
Heneghan, 2001). Multiplying the average force applied over the propulsion phase of 50
vertical jumping by the duration of this phase yields impulse, and, if determined 51
accurately, this impulse is proportional to take-off velocity (Hatze, 1998). This in turn 52
dictates jump height. However, the last decade has seen an increase in research 53
interest in using the vertical jump to assess lower-body asymmetry by studying the 54
distribution of forces between the left and right sides (Bailey, Sato, Burnett, & Stone, 55
2015; Bell, Sanfilippo, Binkley, & Heiderscheit, 2014; Impellizzeri et al., 2007; Jordan, 56
Aagaard, & Herzog, 2014; Newton et al., 2006; Patterson, Raschner, & Platzer, 2009). 57
58
The increased interest in assessing force distribution between the left and right sides 59
appears to be based on its potential to reflect previous injury, the positional demands 60
of sport, and leg length discrepancies (Newton et al., 2006). Further, force 61
asymmetries may lead to athletes routinely applying a larger mechanical demand to 62
the favoured side, which may increase the potential for injury, especially if the strength 63
and conditioning process is continued. Therefore, quantifying force asymmetry has 64
different ways of assessing force asymmetry and currently no data exist to inform 66
practitioners about whether the different methods agree. 67
68
A frequently used method of assessing force asymmetry is based upon performance 69
in a bilateral vertical jump, with each foot positioned on a separate force plate (Bailey 70
et al., 2015; Bell et al., 2014; Jordan et al., 2014; Newton et al., 2006; Patterson et al., 71
2009). Typically asymmetry is then quantified by identifying the side that applies the 72
largest peak (Bailey et al., 2015; Bell et al., 2014; Benjanuvatra, Lay, Alderson, & 73
Blanksby, 2013; Impellizzeri et al., 2007; Newton et al., 2006; Patterson et al., 2009) 74
or mean force (Benjanuvatra et al., 2013; Iwanska et al., 2016; Jordan et al., 2014; 75
Lawson, Stephens, Devoe, & Reiser, 2006; Newton et al., 2006) before either 76
categorising that as the dominant limb or by calculating some form of symmetry index 77
(Bishop, Read, Chavda, & Turner, 2016). However, there are no data to inform 78
practitioners about agreement between these two methods. Therefore, there is 79
currently a need to undertake research to assess whether the peak and mean force 80
methods agree. The results of this research would provide practitioners with important 81
information about whether these two methods can be used interchangeably. The aim 82
of this study was to assess the agreement between the peak and mean force methods 83
of quantifying force asymmetry during vertical jumping. It was hypothesised that the 84
peak and mean force methods of assessing asymmetry during vertical jumping would 85
agree. 86
87
Method 88
Participants
Forty-five men (age: 20.83 ± 0.84 years, body mass: 84.41 ± 6.87 kg, height: 1.80 ± 90
0.57 m) who regularly participated in a variety of university level sports (e.g. soccer, 91
rugby (both codes), basketball and volleyball), volunteered to participate in this study 92
and provided written informed consent. The study was approved in accordance with 93
the University of Chichester’s Ethical Policy Framework for research involving the use 94
of human participants. 95
96
Procedures
97
Before jump testing, participants performed a standardised dynamic warm-up. This 98
began with 5 minutes of easy stationary cycling, and was followed by 2-3 minutes of 99
upper- and lower-body dynamic stretching. Specifically, participants performed two 100
circuits of 10 repetitions each of ‘arm swings’, ‘lunge walk’, ‘walking knee lift’, and ‘heel 101
to toe lift’. Participants then performed four bilateral countermovement jumps (CMJ), 102
interspersed by 30 s of rest. They were instructed to perform a rapid 103
countermovement, to approximately quarter squat depth, following this with a rapid 104
propulsion phase with the intention of jumping as high as possible. Jump 105
performances were watched to ensure that participants kept their hands on their hips 106
throughout each jump. Each CMJ was performed on two parallel Kistler force 107
platforms (Type 9851B; Kistler Instruments Ltd., Hook, UK) embedded in the floor of 108
the laboratory, each sampling at 1000 Hz. The vertical component of the ground 109
reaction force (VGRF) from both force platforms were synchronously acquired in 110
VICON Nexus (Version 1.7.1; Vicon Motion Systems Ltd., Oxford, UK); left and right 111
side vertical forces were summed for the initial part of data analysis. 112
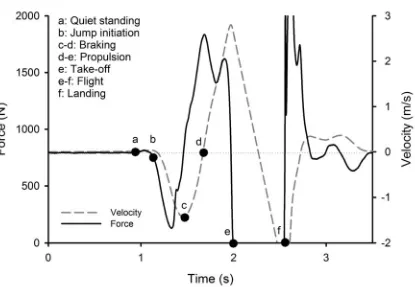
114
Figure 1. Identification of the braking and propulsion phases of countermovement 115
vertical jumping. 116
117
Data Analysis
118
The start point of the analysis of the force-time data was standardised by identifying 119
the start using the methods described by Owen, Watkins, Kilduff, Bevan, and Bennett 120
(2014). Briefly, body weight was obtained by averaging 1 s of force-time data as the 121
participants stood still while awaiting the word of command to jump (Figure 1, up to 122
‘a’). This was recorded during each trial and the participant was instructed to stand 123
perfectly still. The standard deviation (SD) of this force-time data during the ‘quiet 124
standing’ phase was also calculated and the first force value that was either less or 125
greater than 5 SD represented jump initiation (Figure 1, point ‘b’). The final part of this 126
[image:7.612.103.518.87.374.2]has been shown that this positions the start of force-time data integration at a point 128
when the participant is still motionless so that the assumption of zero velocity is not 129
compromised negatively impacting the calculation of subsequent kinetic and kinematic 130
data (Owen et al., 2014). Calculation of CoG velocity started from this point. First, body 131
weight (obtained from quiet standing) was subtracted from force, which was then 132
divided by body mass to provide CoG acceleration. Then CoG acceleration was then 133
integrated with respect to time using the trapezoid rule to provide CoG velocity. 134
The eccentric braking phase began one sample after the lowest countermovement 135
CoG velocity occurred (Figure 1, point ‘c’) and ended one sample after the first 136
occurrence of a CoG velocity of 0 m/s (Figure 1, point ‘d’) (McMahon, Jones, 137
Suchomel, Lake, & Comfort, 2017); one sample after this also marked the beginning 138
of the concentric propulsion phase, which ended at take-off (Figure 1, point ‘e’) 139
(McMahon et al., 2017). 140
Take-off was determined in three stages (see Figure 1). First, the first force value less 141
than 10 N (Figure 1, around point ‘e’) and the next force value greater than 10 N 142
(Figure 1, after point ‘e’) were identified; second, points 30 ms after and before these 143
points, respectively were identified to identify the centre ‘flight phase’ array; third, 144
mean and SD ‘flight phase’ force was calculated, and mean ‘flight phase’ force plus 5 145
SD was used to identify take-off. 146
147
Statistical Analysis
148
Asymmetry was quantified using two methods: peak and mean force. Left and right 149
side peak forces were identified as the highest forces applied by each side 150
respectively during the eccentric braking phase and the concentric propulsion phase 151
and right side force over the eccentric braking phase and concentric propulsion phase. 153
The dominant side was identified as the side with the largest peak and mean force 154
respectively on a phase-by-phase basis. To assess agreement between the peak and 155
mean force methods of assessing asymmetry, these data were first coded on a 156
participant-by-participant basis. Where the side that was favoured agreed across the 157
peak and mean force methods a ‘1’ was assigned; where they disagreed a ‘0’ was 158
assigned. The percentage agreement between the peak and mean force methods of 159
assessing asymmetry were calculated. However, a certain amount of this agreement 160
is likely to have occurred by chance. Therefore, the kappa coefficient, and its 95% 161
confidence limits, were then calculated in a spreadsheet using methods published in 162
the literature (Cohen, 1960; O'Donoghue, 2010; Viera & Garrett, 2005). The kappa 163
coefficient describes the proportion of agreement between the two methods after any 164
agreement by chance has been removed (Cohen, 1960). The agreement scale 165
presented by Viera and Garrett (2005), where kappa values of 0.01-0.20, 0.21-0.40, 166
0.41-0.60, 0.61-0.80, and 0.81-0.99 represented slight, fair, moderate, substantial, 167
and almost perfect agreement, respectively, was used to quantify agreement. Finally, 168
relative reliability of peak and mean force from the braking and propulsion phase was 169
assessed using intraclass correlation coefficients (two-way random effects model 170
(ICC)), while the absolute reliability was assessed using percentage coefficient of 171
variation (CV) (Banyard, Nosaka, & Haff, 2016). The magnitude of the ICC was 172
determined using the criteria set out by Cortina (1993), where r ≥ 0.80 is considered 173
highly reliable. The magnitude of the CV was determined using the criteria set out by 174
Banyard et al. (2016), where >10% is considered poor, 5-10% is considered moderate, 175
and <5% is considered good. 176
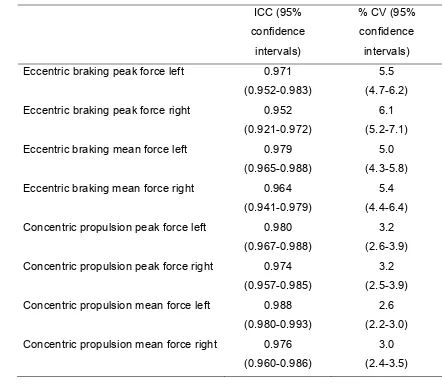
Results 178
Table 1 shows that the peak and mean forces applied during the braking and 179
propulsion phases demonstrated high relative reliability and good absolute reliability. 180
Regarding the agreement between the peak and mean force methods of assessing 181
asymmetry, during the eccentric braking phase the peak and mean force methods 182
demonstrated a percentage agreement of 84% and a kappa value of 0.67 (95% 183
confidence limits: 0.45 to 0.90), indicating substantial agreement. During the 184
concentric propulsion phase the peak and mean force methods demonstrated a 185
percentage agreement of 87% and a kappa value of 0.72 (95% confidence limits: 0.51 186
to 0.93), indicating substantial agreement. 187
188
189
190
191
192
193
194
195
196
197
198
199
200
201
[image:10.612.70.525.47.724.2]203
Table 1. Results of the within-session reliability analysis. 204
ICC (95% confidence
intervals)
% CV (95% confidence intervals) Eccentric braking peak force left 0.971
(0.952-0.983)
5.5 (4.7-6.2) Eccentric braking peak force right 0.952
(0.921-0.972)
6.1 (5.2-7.1) Eccentric braking mean force left 0.979
(0.965-0.988)
5.0 (4.3-5.8) Eccentric braking mean force right 0.964
(0.941-0.979)
5.4 (4.4-6.4) Concentric propulsion peak force left 0.980
(0.967-0.988)
3.2 (2.6-3.9) Concentric propulsion peak force right 0.974
(0.957-0.985)
3.2 (2.5-3.9) Concentric propulsion mean force left 0.988
(0.980-0.993)
2.6 (2.2-3.0) Concentric propulsion mean force right 0.976
(0.960-0.986)
3.0 (2.4-3.5)
205
206
Discussion and implications 207
The aim of this study was to assess the agreement between the peak and mean force 208
methods of quantifying force asymmetry during vertical jumping. It was hypothesised 209
that the peak and mean force methods of assessing force asymmetry during vertical 210
jumping would agree perfectly. The results of this study showed substantial agreement 211
However, while substantial agreement suggests a positive outcome, the hypothesis 213
must be rejected because these methods did not agree perfectly. 214
215
While the results of this study show that there was substantial agreement between the 216
peak and mean force methods of assessing force asymmetry during vertical jumping, 217
it is important to note that this means that 28-33% of the cases in the present study 218
did not agree. From an applied perspective, this means that if practitioners use these 219
methods interchangeably significant confusion could surround the assessment of 220
force asymmetry in around one third of their athletes. This could have serious 221
implications for the athlete physical preparation and rehabilitation process. Therefore, 222
we strongly recommend that these methods are not used interchangeably. Instead 223
practitioners should decide on which approach they use based on the relative merits 224
of each. 225
226
To the authors’ knowledge, none of the researchers that have used peak force to 227
quantify force asymmetry during vertical jumping have explained why they have done 228
so (Bailey et al., 2015; Bell et al., 2014; Benjanuvatra et al., 2013; Ceroni, Martin, 229
Delhumeau, & Farpour-Lambert, 2012; Hoffman, Ratamess, Klatt, Faigenbaum, & 230
Kang, 2007; Impellizzeri et al., 2007; Menzel et al., 2013; Newton et al., 2006; 231
Patterson et al., 2009; Suchomel, Sato, DeWeese, Ebben, & Stone, 2016). In the 232
present study, peak force represented the highest force recorded over one sample 233
during the phase of interest. It is important to note that because we used a sampling 234
frequency of 1000 Hz peak force represents the highest force applied over 1 ms. 235
Therefore, the practitioner should decide whether differences in the forces applied by 236
asymmetry. The literature awaits a rationale for the use of this approach. However, it 238
should be noted that the peak force method provides insight into the symmetry 239
strategy that an athlete uses to maximise their force application during CMJ. 240
241
In the present study mean force represented force averaged over the phase of 242
interest. It has been suggested that this sort of approach might provide a more robust 243
approach of assessing force asymmetry because it considers the entire phase of 244
interest (Flanagan & Salem, 2007). Therefore, it could be argued that the mean force 245
approach provides a more complete picture of force asymmetry. However, it should 246
also be reiterated that only one study has suggested averaging variable(s) of interest 247
over the phase(s) of interest (Flanagan & Salem, 2007). While the peak force 248
approach might misrepresent force asymmetry by not considering enough of the 249
phase of interest, it is entirely possible that the mean force approach could also 250
misrepresent force asymmetry because it cannot consider the magnitude of 251
differences across various sub-phases. Therefore, we recommend that practitioners 252
and researchers should use a combined approach, studying both peak and mean 253
force asymmetries over phases (and sub-phases) of interest. This will provide a far 254
fuller picture about athlete force asymmetries. 255
256
While the results of this study provide some important information regarding the issues 257
with agreement between the peak and mean force methods of assessing force 258
asymmetry during vertical jumping, it is not without its limitations. For example, while 259
both approaches are routinely used in the literature, force asymmetry cannot provide 260
a complete picture of lower-body asymmetry. Recent work has shown that additional 261
asymmetries (considering athlete strength [Bailey et al., 2015], and different 263
calculation methods [Bishop et al., 2016; Impellizzeri et al., 2007]). However, it should 264
also be noted that while additional methods have been employed there is still 265
considerable work to be done. For example, we currently know nothing about force 266
asymmetry driven changes in movement strategy and so this remains an important 267
area of research that must be undertaken, in addition to the methods mentioned 268
above, to obtain a thorough understanding of movement asymmetry. Finally, use of 269
the terms ‘dominant’ and ‘non-dominant’ merits discussion. In the present study 270
‘dominant’ was applied to the side that was able to apply the largest peak and mean 271
force. However, it should be noted that this term has also been used to describe the 272
side that research participants favour, whether during day-to-day tasks, sport, or 273
exercise, and that this does not always agree with the side that applies the largest 274
forces (Bishop et al., 2016). 275
276
Conclusion
277
In conclusion, side-to-side differences are not reflected equally when the peak and 278
mean force methods of assessing CMJ asymmetry are used. Therefore, the 279
hypothesis was rejected. These methods should not be used interchangeably. Instead 280
we recommend that practitioners use a combined approach, considering both peak 281
and mean force, depending on the performance characteristics of concern. This will 282
enable practitioners to more fully assess side-to-side difference in CMJ force-time 283
curves. 284
Figure and Table Captions 379
Figure 1. Identification of the braking and propulsion phases of countermovement 380
vertical jumping. 381