M E T H O D
Open Access
Computational discovery of regulatory elements
in a continuous expression space
Mathieu Lajoie
*, Olivier Gascuel, Vincent Lefort and Laurent Bréhélin
Abstract
Approaches for regulatory element discovery from gene expression data usually rely on clustering algorithms to partition the data into clusters of co-expressed genes. Gene regulatory sequences are then mined to find
overrepresented motifs in each cluster. However, this ad hoc partition rarely fits the biological reality. We propose a novel method called RED2 that avoids data clustering by estimating motif densities locally around each gene. We show that RED2detects numerous motifs not detected by clustering-based approaches, and that most of these correspond to characterized motifs. RED2can be accessed online through a user-friendly interface.
Keywords:motif discovery, gene regulation, co-expressed genes, clustering, k-nearest neighbors
Background
Gene expression is modulated depending on time, space and environmental conditions. This process involves many levels, including chromatin structure, transcrip-tion, transcript stability or localizatranscrip-tion, and translation. At most of these levels, regulation is achieved through the binding of regulatory proteins with specific short nucleic acid sequences called regulatory elements (REs). A notable exception is non-coding RNA mediated regu-lation [1].
Discovering REs (that is, their associated sequence motifs) from gene expression and sequence data can be done in several ways. One of the most common approaches is to use a clustering algorithm to partition the expression dataset, and to apply, on each cluster, one of the numerous algorithms that have been designed to find overrepresented motifs in a predefined set of sequences, such as MEME [2], AlignACE [3] or Weeder [4] (see Sandveet al.[5] for a comparison of their performance). There are two major limitations to this approach.
First, most of these algorithms rely on statistical mod-els of sequence background, which have been reported to produce many false positives [6,7], especially with repeat-rich and atypical genomes. For example, this is the case withPlasmodium falciparum- the main causal
agent of human malaria - whose A+T content reaches almost 90% in intergenic regions [8].
Second, clustering assumes that: (i) a natural partition of the genes in well-defined clusters exists and can be inferred from the data, and (ii) co-regulated gene sets are disjoint. In fact, determining the real number of clusters in a dataset is considered to be one of the hard-est classification problems, and has been the topic of numerous studies. Moreover, it is a well-known fact that different regulatory motifs can have overlapping gene sets [9,10]. These two points are illustrated in Figure 1 with theP. falciparumintraerythrocytic gene expression data of Bozdechet al.[11]. The periodic nature of this expression dataset allows projection on a two-dimensional space with minimal loss of variance using principal com-ponent analysis. The upper part of the figure represents the partitions obtained after performing k-means cluster-ing of the genes in the original space uscluster-ing different num-bers of clusters. We see that the clusters have similar shapes and sizes and that their edges arbitrarily change depending on the number of clusters. The resulting beach-ball-like partitions of the expression space suggest that there is no natural clustering in this dataset. In the bottom part of the figure, we show the regions of the expression space enriched for three regulatory motifs iden-tified in previous studies [6,7]. We see that the regions defined for the different motifs clearly overlap and do not correspond to the regions defined by any of the above clusterings.
* Correspondence: [email protected]
Méthodes et algorithmes pour la Bioinformatique, LIRMM, Univ. Montpellier 2, CNRS; 161 rue Ada, 34095 MONTPELLIER, France
Several methods that do not require a clustering have also been developed. For example, RankMotif++ [12] and DRIM [13] detect motif imbalance in ranked lists of genes obtained by ordering expression changes between two con-ditions. These methods have the advantage of not relying on a statistical model of background sequence, as they con-sider the motif distribution in the whole set of available sequences. However, although well suited for two-condition datasets, a single ordering can hardly reflect all the informa-tion contained in high-dimensional datasets, for example, those obtained by measuring expression in multiple condi-tions or at different time points, as routinely produced nowadays. Similarly, methods like REDUCE [14] and MatrixREDUCE [15] do not rely on clustering. They use linear regression to identify motifs that can be used to pre-dict expression levels, assuming that the latter are linearly correlated with the number of motif occurrences in each sequence. However, as noted in Elementoet al. [6], the validity of this assumption has not been widely explored, nor the behavior of such approaches in case of violation.
Finally, we mention the early work of Holmes and Bruno [16], which discovers the clustering and the motifs simulta-neously. Although this approach seems very appealing, it has not been tested on real datasets, probably because of its prohibitive running time [16].
[image:2.595.58.538.89.345.2]each cluster, while FIRE computes the mutual information between the presence/absence of a motif and the cluster membership of the corresponding sequences. These two methods can be seen as two extremes of a simple approach that assumes the RE distribution must show some kind of statistical dependency with the expression data. The hypergeometric approach is a local criterion, as it considers motif enrichment in a single co-expression cluster, while the mutual information approach is a global one, as it includes contributions from all clusters. Since they make few assumptions, these two methods can be applied to a wide range of expression data, and they are particularly useful when knowledge of the underlying reg-ulatory mechanisms is limited. FIRE and GEMS accurately predicted several of theP. falciparumApiAP2 binding sites (experimentally validated in [17,18]), and FIRE has recently been used to detect RNA recognition elements in
Saccharomyces cerevisiae[19].
In this work, we show how the hypergeometric distri-bution (local criterion) and the mutual information (glo-bal criterion) can be used without requiring any clustering, using the notion of motif density in the expression space. Rather than considering the number of genes that contain a motif in each co-expression clus-ter, we estimate motif densities locally around each gene by considering the proportion of neighboring genes (in the expression space) that contain the motif. The remainder of the paper is organized as follows. We first present the continuous versions of the hypergeometric and mutual information criteria, and the RED2 software that implements them. Second, we describe the output of RED2 and explain how the motif density can be used to assess the functionality of a particular motif occur-rence. Third, we compare the original and new versions of the two criteria on several expression datasets from yeast, and show that using the new versions usually results in a significant increase in the motif detection sensitivity. In addition, we perform a similar comparison with two well-established methods, FIRE and MatrixRE-DUCE, which demonstrates the broad utility of our approach. Finally, as a case study, we apply RED2 on
two P. falciparum datasets and discuss some findings
that can be deduced from the results.
Results and discussion
We are given a setGofngenes with two kinds of data. First, each gene is associated with a vector that describes its expression level at different time points or in a given set of conditions (that is, its expression profile). Second, each gene is associated with a nucleic acid sequence, which may correspond to its upstream, intronic or downstream region. In addition, we are given a function to compute the distance between the expression profile
of two genes - generally, this is the Euclidean or the Pearson correlation distance. As noted in the introduc-tion, the goal is to identify motifs whose presence or absence in the sequences shows statistical dependency with the expression data.
Broadly speaking, a motif m is a set of sequences defined over {A, C, G, T}. We say that a sequences con-tains a motif mif at least one substring ofsbelongs to
m. Two popular ways of representing motifs are the position weight matrices (PWMs) and consensus strings with degenerate symbols (IUPAC system) [5]. Here we use the IUPAC system, representing motifs with special characters encoding alternative nucleic acids; for exam-ple, the WAGACA motif corresponds to {AAGACA, TAGACA}. In theory, PWMs are more expressive than IUPAC strings, as they can represent more motifs and associate a score to each possible occurrence. However, PWMs require a score threshold to determine whether a particular sequence is a match or not, which may be hard to set. Moreover, they have been shown to perform similarly to IUPAC strings in a benchmark study [5], and, from a computational perspective, dealing with IUPAC strings is less demanding than PWMs.
Scoring functions
Here we describe the local and global criteria used by GEMS and FIRE, respectively, and show how they can be used without clustering, by computing motif density locally around each gene in the expression space. Namely, given a gene g Î Gand a motif m, the motif density aroundg is simply the proportion of genes that possess m among the neighbors of g. This involves defining a neighborhood for each gene in the expression space. We could use thek-nearest neighbors of the gene according to the chosen distance function (Euclidean or Pearson), but we will see that using this neighborhood may reduce the sensitivity of the approach because of the hubness phenomenon [20]. Therefore, after present-ing the two criteria, we propose an alternative solution to define the neighborhood.
Local criterion
P(X≥nmc) =
min(nc,nm)
j=nmc
nm
j
n−nm
nc−j
n nc
,
wherenmis the total number of genes with motifmin
G. For a given clusteringX, the motif enrichment score ofmis defined in GEMS as:
s(m,C) = max
c∈C(−logP(X≥nmc)). (1)
This is a local criterion because the score of the motif is given by the single cluster where the enrichment is the most significant.
A straightforward way of modifying this function for non-clustered data is to take each gene g ÎG in turn, and to consider the number of positive genes (that is, which have the motif) in its neighborhood. Let nmkg
denote the number of positive genes among thek neigh-bors ofg. This leads to:
s(m,G) = max
c∈G(−logP(X≥nmkg)). (2)
A major difference between Equations (1) and (2) is that the latter considers different sets of overlapping genes, which is biologically more sound than consider-ing a sconsider-ingle partition when seekconsider-ing multiple sets of co-regulated genes. However, an obvious issue with Equa-tion (2) is the multiplicaEqua-tion of tests required for each motif. We will see that this is not a problem in practice because this quantity is not utilized as a P value but rather as a score function, which is used to compute a false discovery rate.
Global criterion
The FIRE algorithm expresses the dependency between a motif m and the co-expression clusters in terms of mutual information. Assume that we randomly pick a geneg ÎGand letCbe a random variable whose out-come is the cluster membership ofg. Similarly, letM be a random variable whose outcome is 1 ifghas motifm, and 0 otherwise. The mutual information betweenM
andCis defined in FIRE as:
I(M;C) =
M,C
P(M,C) log P(M,C)
P(M)P(C), (3)
with P(C) = nc/n. Moreover, P(M) and P(M,C) are written as:
P(M) = ⎧ ⎨ ⎩
nm
n , ifM= 1 1−nm
n , ifM= 0
and
P(M,C) = ⎧ ⎨ ⎩
nm,c
n , ifM= 1 1− nm,c
n , ifM= 0 .
To get rid of the clustering, let us consider the prob-ability density function over the space of the gene expression profiles. The gene expression profiles are assumed to be sampled from this density. The mutual information between the presence/absence of a motifm
and a gene expression profileX is equal to:
I(M;X) =
X
M
P(M,X) log P(M,X) P(M)P(X)dX
=
X
P(X)
M
P(M|X) logP(M|X) P(M)
dX.
This expression can be interpreted as the expected value of the function:
f(X) =
M
P(M|X) logP(M|X) P(M)
with respect to the profile density function. Hence,
I(M;X) can be estimated from the average:
1 n
g∈G
M
P(M|Xg) log
P(M|Xg)
P(M) , (4)
whereXgis the expression profile of geneg. Probabil-ity P(M | Xg) is estimated using the motif density around g, that is, the proportion of positive genes among thekneighbors ofg:
P(M|Xg) =
⎧ ⎨ ⎩
nmkg
n , ifM= 1 1− nmkg
k , ifM= 0 .
Neighborhood definition
In the above formulae (Equations (2) and (4)), we use the number of genes that contain the motif among thek
neighbors of each gene. A natural solution to define this neighborhood is to consider the k-nearest neighbors (kNN) of the gene. However, a major drawback of this approach stems from the hubness phenomenon [20], which occurs in high-dimensional space. This phenom-enon can be described as the tendency for a few points (genes) to appear in an excessive number of neighbor-hoods, while many other genes appear in zero or few neighborhoods. If we encode the kNN relationships into a directed graph by putting an arc from node (gene) g
observe that the indegree distribution of this graph -that is, the number of arcs ending on a node - is strongly skewed to the left. This is exemplified in the left panel of Figure 2, which is obtained with the Gasch
et al.[21] dataset, a compendium of yeast transcriptomic measurements in a variety of stress conditions (see experiments below). Such a neighborhood biases our overall density estimation, since it gives more weight to the most popular neighbors, while discarding the infor-mation provided by the least popular ones. Radovanović
et al.[20] showed that this phenomenon can affect both
supervised (for example, kNN predictor) and unsuper-vised (for example, k-means) classification algorithms that use neighborhoods. In our case, the effect is particu-larly important, as it can prevent the discovery of motifs associated with genes that do not belong to the hubs. To circumvent this problem, we have designed a procedure that starts from the kNN graph described above. In this graph, the neighborhood of a geneginvolves all genesg’
such that there is an arcg®g’. First, the neighborhood relations are symmetrized: if there is an arcg® g’and no arcg’®g, the latter is added to the graph. In this way, each gene is in the neighborhood of at leastkother genes. We then use this symmetrized graph to construct a second graph in the following way. For each gene, we selectkneighbors by randomly sampling without repla-cement among its neighborhood, using a probability dis-tribution inversely proportional to the number of neighborhoods in which the neighbors appear (see Mate-rial and methods for details). Hence, genes that are in many neighborhoods have less chance of appearing in each of these neighborhoods. As we observe in the right
panel of Figure 2, this strategy reduces the asymmetry of the in-degree distribution of the neighborhood graph. It would likely be possible to define other procedures to achieve this goal, but, as we will see in the experiments, this one effectively increases the sensitivity of our motif detection approach.
The RED2software
The new versions of the scoring functions have been implemented (C++) in software called RED2(for regula-tory element discovery from raw expression data). RED2 takes as input a set of expression profiles and their asso-ciated DNA sequences, and outputs a set of IUPAC motifs with various statistics, such as their distribution in the expression space and in the input sequences. To make the analyses easier, the promoter sequences of sev-eral model organisms are pre-loaded on the web server. Like many methods for motif discovery, RED2starts by computing the score of every possible q-mer (q= 7 by default) and then proceeds with a local optimization of the highest scoringq-mers (called the seeds), transform-ing them into richer and better scortransform-ing motifs. When all seeds have been optimized, a filtering step removes the redundancy in the set of inferred motifs. We describe the RED2implementation and output below.
Seed identification step
[image:5.595.60.540.494.702.2]To assess the significance of a seed score while taking into account multiple testing, we estimate the propor-tion of false positives (false discovery rate, FDR) for dif-ferent score thresholds. For this reason, we rankq-mers according to their score and compare the resulting list with the expected score distribution under hypothesis
H0 that there is no dependency between q-mers and expression profiles. This distribution is estimated by randomly shuffling the mapping between the nucleic acid sequences and the expression profiles, and re-evalu-ating allq-mer scores several times (ten by default). The FDR associated with an observed score s is estimated with the formula:
FDR =Expected number ofq- mers with a score ≥ sunderH0 Number ofq- mers with a score ≥ sin original data . (5)
q-mers with a score associated with an FDR below a given threshold (0.001 by default) are then considered for optimization. Note that the above formula may some-times give FDR > 1. In this case the FDR is assumed to be 1 for the considered score.
Optimization step
Each seed is iteratively refined in a greedy way until its score reaches a local maximum. At each iteration, we eval-uate the score of all solutions (motifs) obtained by repla-cing any non-degenerate position of the current solution by any IUPAC symbol generalizing the nucleotide at this position, and the best scoring solution is selected for the next iteration. For example, the motif WAGACA will lead to the set {WWGACA, WHGACA, ..., WARACA, ...}, where W = {A, T}, H = {A, T, C} and R = {A, G}.
A critical point when generalizing the seeds is to avoid constructing a motif whose sequence description looks similar to that of the seed, but which is present in genes associated with very different expression profiles. To pre-vent such incoherent motifs, RED2considers a motifm
that generalizes a seedsas a potential solution only if the genes covered bymare close to those covered bysin the expression space. For this reason, RED2uses the density profiles of the motifs, that is, the vector of lengthnthat describes the density of the motif around each gene inG. Recall that the density ofmaround a genegis the propor-tion of genes with the motif in the neighborhood ofg, that isnmkg/k. Then,mis considered as a potential
optimiza-tion ofsonly if the Pearson correlation between the den-sity profiles ofmandsis above a fixed thresholda(a= 0.75 by default). This point is illustrated in Figure 3, which compares the density profiles of two pairs of close 6-mers inP. falciparumusing the Bozdech dataset (see the appli-cation toP. falciparumbelow). The 6-mers of the first pair have similar density profiles, suggesting that they are part of the same regulatory motif. In contrast, the 6-mers of the second pair have quite different profiles, suggesting that they are bound by different regulatory proteins.
When this first optimization step has reached a local maximum, RED2 tries to elongate each motif with a similar procedure. In this second step, solutions are obtained by adding any IUPAC symbol to one of the motif extremities. The parameterais not used here, as
this step can only decrease the set of sequences inm. The maximum motif length is set at nine by default, but it can be increased up to 15.
Filtering step
Several seeds may be associated with the same biological motif, and the optimization step usually leads to a highly redundant set of motifs. To retain the best variant of each motif, RED2 compares them in two ways. First, it computes the overlap between each pair of motifs. The overlap is defined as the maximum number of positions that can be aligned without internal gaps or mismatches (two IUPAC symbols match if their intersection is non-empty). For example, the overlap between WAGACA and TATAGA is four, corresponding to the alignment:
− −W A G A C A T A T A G A− −
By default, RED2 considers that two motifs may be redundant if their overlap is at least four. However, as discussed above, similar motifs (at the sequence level) may be associated with different locations in the expres-sion space, and hence correspond to different transcrip-tion factors. Therefore, to be considered redundant, the Pearson correlation between their density profiles must also be above a fixed thresholdg(g= 0.75 by default).
The filtering step proceeds as follows. All optimized seeds are sorted according to their score and the best scoring one is put in the (empty) set of filtered motifs. Then the remaining ones are considered sequentially and added to the set of filtered motifs if they are not redundant with respect to that set.
RED2output and functionality of motif occurrences
motif (Figure 4(c)) is overrepresented in genes that have quite opposite profiles.
For each motif, RED2 uses a sign test to assess a potential strand bias (that is, if the motif occurs prefer-entially on the forward or reverse strand), and provides a gene ontology (GO) enrichment analysis of the genes possessing the motif. Moreover, it outputs the position and context (10 bp on each side) of all occurrences, and
[image:7.595.59.540.89.231.2]the list of genes that possess the motif, sorted by motif density (z-score). This sorted list is of high practical interest, because the motif density around a gene where a particular occurrence is found can be a good indicator of that occurrence’s functionality. The rationale is that a motif occurrence is more likely to be functional in a gene that is in a region of the expression space where many genes also possess the motif. This is illustrated in
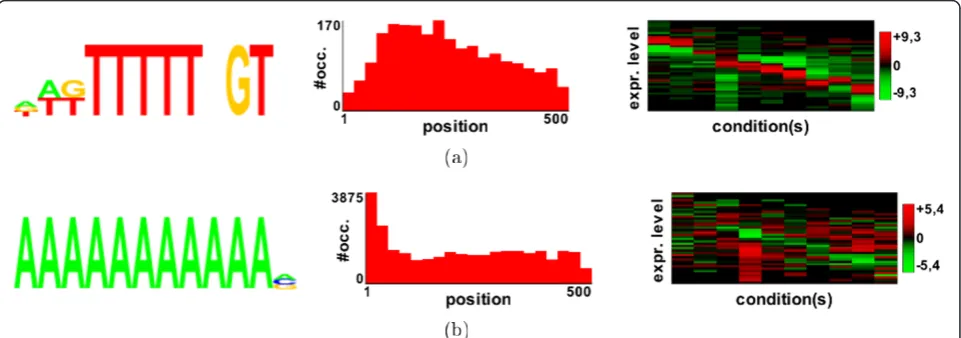
[image:7.595.59.539.425.681.2]Figure 4The three highest scoring motifs found in the Bozdech analysis[11]. (Left) Motif logos. (Middle) Distance distributions according to the start codon. (Right) Profile heatmaps. The x-axis of this map represents the different conditions in the expression dataset, while the y-axis represents the expression level. The y-axis is divided into 25 bins, and the colors of the map indicate the motif density (expressed as a z-score) in each of these bins (red: high density; green: low density).
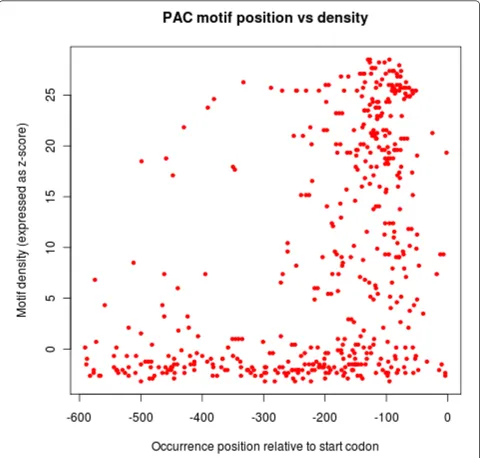
Figure 5 with the PAC/TOD6 motif, whose functionality is highly constrained by its position in theS. cerevisiae
promoter sequences [22]. In this figure, the position of all PAC motif occurrences are plotted against their local density with respect to the Gaschet al.dataset (see the experiments below). We can see a strong positional bias for occurrences in high motif density regions, while occurrences in low density regions are more uniformly distributed. Similar results are obtained with the SFP1 and RPN4 motifs.
This discriminative feature can be used to refine the selection of genes that are likely regulated by a given motif. To account for the prior probability of each motif, and to better distinguish between high and low density values, RED2actually expresses the densities as a z-score, which is the difference between the fraction of genes that possess the motifs and the expected value under the null hypothesis, in terms of the standard deviation (see Formula 6 in Material and methods). Thus, positive z-scores indicate genes in regions of the
expression space where the proportion of genes that have the motif is higher than expected, while negative z-scores indicate lower than expected proportions.
Assessment for yeast
We assessed our approach on yeast, which is likely the best known eukaryote for transcriptional regulation. We used 24 expression datasets: 22 datasets from the Gasch
et al. [21] compendium, the complete compendium
itself and the Spellman et al.[23] dataset (see Material and methods). The 600 bp upstream of each gene was used in these experiments.
Hubness phenomenon
First, we assessed the effect of the hubness phenomenon on the new version of the scoring functions. We men-tioned previously that thek-nearest neighborhood is sub-ject to this phenomenon, and we proposed an alternative neighborhood based on the symmetrick-nearest neighbors. To measure how this affects the performance of our approach, we compared the number of 7-mers detected at different FDR thresholds using both types of neighborhood. Figure 6 shows the results obtained with a neighborhood of size 200 on the Gaschet al.dataset [21] (complete com-pendium). As we can see in this figure, the hubness phe-nomenon can have a huge effect, especially for the mutual information scoring function, and a proper definition of the gene neighborhood is crucial to achieving good results.
Seed identification
We compared the original and continuous versions of the scoring functions on the 24 yeast expression datasets.
The clustering used for the original scoring functions was obtained with the k-means algorithm of the R project [24]. For each dataset, we tried several cluster numbers: 5, 10, 20, 40 and 80. For each number, the k-means algo-rithm was run 100 times and the best clustering (accord-ing to the k-means criterion) was retained for the experiments below. For the continuous version of the scoring functions (Equations (2) and (4)), we always used a neighborhood of size 200. Both the clustering and the neighborhood definition were performed using the Eucli-dean distance between the expression profiles.
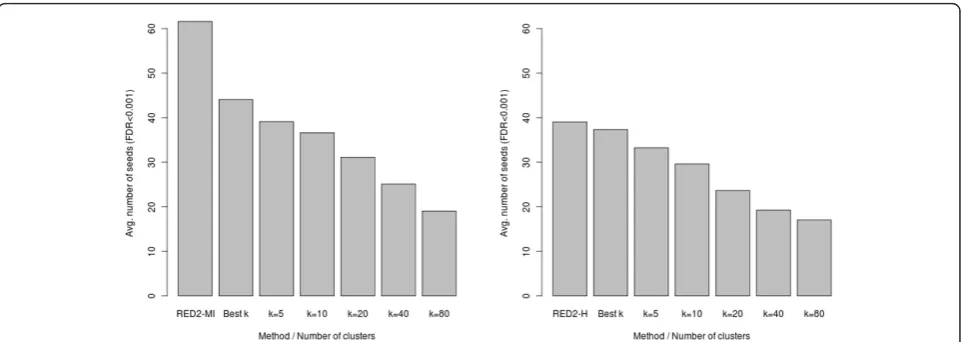
To focus on the scoring functions and limit the impact of the optimization parameters, we first compared the number of seeds (7-mers) detected at a given FDR threshold by each scoring function. Figure 7 shows the results achieved for different number of clusters (k), using an FDR cutoff of 0.001. For comparison, we also include the number of seeds obtained by selectinga
pos-teriorithe number of clusters that yields the highest
number of significant seeds for each dataset (the bestk
[image:9.595.61.538.461.692.2]column). Note that this selection procedure (hereafter denoted as the bestkprocedure) gives a clear advantage to the original functions, since we did not allow sucha posterioriselection of the parameters for our new scoring functions. Despite that, we observe that the new func-tions detect more seeds (at the same FDR) than the origi-nal ones, especially for the mutual information criterion. This shows the higher sensitivity of our approach. We also observe that the number of seeds identified by the original scoring functions strongly depends on the
number of clustersk, with fewer significant seeds for the highestkvalues.
Quality of predicted motifs
We considered the motifs we obtained from the seeds after applying the optimization and filtering procedure described above. To evaluate the quality of these motifs, we systema-tically compared them to known motifs from three curated databases: JASPAR (177 motifs) [25], the collection of Gordânet al.(189 motifs) [26] and ScerTF (196 motifs) [27]. To determine if a predicted motif matches a known motif, we used an approach similar to that of the Tomtom algorithm [28]. Briefly, given two aligned motifs, a similar-ity score is computed by summing (over each aligned posi-tion) the Pearson correlation coefficient between the weights of the corresponding columns in the PWMs of the corresponding motifs. For our predicted motifs,‘A’is con-verted to [1,0,0,0],‘W’to [0.5,0.5,0,0], etc. Using a shuffling procedure that exchanges the PWM columns of the curated database, we then estimate thePvalue of obtaining an alignment of equal or higher score by chance. The best match of a predicted motif is the motif from the database that gives the highest scoring alignment, and hence the lowestPvalue.
To allow a fair comparison between different motif dis-covery methods, we cannot strictly consider the number of predicted motifs that have a match under a given P
value, since a method which simply enumerates all the motifs would then achieve the best possible results. Hence, for each method, we took the number of predicted motifs into account and determined how many matches are sig-nificant at a global FDR threshold of 15%, using the proce-dure of Benjamini and Hochberg [29]. This way, each prediction has an underlying cost, and the exhaustive
enumeration method or a random predictor would get no significant match.
Another important issue that must be considered is the redundancy among the predictions, since a method which predicts (correctly) multiple variants of the same motif would get an unfair advantage over the other ones. Hence, when the best matches of two or more motifs correspond to the same motif in the database, only one match is consid-ered (that is, the other motif is considconsid-ered as having no match).
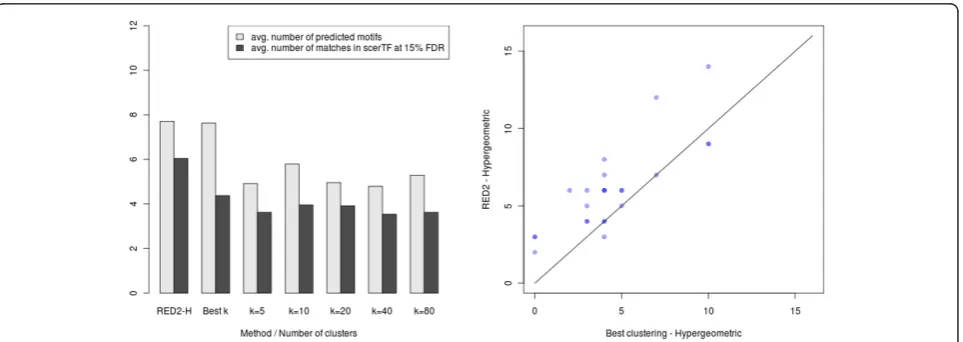
In Figure 8 and Figure 9, we present the results obtained with ScerTF, which is the most recent and most complete database ofS. cerevisiaemotifs to date. Results obtained with the two other databases support the same conclu-sions and are available in Additional file 1. The left panel of these figures presents the average results for the 24 yeast datasets. Each column has two bars: the average number of predicted motifs and the average number of matches at 15% FDR. As we did for the seeds, we also included the results obtained by selectinga posteriorithe number of clusterskthat gives the highest number of motifs for each dataset (the bestkprocedure). On average, the continuous versions of the scoring functions substan-tially predict more motifs than the discrete versions for any numberkof clusters. More importantly, the continu-ous versions also have more matches in ScerTF than the discrete versions, at 15% FDR. To determine the signifi-cance of the observed gain, we performed a sign test between the number of matches obtained by RED2
[image:10.595.58.540.88.259.2]and the best kprocedure for the 24 datasets (see the right panel of Figure 8 and Figure 9). ThePvalues of these tests are 0.0004 for the mutual information and 0.003 for the hypergeometric distribution, in favor of RED2.
When comparing Figure 7 with Figure 8 and Figure 9, we observe that detecting more seeds does not necessarily lead to more motifs and more significant matches. For example, the highest average number of seeds were obtained with thek= 5 clusters for both scoring functions,
[image:11.595.58.541.88.259.2]while the highest average number of predicted motifs and matches at 15% FDR were obtained withk= 10 ork= 20. This indicates that the number of detected seeds alone cannot be used as a reliable measure of performance for comparing different motif discovery approaches.
Figure 8Average number of motifs and matches at 15% FDR recovered by the continuous and discrete mutual-information scoring functions. The same optimization and filtering procedure was applied on both versions (seed FDR < 0.001,a= 0.75,g= 0.75). (Left) Average results for the 24 yeast datasets. The leftmost column shows the results obtained by the continuous version of the scoring function
implemented in RED2. The‘k=i’columns show the results obtained by the discrete version andiclusters. The‘bestk’column shows the results obtained when the number of clusters that yields the highest number of motifs is selecteda posteriorifor each dataset. (Right) Number of predicted motifs that match a known motif in the ScerTF database for the 24 yeast datasets (FDR < 15%). Each point corresponds to one of the 24 datasets. The y-axis corresponds to the number achieved by RED2and the x-axis to the number achieved by the discrete version and the
bestkprocedure. Superimposed points are indicated by shading. RED2found more motifs than the best clustering for 18 datasets and fewer for
two datasets, which gives a sign testPvalue of 0.0004.
[image:11.595.59.541.462.633.2]Comparison with FIRE and MatrixREDUCE
We performed a similar analysis to compare RED2(with the mutual information scoring function) to the well-established FIRE and MatrixREDUCE software on the same 24 datasets. Both methods were run with default parameters. For FIRE, this corresponds to a seed length of 7 bp and a maximal motif length of 9 bp, as for RED2, and we used the best k procedure described above. MatrixREDUCE does not allow seed elongation as in RED2or FIRE, so we performed an optimization of all seeds of length 7, 8 and 9 bp. In both cases, we per-formed a double strand analysis (that is, without strand distinction). Results are presented in Figure 10. First, we observe (left panel) that RED2 predicts substantially more motifs, on average, than the two other methods. Second, we observe that the number of predictions that match a known motif in ScerTF at 15% FDR is signifi-cantly higher for RED2 (7.75) than for FIRE (5.21) and MatrixREDUCE (3.75). This represents a 49% increase over FIRE, and a 206% increase over MatrixREDUCE. A sign test performed on the number of matches obtained for each of the 24 datasets (right panels) givesP values of 0.0003 and 4.77 × 10⁻⁷, for RED2 against FIRE and MatrixREDUCE, respectively.
Note that the results of the above comparison should be interpreted with caution, since the three methods use dif-ferent procedures to optimize the motifs, filter the output and even control the number of seeds that are optimized. For example, FIRE uses conditional mutual information to optimize each motif with regard to the already optimized motifs, while RED2 independently optimizes each motif. For MatrixREDUCE, the differences are even greater since it is based on a linear regression model that takes the number of motif occurrences in each sequence into
account, while RED2and FIRE consider only the absence or presence of a motif in each sequence. Thus, it is not possible to state objectively the proportions of the observed differences between the output of these pro-grams, which are due to the scoring functions, the cluster-ing step (for FIRE) or the optimization procedures and parameters. Nevertheless, this comparison may be of inter-est to users who are primary concerned with the number and quality of the predicted motifs.
The motifs predicted by RED2 on the Gasch et al.
(complete compendium) and the Spellman et al. data-sets with both scoring functions are provided in Addi-tional files 2 to 5. For comparison, we also provide the list of motifs predicted by FIRE and MatrixREDUCE on the Spellmanet al. dataset in Additional files 6 and 7. For each motif, these files give the most significant match in the ScerTF database (if any at 15% FDR) and the most overrepresented GO term for the genes that possess the motif.
Orphan motifs
All considered methods predicted some motifs that do not match any known motif according to our statistical criteria. These absences should be interpreted with cau-tion, because determining whether a particular motif matches another motif is prone to error [28], and often relies on arbitrary thresholds or criteria. Moreover, a high similarity between two motifs does not always translate into a significant match (and vice versa), espe-cially when the motifs are short and the query database contains many of them. In many cases, careful inspec-tion suggests that these orphan motifs are sub-optimal variants of known motifs.
[image:12.595.66.540.514.631.2]For example, this is clearly the case with motif HVGGDGGCR, obtained with the mutual information
Figure 10Number of predicted motifs and number of matches in ScerTF at 15% FDR, for RED2(mutual-information scoring function; same as Figure 8), FIRE and MatrixREDUCE. FIRE was run with default parameters (optimized for yeast), withk= 5, 10, 20, 40 and 80 clusters, and the number of clusters that yields the highest number of motifs was selecteda posteriorifor each dataset. MatrixREDUCE was run with default parameters, with seeds of length 7, 8 and 9. (Left) Average results of the three methods on the 24 yeast datasets. (Center) RED2and FIRE. Number of predicted motifs that match a known motif at 15% FDR in the ScerTF database for the 24 yeast datasets. The y-axis corresponds to the number achieved by RED2and the x-axis to the number achieved by FIRE with the best clustering procedure. Superimposed points are indicated by shading. RED2has more matches than FIRE in 21 datasets and fewer in three datasets, which gives a sign testPvalue of 0.0003. (Right) RED2and MatrixREDUCE (same explanations as for the center panel). RED2has more matches than MatrixREDUCE for 22 datasets and is
scoring function on the Spellmanet al.dataset (motif #7 in Additional file 4). This motif roughly corresponds to a 3 bp shift of the motif GKGGCRAMW (motif #8), which significantly matches the RPN4 motif. In other cases, additional experiments are needed to determine if they are new biological motifs or simply false positives. For example, motif CCCTTTWHH (motif #6) does not cor-respond to any motif from the three considered data-bases. However, other information suggests that this motif may not be a false positive. First, it is strongly con-served inS. bayanusorthologous genes [30]. Second, the set of genes containing this motif is enriched with the lipid modification annotation in the gene ontology (P< 1.49 × 10⁻², Bonferonni corrected).
Complementarity of the methods
It is worth noting that the different methods usually pre-dicted complementary sets of motifs. For example, on the Spellmanet al.dataset, the mutual-information and the hypergeometric scoring functions each recovered nine motifs from the ScerTF database at 15% FDR (Additional files 4 and 5). However, only four motifs are recovered by both methods (MBP1, TOD6, SFP1 and RPN4). The hypergeometric scoring functions uniquely finds GIS1, GCN4, PHO4, REI1 and STE12, while the mutual infor-mation uniquely finds YDR026C, RAP1, MSN2, SPT15 and NDT80 (note however that the GIS1 and MSN2 motifs are very similar). On the same dataset, FIRE and MatrixREDUCE find five and eight motifs at 15% FDR, respectively (Additional files 6 and 7). Among them, one (GIS1) and four (STB1, FKH1, RTG3 and STE12) are not recovered by RED2 (mutual information), respectively. Importantly, the complementarity of the methods is not restricted to individual datasets.
Table 1 shows, for each pair of methods (m1,m2), the number of ScerTF motifs that are recovered in at least one of the 24 datasets bym1, but never bym2. For example, among the 37 motifs recovered by RED2and the hyper-geometric scoring function, 13 are not recovered by FIRE.
We observe, for every pair of methods, that the number of uniquely identified motifs is an important fraction of the total number of recovered motifs. As expected, RED2 with the mutual-information criterion uniquely identifies the highest number of motifs. However, FIRE also identi-fies several motifs that are not recovered by the other approaches (among 39 recovered motifs, 15 are not recov-ered by RED2with mutual information, and 28 are not recovered by MatrixREDUCE). Moreover, although MatrixREDUCE recovers substantially less motifs (20) than the other approaches, the recovered motifs are often unique to this approach. A careful inspection suggests that these motifs often belong to a small set of genes that do not have correlated expression profiles but are over- or under-expressed in one or a few particular experiments. We provide in Additional file 8 the number of datasets in
which each ScerTF motif was recovered at 15% FDR (only the motifs recovered by at least one method are shown).
In the experiments above, we considered the number of predictions that match a known motif for a given glo-bal FDR. Since this approach takes the number of pre-dictions into account, it is essential to have a nearly complete collection of known motifs. Otherwise, the FDR would be overestimated and many good predictions would have no significant match. In consequence, we restricted our benchmark analysis to yeast, which is the only eukaryote for which such collections exist. Never-theless, we also applied RED2 to several apicomplexan parasites (see the application toP. falciparumbelow), as well as to human and Arabidopsis thaliana. For this lat-ter, RED2 has been successfully used to detect DNA motifs involved in transcriptional regulation following phosphate starvation and specific drug treatment [31].
Application to P. falciparum
P. falciparum, the main causal agent of human malaria,
kills nearly 800,000 people yearly in the 106 malaria-ende-mic countries [32]. Its genome is very atypical: around 60% of the approximately 5,500 predicted genes have insufficient similarity to characterized genes in other spe-cies to justify functional assignment [33]. The way the parasite controls the expression of its genes is also poorly understood. While several microarray studies have revealed intricate and tight gene expression regulation, we are unaware of the mechanisms underlying this control, and, more specifically, of the relative role of transcriptional and post-transcriptional regulation in the parasite [34]. Moreover, with the notable exception of the recently dis-covered ApiAP2 domain [35], most attempts to identify transcriptional factors inP. falciparumhave failed.
As a case study, we ran RED2
on the datasets of Bozdech
et al.[11] and Shocket al. [36]. The former measured
mRNA levels ofP. falciparumgenes once per hour during one complete 48 h intraerythrocytic cycle, while the latter measured mRNA-decay profiles during this same cycle. For each dataset, we performed two separate analyses. In the first, we searched for putative motifs involved in mRNA synthesis regulation, that is, located up to one kilo-base upstream of the start codon, either on the forward or the reverse strand. In the second, we searched for motifs that are likely involved in mRNA degradation or seques-tration, that is located up to 500 bp downstream of the stop codon, on the forward strand only, which approxi-mately corresponds to the 3’UTR. RED2was run with the mutual information scoring function, and the following parameters:a= 0.9,g= 0.75, FDR threshold = 0.001. For the downstream analysis, we also increased the maximum motif length to 12. Complete results for these analyses are provided in Additional files 9 and 10.
match (at 15% FDR) one of the 23 ApiAP2 motifs pre-viously identified in a protein binding microarray experi-ment [18]. Among the motifs that do not match any ApiAP2 motifs, the HAGACA motif (see Figure 4b) achieves a very high score (it is the second best scoring motif of the analysis) and may be the binding site of a yet uncharacterized transcription factor. Downstream analysis on the same dataset identified no motifs. FIRE and MatrixREDUCE (with default parameters) get six and three matches (at 15% FDR) on this dataset, respec-tively (see Additional files 11 and 12).
In contrast, downstream analysis of the Shock mRNA decay dataset returns six motifs. The best scoring one (HWKTTTTTNGT, see Figure 11a) is partially included in a 47 bp motif previously identified in the 3’UTR of nine translationally repressed transcripts [37], and is very similar to a motif (TYTTTTNGT) identified in the downstream region of someP. falciparumgenes by com-parative genomics withP. yoeliiandP. knowlesi[30]. To the best of our knowledge, the second best scoring motif (AAAAAAAAAAAV, Figure 11b) does not resemble any other motif already described in the literature. When looking at the occurrence position distributions, we see that both motifs have a high, although very different, positional bias. We can also see that the genes where these motifs are present have quite opposite mRNA decay profiles, and that these two motifs seem to define two different gene classes. The three remaining motifs
achieve lower scores, and look similar to the best two motifs, being either T- or A-rich. Moreover, a visual inspection of their position distribution in the sequence and in the expression space shows that they are also simi-larly distributed. Hence, it is tempting to speculate that these motifs are variants of the best two motifs, or are complementary motifs working together with the latter.
Interestingly, a downstream analysis with the Bozdech dataset did not return any motifs. Hence, the fact that these motifs were identified only in the downstream analysis of the Shock dataset supports the hypothesis that they are involved in mRNA degradation or seques-tration. Moreover, it is worth noting that the down-stream analysis discovered few motifs (five) compared with the equivalent upstream analysis (> 20). Together, these results seem to indicate that either transcript regu-lation in P. falciparum mainly occurs at the mRNA synthesis level, or that important downstream motifs cannot be represented as consensus sequences (for example, structural motifs).
The RED2analysis results for yeast and P. falciparum
[image:14.595.57.539.99.164.2]have several differences. InS. cerevisiae, many motifs show a strong positional bias towards a small region located approximately 150 bp upstream of the genes (for example, SFP1, TOD6, MBP1, YDR026C and STB1, see Additional files 2 to 5). Interestingly, this kind of positional bias is not observed in the upstream analysis ofP. falciparum, where motif occurrences are more uniformly distributed (see for
Table 1 Number of motifs recovered and not recovered by the different methods at 15% FDR
Total number of motifs recovered RED2-MI RED2-H FIRE MatrixREDUCE
RED2-MI 45 - 21 21 35
RED2-H 37 13 - 13 25
FIRE 39 15 15 - 28
MatrixREDUCE 20 10 8 9
[image:14.595.58.539.532.701.2]example Additional file 9). Moreover, there is a strong strand bias for many motifs found inP. falciparum -theP
value of the sign test is below 10−3for six motifs - but very few inS. cerevisiae. Finally, we note that the average num-ber of motif occurrences per gene is significantly higher in
P. falciparumthan inS. cerevisiae. Overall, these results may reflect marked differences between the gene regula-tion mechanisms in the two species.
Conclusions
Most approaches forin silicodiscovery of regulatory ele-ments require clustering of the expression data. This implicitly assumes that genes belong to disjoint classes, an assumption that rarely holds in the regulation context. In this paper, we have presented a new approach for disco-vering regulatory elements that does not require clustering and allows overlaps between different gene sets. This is done by estimating motif densities locally around each gene using a fixed-size neighborhood. We have adapted the hypergeometric and mutual-information criteria to this approach, and have shown for yeast that the new ver-sions outperform the original methods, both in terms of statistical sensitivity and the number of experimentally validated motifs they retrieve. A comparison with the FIRE and MatrixREDUCE algorithms also demonstrated the complementarity of the different approaches.
Furthermore, we have shown that motif densities in the gene-expression space are useful for comparing and dis-criminating between different motifs. This discriminative feature is extensively used in our optimization procedure to avoid merging motifs whose descriptions look similar at the sequence level, but which are associated with dif-ferent locations in the expression space. Similarly, the density of a motif around a particular gene can help to predict if an occurrence of this motif is biologically active or not.
The scoring functions and methods presented in this paper have been implemented in the RED2 software [38]. RED2 returns the identified motifs along with other information and has a user-friendly interface. A RED2 analysis usually takes between 5 and 20 min, depending on the number of screened genes and the size of the analyzed sequences.
There are several enhancements for this work. First, we intend to enrich the RED2 server with additional pre-loaded species and tools. For example, we plan to add a motif comparison tool that would make use of both DNA sequence and gene expression to compute a similarity score between two motifs, in a way similar to that of our filtering procedure. Finally, another interest-ing enhancement would be to supplement RED2 with information on close species in order to improve both its sensitivity and accuracy.
Material and methods
Neighborhood definition
LetΓ be thek-nearest neighbor graph obtained by put-ting an arc from the node (gene)gto the node g’ifg’is among the k-nearest neighbors ofg. In this graph, the neighborhood of a geneginvolves all genesg’such that there is an arc g ® g’. Firstly, the neighborhood rela-tions are symmetrized: if there is an arc g® g’ and no arc g’ ® g, the latter is added to the graph. This gives us a new graph Γ*. In this graph, each gene is in the neighborhood of at least k other genes. We useΓ* to progressively constructΓk, a directed graph where each gene has exactlykneighbors, in a way that reduces the skewness of the in-degree distribution. More precisely, the kneighbors of each geneg are successively sampled from its neighbors inΓ*, according to the following dis-tribution:
P(g) = ⎡
⎣
g∈N(g)
d(g) d(g)
⎤ ⎦
−1
,
where d(g’) is the in-degree of geneg’inΓ*, andN(g) the set of neighbors of g in Γ* that have not yet been included in Γk. In other words, the probability for a gene to be chosen as a neighbor is inversely propor-tional to the number of times it can be chosen.
Motif density
The density of a motif in a subset of genes is simply the proportion of genes that contain the motif in that sub-set. To better distinguish between high and low density values, it is sometimes convenient to express the density as a z-score. Letnmbe the number of genes that contain a given motif m among a total of n genes. Under H0 (random motif distribution), the number of genes that contain the motif among a sample ofkgenes (nmk) fol-lows a hypergeometric distribution [39] of parametersn,
nm and k. Thus, the z-score of an observed density is given by:
knm/n
knm(n−k)(n−nm)
n2(n−1) .
(6)
This quantity is positive (respectively negative) if the number of genes that possess the motif in the sample is higher (respectively lower) than expected.
Yeast andP. falciparumdata
The 1 kb and 600 bp upstream sequences of P.
falci-parum andS. cerevisiae(respectively) were downloaded
sequences of P. falciparumwere downloaded from the PlasmoDB database [40] (version 6.3). To prevent any bias that could result from multi-gene families [6], paralogs were identified using OrthoMCL [41] and discarded.
The Gasch et al.[21] compendium was divided into 22 subsets according to the descriptions available in the file. The resulting partition is available in Additional file 13. Each dataset then has expression profiles of between 3 to 15 time points/experiment, with an average number of 7.5 time points/experiment per dataset.
Additional material
Additional file 1: Assessment forS. cerevisiaeusing the JASPAR and the Gordânet al.databases. Results obtained when using the JASPAR and the Gordânet al.databases (instead of ScerTF). This corresponds to the experiments shown in Figures 8 to 10 in the main manuscript.
Additional file 2: Results of RED2with mutual information criterion on theS. cerevisiaeupstream regions with the Gaschet al.stress compendium. The set of motifs inferred by RED2on the Gaschet al. complete compendium. Provided for each motif are the logo of the motif, the number of genes that have the motif in their promoter region, the expression profiles (heatmap) associated with the motif, a histogram of the motif occurrence positions, the existence/absence of any strand bias, and the name of the ScerTF motif that best matches the inferred motif (if any at 15% FDR).
Additional file 3: Results of RED2(hypergeometric) onS. cerevisiae
upstream regions with the Gaschet al.stress compendium. The set of motifs inferred by RED2on the Gaschet al.complete compendium.
See the description of Additional file 2 for table column definitions.
Additional file 4: Results of RED2(mutual information) on
S. cerevisiaeupstream regions with the Spellmanet al.cell-cycle dataset. The set of motifs inferred by RED2on the Spellmanet al.
dataset. See the description of Additional file 2 for table column definitions.
Additional file 5: Results of RED2(hypergeometric) onS. cerevisiae
upstream regions with the Spellmanet al.cell-cycle dataset. The set of motifs inferred by RED2on the Spellmanet al.dataset. See the
description of Additional file 2 for table column definitions.
Additional file 6: Results of FIRE onS. cerevisiaeupstream regions with the Spellmanet al.cell-cycle dataset. The set of motifs inferred by FIRE on the Spellmanet al.dataset. See the description of Additional file 2 for table column definitions.
Additional file 7: Results of MatrixREDUCE onS. cerevisiaeupstream regions with the Spellmanet al.cell-cycle dataset. The set of motifs inferred by MatrixREDUCE on the Spellmanet al.dataset. See the description of Additional file 2 for table column definitions.
Additional file 8: ScerTF motifs recovered by RED2, FIRE and
MatrixREDUCE on the 24S. cerevisiaedatasets. For each method, this table provides the number of datasets in which each motif was recovered (at 15% FDR). For example, REDUCE correctly predicts AFT1 (first line) in one dataset. The last two lines give the total number of correct predictions (Total) and the number of distinct motifs recovered (Coverage). For example, for the 24 datasets, RED2makes 177 correct predictions, which cover 43 distinct motifs in ScerTF.
Additional file 9: Results of RED2(mutual information) on
P. falciparumupstream regions with the Bozdechet al.dataset (erythrocytic cycle). The set of motifs inferred by RED2on the upstream
regions ofP. falciparumgenes using the Bozdechet al.dataset [11]. See the description of Additional file 2 for a description of the different columns.
Additional file 10: Results of RED2(mutual information) on P. falciparumdownstream regions with the Shocket al.dataset (mRNA decay). The set of motifs inferred by RED2on the downstream regions ofP. falciparumgenes using the Shocket al.dataset [36]. See the description of Additional file 2 for table column definitions.
Additional file 11: Results of FIRE onP. falciparumupstream regions with the Bozdechet al.dataset (erythrocytic cycle). The set of motifs inferred by FIRE on the upstream regions ofP. falciparumgenes using the Bozdechet al.dataset [11]. See the description of Additional file 2 for table column definitions.
Additional file 12: Results of MatrixREDUCE onP. falciparum upstream regions with the Bozdechet al.dataset (erythrocytic cycle). The set of motifs inferred by MatrixREDUCE on the upstream regions ofP. falciparumgenes using the Bozdechet al.dataset [11]. See the description of Additional file 2 for table column definitions.
Additional file 13: The 22 datasets from the Gaschet al. compendium. This text file describes the partition of the Gaschet al. [21] stress compendium into 22 test datasets.
Abbreviations
FDR: false discovery rate; GO: gene ontology; kNN:k-nearest neighbors; PWM: position weight matrix; RE: regulatory element; RED2: regulatory
element discovery from raw expression data.
Authors’contributions
ML and LB designed the method and experiments, and drafted the manuscript. ML conceived and implemented the program and conducted the experiments. OG suggested method improvements and revised the manuscript. VL integrated the program into the web server and made technical improvements. LB coordinated the study. All authors read and approved the final manuscript.
Competing interests
The authors declare that they have no competing interests.
Acknowledgements
This research is supported by the French National Research Agency: PlasmoExplore project (ANR-06-CIS6-MDCA-014) and PlasmoExpress project (ANR JCJC 2010).
Received: 4 June 2012 Revised: 10 October 2012
Accepted: 27 November 2012 Published: 27 November 2012
References
1. Mello C, Conte D:Revealing the world of RNA interference.Nature2004, 431:338-342.
2. Bailey T, Elkan C:Fitting a mixture model by expectation maximization to discover motifs in biopolymers.ISMB. International Conference on Intelligent Systems for Molecular Biology, Volume 21994, 28.
3. Hughes J, Estep P, Tavazoie S, Church G:Computational identification of Cis-regulatory elements associated with groups of functionally related genes in Saccharomyces cerevisiae.J Mol Biol2000,296:1205-1214. 4. Pavesi G, Mauri G, Pesole G:An algorithm for finding signals of unknown
length in DNA sequences.Bioinformatics2001,17:S207.
5. Sandve G, Abul O, Walseng V, Drabløs F:Improved benchmarks for computational motif discovery.BMC Bioinformatics2007,8:193. 6. Elemento O, Slonim N, Tavazoie S:A universal framework for regulatory
element discovery across all genomes and data types.Mol Cell2007, 28:337-350.
7. Young J, Johnson J, Benner C, Yan S, Chen K, Le Roch K, Zhou Y, Winzeler E:In silicodiscovery of transcription regulatory elements in
Plasmodium falciparum.BMC Genomics2008,9:70.
Vaidya AB,et al:Genome sequence of the human malaria parasite
Plasmodium falciparum.Nature2002,419:498-511.
9. Wagner A:Genes regulated cooperatively by one or more transcription factors and their identification in whole eukaryotic genomes. Bioinformatics1999,15:776.
10. Hobert O:Gene regulation by transcription factors and microRNAs. Science2008,319:1785.
11. Bozdech Z, Llinás M, Pulliam B, Wong E, Zhu J, DeRisi J:The transcriptome of the intraerythrocytic developmental cycle ofPlasmodium falciparum. PLoS Biol2003,1:E5.
12. Chen X, Hughes T, Morris Q:RankMotif++: a motif-search algorithm that accounts for relative ranks of K-mers in binding transcription factors. Bioinformatics2007,23:i72.
13. Eden E, Lipson D, Yogev S, Yakhini Z:Discovering motifs in ranked lists of DNA sequences.PLoS Comput Biol2007,3:e39.
14. Bussemaker H, Li H, Siggia E:Regulatory element detection using correlation with expression.Nature Genetics2001,27:167-174. 15. Foat B, Houshmandi S, Olivas W, Bussemaker H:Profiling
condition-specific, genome-wide regulation of mRNA stability in yeast.Proceedings of the National Academy of Sciences of the United States of America2005, 102:17675.
16. Holmes I, Bruno W:Finding regulatory elements using joint likelihoods for sequence and expression profile data.Proc Int Conf Intell Syst Mol Biol, Volume 82000, 202-210.
17. De Silva E, Gehrke A, Olszewski K, León I, Chahal J, Bulyk M, Llinás M: Specific DNA-binding by apicomplexan AP2 transcription factors. Proceedings of the National Academy of Sciences2008,105:8393. 18. Campbell T, De Silva E, Olszewski K, Elemento O, Llinás M, Smith J:
Identification and genome-wide prediction of DNA binding specificities for the ApiAP2 family of regulators from the malaria parasite.PLoS Pathogens2010,6:5-526.
19. Riordan D, Herschlag D, Brown P:Identification of RNA recognition elements in theSaccharomyces cerevisiaetranscriptome.Nucleic Acids Res 2010,39:1501-1509.
20. RadovanovićM, Nanopoulos A, Ivanovi¢ M:Hubs in space: Popular nearest neighbors in high-dimensional data.J Machine Learning Research 2010,11:2487-2531.
21. Gasch A, Spellman P, Kao C, Carmel-Harel O, Eisen M, Storz G, Botstein D, Brown P:Genomic expression programs in the response of yeast cells to environmental changes.Science’s STKE2000,11:4241.
22. Nguyen D, D’haeseleer P:Deciphering principles of transcription regulation in eukaryotic genomes.Mol Sys Biol2006,2.
23. Spellman P, Sherlock G, Zhang M, Iyer V, Anders K, Eisen M, Brown P, Botstein D, Futcher B:Comprehensive identification of cell cycle-regulated genes of the yeastSaccharomyces cerevisiaeby microarray hybridization.Mol Biol Cell1998,9:3273.
24. R Development Core Team:R: A Language and Environment for Statistical Computing. R Foundation for Statistical ComputingVienna, Austria; 2011 [http://www.R-project.org/].
25. Portales-Casamar E, Thongjuea S, Kwon A, Arenillas D, Zhao X, Valen E, Yusuf D, Lenhard B, Wasserman W, Sandelin A:JASPAR 2010: the greatly expanded open-access database of transcription factor binding profiles. Nucleic Acid Res2010,38:D105.
26. Gordân R, Murphy K, McCord R, Zhu C, Vedenko A, Bulyk M:Curated collection of yeast transcription factor DNA binding specificity data reveals novel structural and gene regulatory insights.Genome Biol2011, 12:R125.
27. Spivak A, Stormo G:ScerTF: a comprehensive database of benchmarked position weight matrices forSaccharomycesspecies.Nucleic Acid Res 2012,40:D162-D168.
28. Gupta S, Stamatoyannopoulos J, Bailey T, Noble W:Quantifying similarity between motifs.Genome Biol2007,8:R24.
29. Benjamini Y, Hochberg Y:Controlling the false discovery rate: a practical and powerful approach to multiple testing.Journal of the Royal Statistical Society. Series B (Methodological)1995,57:289-300.
30. Wu J, Sieglaff D, Gervin J, Xie X:Discovering regulatory motifs in the
Plasmodiumgenome using comparative genomics.Bioinformatics2008, 24:1843.
31. Boudière L, Botté C, Saidani N, Lajoie M, Marion J, Bréhélin L, Yamaryo-Botté Y, Satiat-Jeunemaître B, Breton C, Girard-Egrot A, Bastien O, Jouhet J, Falconet D, Block M, Maréchal E:Galvestine-1, a novel chemical probe for
the study of the glycerolipid homeostasis system in plant cells.Mol BioSyst2012,8:2023-2035.
32. World Health Organization:World Malaria Report2010.
33. Gardner MJ, Hall N, Fung E, White O, Berriman M, Hyman RW, Carlton JM, Pain A, Nelson KE, Bowman S, Paulsen IT, James K, Eisen JA, Rutherford K, Salzberg SL, Craig A, Kyes S, Chan MS, Nene V, Shallom SJ, Suh B, Peterson J, Angiuoli S, Pertea M, Allen J, Selengut J, Haft D, Mather MW, Vaidya AB, Martin DM,et al:Genome sequence of the human malaria parasitePlasmodium falciparum.Nature2002,419:498-511.
34. Horrocks P, Wong E, Russel K, Emes R:Control of gene expression in
Plasmodium falciparum- Ten years on.Mol Biochem Parasit2009, 164:9-25.
35. Balaji S, Babu M, Iyer L, Aravind L:Discovery of the principal specific transcription factors of Apicomplexa and their implication for the evolution of the AP2-integrase DNA binding domains.Nucleic Acid Res 2005,33:3994.
36. Shock J, Fischer K, DeRisi J:Whole-genome analysis of mRNA decay in
Plasmodium falciparumreveals a global lengthening of mRNA half-life during the intra-erythrocytic development cycle.Genome Biol2007,8: R134.
37. Hall N, Karras M, Raine JD, Carlton JM, Kooij TW, Berriman M, Florens L, Janssen CS, Pain A, Christophides GK, James K, Rutherford K, Harris B, Harris D, Churcher C, Quail MA, Ormond D, Doggett J, Trueman HE, Mendoza J, Bidwell SL, Rajandream MA, Carucci DJ, Yates JR, Kafatos FC, Janse CJ, Barrell B, Turner CM, Waters AP, Sinden RE:A comprehensive survey of thePlasmodiumlife cycle by genomic, transcriptomic, and proteomic analyses.Science2005,307:82-86.
38. RED2software..[http://www.atgc-montpellier.fr/RED2/], Source code: https://bitbucket.org/mlajoie/red2.
39. Ewens W, Grant G:Statistical methods in bioinformatics: an introduction, vol 10Springer Verlag; 2005.
40. Aurrecoechea C, Brestelli J, Brunk BP, Dommer J, Fischer S, Gajria B, Gao X, Gingle A, Grant G, Harb OS, Heiges M, Innamorato F, Iodice J, Kissinger JC, Kraemer E, Li W, Miller JA, Nayak V, Pennington C, Pinney DF, Roos DS, Ross C, Stoeckert CJ, Treatman C, Wang H:PlasmoDB: a functional genomic database for malaria parasites.Nucleic Acid Res2009,37: D539-D543.
41. Li L, Stoeckert C, Roos D:OrthoMCL: identification of ortholog groups for eukaryotic genomes.Genome Res2003,13:2178.
doi:10.1186/gb-2012-13-11-r109
Cite this article as:Lajoieet al.:Computational discovery of regulatory
elements in a continuous expression space.Genome Biology201213:
R109.
Submit your next manuscript to BioMed Central and take full advantage of:
• Convenient online submission
• Thorough peer review
• No space constraints or color figure charges
• Immediate publication on acceptance
• Inclusion in PubMed, CAS, Scopus and Google Scholar
• Research which is freely available for redistribution
![Figure 1 Gene expression data of P. falciparum 48 h erythrocytic cycle [11]. Each point in the figures corresponds to an expression profileplotted according to the first and second principal components](https://thumb-us.123doks.com/thumbv2/123dok_us/8653884.868474/2.595.58.538.89.345/expression-falciparum-erythrocytic-corresponds-expression-profileplotted-principal-components.webp)

![Figure 3 Comparison between different motifs in P. falciparum, using the Pearson correlation between their density profiles [11]](https://thumb-us.123doks.com/thumbv2/123dok_us/8653884.868474/7.595.59.539.425.681/figure-comparison-different-falciparum-pearson-correlation-density-profiles.webp)