The effect of alcohol hangover on choice
response time
Grange, JA, Stephens, R, Jones, K and Owen, LJ
http://dx.doi.org/10.1177/0269881116645299
Title
The effect of alcohol hangover on choice response time
Authors
Grange, JA, Stephens, R, Jones, K and Owen, LJ
Type
Article
URL
This version is available at: http://usir.salford.ac.uk/id/eprint/49994/
Published Date
2016
USIR is a digital collection of the research output of the University of Salford. Where copyright
permits, full text material held in the repository is made freely available online and can be read,
downloaded and copied for noncommercial private study or research purposes. Please check the
manuscript for any further copyright restrictions.
Journal of Psychopharmacology
2016, Vol. 30(7) 654 –661 © The Author(s) 2016 Reprints and permissions:
sagepub.co.uk/journalsPermissions.nav DOI: 10.1177/0269881116645299 jop.sagepub.com
Alcohol hangover refers to the set of adverse symptoms experi-enced following alcohol consumption once alcohol has been eliminated from the blood (Verster et al., 2010). A number of bio-logical mechanisms underlying hangover have been put forward such as the metabolism of congeners (alcohols in drinks other than ethanol) such as methanol, imbalance in the immune system and reduced blood glucose concentration (Penning et al., 2010), as well as acetaldehyde level increase, dehydration, sleep depri-vation and insufficient eating (Verster et al., 2003). Although researchers have some understanding of the physiological effects of hangover, much less is known about the cognitive effects of hangover (Prat et al., 2008, 2009).
Stephens et al. (2014) provided a review of studies which have investigated the effects of alcohol hangover on general cognition. They reviewed the growing evidence base that shows hangover negatively affects core cognitive functions such as divided attention (e.g. Roehrs et al., 1991), sustained attention (e.g. Anderson and Dawson, 1999; McKinney et al., 2012; Rohsenow et al., 2010), attentional selection (e.g. McKinney et al., 2012) and some executive functions (e.g. Streufert et al., 1995).
The focus of the present study was on the effect of alcohol hangover on response time (RT). Simple RT requires no choice between response alternatives, and is merely a reaction to an external stimulus (e.g. ‘Press the space bar as soon as you see a flash on the screen’). Choice RT, in contrast, requires partici-pants to make a decision regarding which of multiple responses is appropriate given the stimulus presented. For example, if pre-sented with a number stimulus, the task might require partici-pants to judge whether the number is odd or even, by making a left or right key press, respectively. Choice RT requires more cognitive processing than simple RT as an extra stage of response selection is required.
Choice RT is a dominant DV in cognitive psychology, and as such, forms the foundation of many tests which measure ‘higher-level’ cognitive processes (Voss et al., 2013). An understanding of RT processes at a fundamental level is an important goal for cognitive science, not only with respect to their use in probing higher-level cognition, but also in their own right. RTs are inter-esting to cognitive scientists because everyday life often requires efficient response selection and rapid RTs. Driving, for example, presents us with an incredibly complex environment wherein we must often make rapid responses to external stimuli (braking when a child runs out into the street, for example). Examination of the effect of alcohol hangover on choice RT is therefore impor-tant given the necessity of rapid and efficient responding in eve-ryday life.
In the present paper we report a study that investigated in detail the effect of alcohol hangover on choice RT. The novelty of this contribution is that we went beyond central tendency (e.g. mean) RT analysis – which, as we discuss in a later section, has limited utility for examining true group differences – by examin-ing performance in hangover conditions across the whole of the RT distribution, and also by fitting a formal (mathematical) model of choice RT to the data. The former allowed us to explore in finer resolution the potential effects of hangover on RT
The effect of alcohol hangover
on choice response time
James A Grange
1, Richard Stephens
1, Kate Jones
2and Lauren Owen
3Abstract
The effect of alcohol hangover on cognitive processing has received little attention. We explored the effect of alcohol hangover on choice response time (RT), a dominant dependent variable (DV) in cognitive research. Prior research of the effect of hangover on RT has produced mixed findings; all studies reviewed relied exclusively on estimates of central tendency (e.g. mean RT), which has limited information value. Here we present novel analytical methods by going beyond mean RT analysis. Specifically, we examined performance in hangover conditions (n=31) across the whole RT distribution by fitting ex-Gaussian models to participant data, providing a formal description of the RT distribution. This analysis showed detriments to performance under hangover conditions at the slower end of the RT distribution and increased RT variance under hangover conditions. We also fitted an explicit mathematical process model of choice RT – the diffusion model – which estimates parameters reflecting psychologically-meaningful processes underlying choice RT. This analysis showed that hangover reduced information processing efficiency during response selection, and increased response caution; changes in these parameters reflect hangover affecting core decisional-components of RT performance. The implications of the data as well as the methods used for hangover research are discussed.
Keywords
Alcohol hangover, choice response time, ex-Gaussian analysis, diffusion model, cognitive effects
1Keele University, Keele, UK
2Health and Safety Laboratory, Buxton, UK 3Sheffield University, Sheffield, UK
Corresponding author:
James A. Grange, School of Psychology, Dorothy Hodgkin Building, Keele University, Keele, Staffordshire ST5 5BG, UK.
Email: [email protected]
Grange et al.
655
performance; the latter allowed us to begin to address which aspect of the RT process is influenced by hangover.
The introduction is organised as follows. First we provide a brief overview of studies that have examined whether hangover affects RT. Then, we discuss the potential limitation of relying purely on estimates of central tendency when analysing RT in hangover research. We then provide a brief introduction to two approaches which we adopt in this study: analysis of whole RT distributions (using ex-Gaussian modelling), and fitting of a for-mal (mathematical) model of choice RT.
Previous studies of hangover and
response time
There is convincing evidence that response time is negatively affected by the acute effects of alcohol (see Schweizer and Vogel-Sprott, 2008, for a review). In contrast, the picture is still rela-tively unclear as to whether alcohol hangover affects response time. The brief review below only considers when RT was meas-ured in its own right, rather than as a DV assessing another func-tion (e.g. selective attenfunc-tion); see Stephens et al. (2014) for a review of these cognitive effects.
McKinney and Coyle (2004) utilised a naturalistic study, that is, an alcohol study in which participants were free to choose the beverage, the quantity consumed, the setting and whether to eat at the same time as drinking (see Stephens et al., 2014). A series of cognitive tasks were performed by 48 participants on two sep-arate occasions, one of which was the morning after drinking had occurred (hangover condition), and one the morning after no drinking (control condition); the order of hangover/control con-ditions was controlled. A simple RT task requiring participants to respond as soon as they saw an ‘X’ appear on the screen and a five-choice RT task were employed. The choice RT task required participants to move a stylus from a central position to one of five potential target locations; the relevant target location for each trial was indicated by a red LED light at the correct location. The results showed slower mean simple RT in the hangover condi-tion; there was no effect of hangover on the standard deviation of simple RT. For the choice RT task, there was no main effect of hangover on initial-movement time (the time taken to move the stylus to the target area), but participants who experienced the experiment in the order hangover–no-hangover showed slower RTs in their hangover state.
McKinney et al. (2012) also utilised a naturalistic study where 48 participants came to the laboratory the day after they had been drinking and performed a series of cognitive tasks; performance in this hangover condition was compared to the same partici-pants’ performance on a day after they had not been drinking. (There was also an acute alcohol condition.) The RT task was again a simple RT task requiring participants to press the space bar whenever an ‘X’ was presented on-screen. Findings showed slower RTs in the hangover condition than in the control condi-tion. Rather surprisingly, RTs were also found to be slower in the hangover condition than in the acute alcohol condition.
In contrast, Kruisselbrink et al. (2006) found no effect of hangover on RT in a laboratory-based study. Altogether 12 females were tested, and were presented with none, two, four or six bottles of 5% beer across four sessions; testing occurred 7.5 h later. The study utilised a four-choice RT task, requiring partici-pants to make a spatially-compatible movement towards one of
four directions. No effect on RT was reported, but significantly more errors were made as the dosage of alcohol increased. From this, the authors concluded that ‘…the amount of alcohol con-sumed affects decision-making processes but not the speed of information processing’ (Kruisselbrink et al., 2006: 419).
Lemon et al. (1993) also reported no effect of alcohol hango-ver on RT. In a simple RT task, participants responded by press-ing a button when an ‘X’ was presented on the screen. In the ‘Mackworth Clock’ task, participants had to monitor a schematic of a clock, with a rectangle moving clockwise; on a portion of trials, the rectangle would jump further ahead in the movement than usual, and subjects had to respond to this oddity by pressing a button. Although an effect on simple RT was found during an intoxicated stage, no effects were found in the hangover state. For the Mackworth Clock test, no effect was found on RT in either the acute- or hangover-state.
Limitations on response time analysis
It is clear that there is some inconsistency in establishing a clear effect of hangover on RT (either simple or choice). However, one potential limitation of studies examining the effect of hangover on RT is that they all relied on central tendency estimates of RT performance; most frequently mean RT was analysed. Although the mean and/or median provide an efficient summary statistic of an individual’s performance, the information reduction inherent in its computation can potentially limit the opportunity for group differences to be realised. Participants provide numerous responses in an experimental condition, and the central tendency is an estimate of the whole distribution of RTs; this reduction of information – many individual RTs collapsed into one estimate – can be problematic, as experimental manipulations (or group differences) can emerge in different components of the RT distri-bution whilst leaving the central tendency unchanged (e.g. Heathcote et al., 1991).
To overcome this potential limitation in our study, we ana-lysed whole-RT distributions as well as estimates of central ten-dency (i.e. median RT). Specifically, we fitted an ex-Gaussian function to each participant’s RT data for each condition sepa-rately (see Balota and Yap, 2011; Heathcote et al., 1991) to pro-vide a formal description of the RT distribution under hangover and control conditions.
non-decision time, Ter, which describes the time for perceptual encoding of the stimulus and executing a motor response. (The model collapses both of these processes into this one parameter.)
In the present study we were interested in conducting an exploratory investigation of which processes in the diffusion model (if any) are influenced by alcohol hangover. It is interest-ing to note that a recent study (van Ravenzwaaij et al., 2012) utilised the diffusion model examining the effects of acute-alco-hol administration on RT using a diffusion model fitting routine, and found alcohol decreased the drift rate parameter, and increased the non-decision time; no clear effect was established on the boundary separation. This suggests that in their study, alcohol slowed information processing speed and increased motor-responding time, but had no effect on response caution.
The present study
In our study, we presented a choice RT paradigm to participants on two occasions: once a day after the participant had engaged in a drinking episode (hangover condition) and once the day after the participant had not engaged in a drinking episode (control condition). Due to the inconsistency of the effect of hangover on RT in prior studies, we were uncertain what to expect in the cur-rent study; this is particularly true because this is the first study to investigate the effect of hangover on RT processes using the more detailed analyses of ex-Gaussian and diffusion modelling. Thus, the study reported below can be considered exploratory rather than confirmatory (see e.g. Wagenmakers et al., 2012); however, it is important to note that all analyses presented were decided upon a priori, as were the participant exclusion criteria imple-mented. The RT task was a component of a battery of tasks pre-sented to participants (with the order of presentation controlled). Additional data collected from the same testing sessions will be reported elsewhere (Stephens et al., in preparation).
Method
Participants
The Keele University Research Ethics Panel approved the study, which was therefore performed in accordance with the ethical standards laid down in the 1964 Declaration of Helsinki. A total of 100 adult drinkers were recruited. However, not all partici-pants were analysed due to a number of a priori exclusion crite-ria. First, some participants only turned up for one session, so those with incomplete data were obviously excluded (n=22). Participants who had positive blood alcohol levels (tested via a breath test) on the day of testing for either the hangover or control day were excluded (n=20), as were participants for whom there was missing blood alcohol level (BAL) information (n=12). Some participants were removed as they did not confirm that they had never been diagnosed with a drink or drug problem (n=4), or they did not provide information on drink history (n=1). Participants who declared they had not had a drink the night before the hangover condition and participants who declared they did have a drink the night before the control condition were excluded (n=2). Participants with a body mass index (BMI) score over 30 were also excluded (n=2), to prevent atypical metabolic effects influencing the data. Participants who scored below 80%
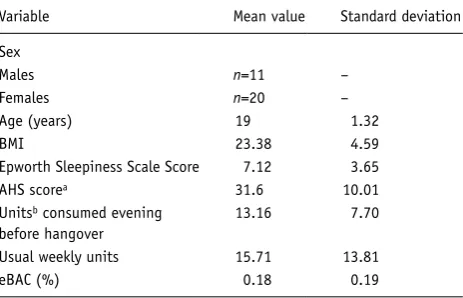
on average in the RT paradigm were also excluded (n=6). One additional participant was removed as their RT for the hangover condition was considerably slower than the RT for the control condition (~600 ms difference). To remain conservative, this par-ticipant was removed from analysis. After these exclusion crite-ria, the final sample consisted of 31 participants (see Table 1 for demographic information). Some participants received course credit plus £10, while £20 was paid to those ineligible for course credit. All participants were fully debriefed after testing.
Apparatus and stimuli
The response time task was presented on a standard PC running Windows XP; the experiment was programmed in E-Prime v2.0. Stimuli were presented on an LCD monitor the active part of which measured 410×258 mm. Stimuli consisted of the numbers 100–900 (excluding 500), and were presented in white Courier New Font at a size of 18 on a black background; the stimulus appeared in a white-framed square with 5 cm sides.
Procedure
[image:4.595.301.533.84.233.2]A screening interview ascertained inclusion criteria were met and asked participants to indicate the days of the week when they usually drink alcohol. An appointment was made to attend the laboratory for assessment following a usual drinking day but this could be cancelled where participants decided not to drink after all. Time of testing was between 0900 and 1300 when hangover effects would be most prominent, and test ses-sions lasted for around 1.5 h. Blood alcohol level was verified as zero for all participants using a Lion Laboratories Alcometer 500 electronic breath analyser. The nine-item Acute Hangover Scale (AHS; Rohsenow et al. 2007) assessed concurrent hango-ver sehango-verity. The number and type of alcoholic behango-verages con-sumed over the previous evening and the start and finish time of the drinking session were self-reported. These data, together with height and weight measurements were used to estimate blood alcohol concentration (eBAC) at the end of the drinking session using the formulae suggested by Seidl et al. (2000). The
Table 1. Descriptive statistics of participant characteristics.
Variable Mean value Standard deviation Sex
Males n=11 –
Females n=20 – Age (years) 19 1.32
BMI 23.38 4.59
Epworth Sleepiness Scale Score 7.12 3.65 AHS scorea 31.6 10.01
Unitsb consumed evening
before hangover
13.16 7.70 Usual weekly units 15.71 13.81 eBAC (%) 0.18 0.19
AHS: Acute Hangover Scale; BMI: body mass index; eBAC: estimate of blood alcohol concentration.
Grange et al.
657
Epworth Sleepiness Questionnaire (Johns, 1991) assessed tired-ness ‘at this moment’.
The RT task required participants judging whether a presented three-digit number was lower or higher than 500. The number was selected randomly on each trial from the set of potential stimuli. The task presented four blocks of 51 trials, with a self-paced rest screen after each block. A single trial consisted of the presentation of the stimulus, centred within the white square frame; the stimulus remained on screen until a response was reg-istered. Participants were required to press the ‘Z’ key if the num-ber was lower than 500, and ‘M’ if the numnum-ber was higher than 500. Participants were asked to make their response as quickly and as accurately as possible using the index finger of each hand. Once a response had been registered, the number disappeared, and the stimulus for the next trial appeared 500 ms later.
Design
The study employed a naturalistic design in which participants came into the laboratory after a usual night out drinking in the Hangover condition, and were tested after a night with zero alco-hol consumption for the control condition. Participants completed both conditions on separate days in a randomised order. The state of the participant (hungover vs control) was examined. A natural-istic design is preferable to a survey as it allows assessment of concurrent hangover effects. Furthermore, although the quantity and type of alcohol consumed is not controlled as it would be in a laboratory-based study, naturalistic studies can assess effects of the consumption of larger amounts of alcohol than is usual in laboratory-based studies (Stephens at al., 2014). As DVs, we ana-lysed median response time (in ms), standard deviation (SD) of RT and accuracy (%). In later analyses, we also examined the parameter estimates from the ex-Gaussian model (mu, sigma and tau), as well as the parameter estimates from the EZ-diffusion model (drift rate, boundary separation, and non-decision time).
Results
All analyses in this paper were conducted using R, a statistical programming language and environment (R Core Team, 2013).1
The code is written with (relatively) user-friendly comments throughout, so others can reproduce the analysis presented here should they so wish.
The analytical strategy for all DVs in this paper follows a similar pattern. First, for each DV, we report standard inferential statistics (i.e. t-tests together with effect sizes (Cohen’s d)) which utilises null-hypothesis significance testing (NHST). Given the known weaknesses of NHST (see e.g. Wagenmakers, 2007), in a second step we present Bayesian analysis of the data: Specifically, we present Bayes factors, denoted BF10, using the default
Bayesian t-test outlined by Rouder et al. (2009) which allowed us to quantify evidence in favour of the alternative hypothesis model (i.e. a group difference) compared to the null hypothesis model (no group difference).
Global RT performance
Before any analysis was conducted, we removed all responses faster than 150 ms, and slower than 10,000 ms; we used such a
lenient upper-bound on RT as the later analysis will focus on analysis of the whole distribution, so we did not wish to trim away potentially important detail from the tails of the RT distri-butions.2 Once this trimming was complete, median correct RT,3
SD correct RT, and accuracy were calculated.
Median RT.
For the median response time, it was found that RTs were slower in the hangover condition (519 ms, SE=13.87) than the control condition (486 ms, SE=9.54), 95% confidence inter-val of difference (11–54 ms), t(30)=3.08, p=0.004, d=0.55. The Bayes factors were calculated using the R-package ‘BayesFac-tor’ (Morey, Rouder & Jamil, 2013). For median response time, the Bayes factor (BF10=8.94) showed that the data were ~9 timesmore likely under H1 than under H0, which provides moderate
evidence for H1. These analyses converge on the conclusion that
hangover increased median RT.
SD of RT.
The data showed that the mean SD of RT was larger in the hangover condition (228 ms, SE=30.38) than in the control condition (157 ms, SE=16.21), 95% confidence interval of differ-ence (34, 109), t(30)=3.91, p<0.001, d=0.70. The Bayes factor for this test (BF10=61.63) showed that the observed data were~61 times more likely under H1 than under H0, which provides
very strong evidence for H1. These analyses converge on the
con-clusion that hangover increased the standard deviation of response time.
Accuracy
The data showed that accuracy was lower in the hangover condi-tion (93.58%, SE=0.66) than in the control condicondi-tion (94.31%, SE=0.65), 95% confidence interval of difference (–1.99–0.56); this difference was not statistically significant, t(30)=−1.18,
p=0.24, d=−0.21. The Bayes factor analysis (BF10=0.36)
sug-gested the data were slightly more likely under H0 (2.78 times
more likely) than under H1, although this evidence can only be
considered anecdotal.
Global response time and accuracy summary
These analyses suggest that hangover not only slowed RT, but also that RTs were more variable under conditions of alcohol hangover.4 These effect sizes can be considered approximately
medium, according to Cohen’s d criteria. Bayesian analysis of these effects showed that the data provided very strong support for hangover having a detrimental effect on median RT and the SD of RT. However, Bayesian analyses also suggested that the effect of alcohol hangover on accuracy is inconclusive, and thus no strong conclusions can be established regarding accuracy.
Ex-Gaussian modelling
(mu, sigma, tau) for each participant and each condition. Mu reflects the mean of the Gaussian component, sigma reflects the SD of the Gaussian component, and tau reflects the rate of the exponential component. These parameters are then used separately as DVs when comparing differences between the hangover and control condition.
Mu.
The analysis showed that the mu parameter was numerically larger in the hangover condition (401, SE=8.43) than in the con-trol condition (397, SE=6.46), but this difference was not statisti-cally significant, 95% confidence interval of difference (–9–18),t(30)=0.66, p=0.52, d=0.12. The Bayes factor analysis (BF10=0.23) showed that the data were ~4 times more likely
under H0 than under H1; this provides moderate evidence for the
null. These analyses suggest that there is no effect of hangover on the mu parameter.
Sigma.
The analysis showed that the mean estimate for the sigma parameter was higher in the hangover condition (47, SE=1.92) than in the control condition (42, SE=1.85), 95% con-fidence interval of difference (1–10), t(30)=2.52, p=0.02, d=0.45. The Bayes factor analysis (BF10=2.83) showed that the data were~3 times more likely under H1 than under H0, which provides
anecdotal support for H1. These analyses all converge on the
con-clusion that hangover increased the sigma parameter of the ex-Gaussian distribution.
Tau.
The analysis showed that estimates of tau were higher in the hangover condition (176, SE=18.02) than in the control con-dition (127, SE=10.35), 95% confidence interval of difference (25–74), t(30)=4.14, p<0.001, d=0.74. The Bayes factor analysis (BF10=108.77) showed that the data were ~109 times more likelyunder H1 than under H0, which provides extreme support for H1.
These analyses all converge on the conclusion that hangover increased the tau parameter of the ex-Gaussian distribution.
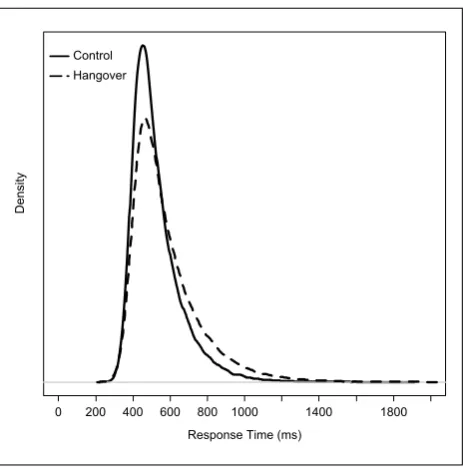
Ex-Gaussian summary.
The ex-Gaussian analysis suggested that hangover is influencing the sigma parameter and the tau parameter. The combined effect is that the RTs in the hangover condition are modelled as being more spread out and more nega-tively-skewed. To provide a more intuitive presentation of the effect of hangover on the RT distributions in the current data set, we simulated 100,000 RTs for each condition using the means of the best-fitting ex-Gaussian parameters. The distribution plots for each simulated condition are shown in Figure 1.The distribution plots are overlapping, so that the effect of hangover can be seen more clearly; the control data is presented in the solid-line, and the hangover data in the dashed line. As can be seen, the control data are more compact toward the faster end of the distribution, with lower density towards the tail end of the distribution. The hangover data, on the other hand, has a more spread density function, with higher densities than the control condition at the tail end of the distribution.
Diffusion modelling
We fit the data using the EZ-diffusion model (Wagenmakers et al., 2007), which requires mean correct RT, variance of correct RT, and proportion correct from each participant and condition in
order to estimate model parameters. For the correct mean and variance RT, we again only used RTs in the range 150–10,000 ms. The EZ-diffusion model was fitted to each subjects’ data for each condition separately. Parameter estimates for two participants included negative values; these participants were removed from this analysis. Analysis adapted the R-functions provided by Wagenmakers et al. (2007).
Drift rate.
The analysis showed that the mean estimate for the drift parameter was lower in the hangover condition (0.233, SE=0.01) than in the control condition (0.269, SE=8.35e-03), 95% confidence interval of difference (–0.055– –0.018),t(28)=−4.11, p<0.001, d=−0.76. The Bayes factor analysis (BF10=93.61) showed that the data were ~94 times more likely
under H1 than under H0, which provides very strong support for H1. These analyses all converge on the conclusion that hangover
decreased the drift rate parameter of the EZ-diffusion model.
Boundary separation.
The analysis showed that the mean estimate for the boundary separation parameter was higher in the hangover condition (0.130, SE=7.63e-03) than in the con-trol condition (0.111, SE=4.49e-03), 95% confidence interval of difference (0.006–0.031), t(28)=3.03, p=0.005, d=0.56. The Bayes factor analysis (BF10=7.96) showed that the data were ~8times more likely under H1 than under H0, which provides mod-erate support for H1. Taken together, these analyses suggest that
there is a clear effect of hangover on the boundary separation parameter.
[image:6.595.301.533.67.302.2]Non-decision time.
The analysis showed that the mean estimate for the non-decision parameter was lower in the hangover condi-tion (0.291, SE=1.54e-02) than in the control condicondi-tion (0.320, SE=8.52e-03), 95% confidence interval of differenceGrange et al.
659
(−0.059–0.0004); this difference was not statistically significant,
t(28)=−2.019 p=0.053, d=−0.38. The Bayes factor analysis (BF10=1.16) showed that the data were ~1 times more likely
under H1 than under H0, which provides no evidence for either
hypothesis. These analyses suggest that there is no clear effect of hangover on non-decision time.
Diffusion model summary
Under conditions of hangover, information processing speed (as measured by the drift rate parameter) was reduced, and response caution (as measured by the boundary separation parameter) was increased. These two parameters reflect core decision-making processes in choice RT models, so our data suggests that hangover is influencing decision making pro-cesses during performance.
General discussion
In this study, we were interested in the effect of alcohol hangover on choice RT processes. The novel approach of our study was to examine group differences across the whole distribution of RTs, and to fit a cognitive model of choice RT to the data, in an attempt to elucidate which process of RT, if any, is affected by alcohol hangover. The outcome of the analysis of median RT and stand-ard deviation of RT was clear-cut: RTs were slower and more variable in hangover conditions compared to control conditions. Thus, in our data, hangover negatively affected RT. There was no clear effect on accuracy; NHST methods showed a non-signifi-cant decrease in accuracy under hangover conditions, suggesting hangover does not influence accuracy. However, the Bayesian analysis suggests there was only anecdotal support for the null. Therefore, no firm conclusions can be drawn from this analysis.
RT distribution analysis
The ex-Gaussian analysis showed hangover affected two param-eters of the ex-Gaussian model: the sigma parameter was increased under hangover conditions, suggesting the Gaussian component of RT was more variable under hangover condition; the tau parameter was increased under hangover conditions, sug-gesting hangover RTs were more negatively skewed. The distri-bution analysis is advantageous as it examines RT performance at a higher resolution than central-tendency analysis alone (Balota and Yap, 2011). Although the parameters of the ex-Gaussian model do not map clearly onto discrete psychological processes (Matzke and Wagenmakers, 2009), in a large individual-differ-ences study, Schmiedek et al. (2007) found (via latent factors analysis) that tau parameters were strong unique predictors of working memory, reasoning, and psychometric speed, suggesting a relation between tau parameters and measures of ‘higher-level’ cognitive processing. Thus, one could be tempted to conclude that hangover is negatively affecting ‘higher-level’ cognitive pro-cesses during rapid decision making. However, as no cognitive theory underlies the ex-Gaussian distribution (Heathcote et al., 1991; Matzke and Wagenmakers, 2009), we should be conserva-tive about making such links between differences in ex-Gaussian parameters and differences in higher-level cognitive processes. However, this can be achieved with the diffusion model.
Diffusion model analysis
In an attempt to elucidate which psychological process of RT is affected by hangover, we fit a simplified ‘EZ’ version of the Ratcliff-diffusion model to our data. This analysis estimates parameters reflecting psychological processes underlying choice RT, and thus can be used to infer changes in psychological pro-cesses due to hangover. We found a clear reduction in the drift rate parameter, which reflects the rate of evidence accumulation towards a response. This parameter reflects the information pro-cessing efficiency during response selection, and thus the data suggests that hangover negatively affected information process-ing efficiency. We also found a clear increase in the boundary separation parameter, which reflects the height of the response boundary; higher boundaries reflect more cautious responding. We found no effect of hangover on the non-decision time param-eter, which reflects the time taken to perceptually encode the stimulus, and make a motor response. This analysis suggests that alcohol hangover reduces the efficiency of information process-ing (measured by the drift rate) and induces a more cautious mode of responding (measured by the boundary parameter). Interestingly, this raises the possibility that participants used a more cautious mode of responding (by raising their response cau-tion) in order to compensate for the reduced information process-ing efficiency due to hangover. The boundary separation parameter has been shown to be under the control of the partici-pant (Bogacz et al., 2010) allowing the participartici-pant to trade speed for accuracy: a situation with reduced evidence quality (e.g. from a noisy stimulus), which will produce a low drift rate, can lead to high error rates; by increasing response caution, errors are reduced because more evidence is required before a decision is committed. As such, a higher response boundary lowers the prob-ability of the evidence accumulation to reach the incorrect bound-ary (which therefore leads to higher accuracy), which would be advantageous under conditions with a reduced drift rate.
non-decision time to be faster in hangover conditions compared to control conditions. It is not clear why hangover should reduce non-decision time, but that two out of three implementations did not show a clear reduction, we are cautious about interpreting this finding. In summary, all three implementations show a clear reduction of drift rate and a clear increase in boundary separation in hangover conditions.
Relation to alcohol-intoxication studies
We note that these results of the diffusion model analysis agree to some extent with those reported by van Ravenzwaaij et al. (2012), who used the diffusion model to analyse the effects of acute-alcohol intoxication on choice RT. They found alcohol conditions decreased the drift rate parameter, and increased the non-decision time; they found no effect on the boundary separa-tion parameter (recall that we have found a clear reducsepara-tion of drift rate, a clear increase in boundary separation, and no effect on the non-decision time parameter under hangover condi-tions). Thus, both studies find clear negative effects of alcohol and hangover on information processing speed. It is not clear what explains differences between the findings of our study and that of van Ravenzwaaij et al. for the other two parameters, but we here note some possibilities. First, there is no reason to nec-essarily expect to find similar patterns of data in hangover con-ditions as you find during periods of acute alcohol intoxication; thus, the absence of alcohol intoxication in our participant groups may be sufficient to explain the discrepant findings. Secondly, the study by van Ravenzwaaij et al. utilised a percep-tual-decision task, whereas our task was more memory-driven (relying on semantic knowledge of whether a presented number is lower/higher than a designated reference point); we are not aware of any study investigating whether the type of experi-mental design (i.e. perceptual vs memory-driven) affects esti-mates of model parameters. Thirdly—as far as we are aware—these two studies are the only ones to have utilised the diffusion model to address group differences in alcohol-related designs; thus, the differences in findings may be a natural ten-dency of there being no consensus of findings until a sufficient body of replication and extension has been accrued. This remains an essential area for future work to build on these stud-ies to ascertain how alcohol and hangover influence choice RT processes.
Limitations
One limitation of this study was the sizeable participant drop-out which saw only 31 of the 100 recruited individuals appear in the analyses. While on one hand it would have been prefer-able to maintain a larger proportion of recruits, on the other hand we have explained why these participants were excluded, and the study would have been weaker rather than stronger had we not made those exclusions. We might also have attempted to control for circadian typology, that is, whether participants are morning types, evening types or neither types (Prat and Adan, 2011). While the time of testing was relatively standard and at a time when hangover would be most likely (0900– 1300), should there have been an excess of evening types in our sample this might have exaggerated the extent of decre-ment observed in the hangover state.
Conclusion
This study has shown that alcohol hangover induces slower, more variable choice RT. Model analysis shows that hangover nega-tively influenced information processing efficiency and increased response caution. As information processing efficiency is a major component of response selection during performance, finding a reduction of capacity during hangover has clear implications for an individual’s performance during hangover, even when no alcohol is present in the system. The data suggests that partici-pants may compensate for this by entering a more cautious mode of responding. This may have implications for safety critical tasks such as driving, which has been shown to be negatively affected by alcohol hangover (Verster et al., 2014).
This study has also highlighted the importance of going beyond estimates of central tendency when wishing to investi-gate potential effects of alcohol hangover on choice response time. Doing so allows us to ask much richer questions. Instead of asking whether hangover affects RT, we can start to ask, and indeed answer, which cognitive process of response time is affected by alcohol hangover. Future work should build on the methods presented here via confirmatory replications (Open Science Collaboration, 2015; Wagenmakers et al., 2012) and extensions (e.g. including measures of circadian typology) so that we can begin to form a better picture of the cognitive effects of alcohol hangover.
Declaration of Conflicting Interests
The authors declared the following potential conflicts of interest with respect to the research, authorship, and/or publication of this article: The Health and Safety Laboratory is the commercial arm of the Health and Safety Executive the paper’s contents, including any opinions and/or conclusions expressed, are those of the authors alone and do not necessar-ily reflect HSE policy.
Funding
The authors disclosed receipt of the following financial support for the research, authorship, and/or publication of this article: This research was supported by EU 7th Framework Marie Curie Research Fellowship (L.O.) Project No: 301424.
Notes
1. R code of all analyses, and the raw data itself, can be down-loaded from the first author’s GitHub account, available at https://github.com/JimGrange/paperData/tree/master/ Hangover%20Response%20Times.
2. It should be noted that we find the qualitatively the same results when a more standard trimming procedure is used. Specifically, we re-ran the analysis in this section using a standard deviation trimming method by removing all RTs slower than 2.5 SDs above each participant’s mean RT for each condition, as well as all RTs faster than 150 ms. 3. We used median RT as a more conservative estimate of
Grange et al.
661
4. In exploratory analysis, we investigated whether individual differences in alcohol consumption the night before the hang-over condition (as measured by the participant’s eBAC score) correlated with the magnitude of their effects in median RT, SD RT and accuracy. Correlations between each of these DVs and were small and all non-significant. (This is also true for analyses conducted on ex-Gaussian DVs, and diffu-sion model DVs.) This analysis is shown in Supplementary Material, Appendix B. We also investigated whether alcohol-hangover symptom severity correlated with any of our DVs. Again, these correlations were small and all non-significant. This analysis is in Supplementary Material, Appendix C.
References
Anderson S and Dawson J (1999) Neuropsychological correlates of alco-holic hangover. S Afr J Sci 95: 145–147.
Balota DA and Yap J (2011) Moving beyond the mean in studies of men-tal chronometry: The power of response time distribution analysis.
Perspect Psychol Sci 20: 160–166.
Bogacz R, Wagenmakers E-J, Forstmann BU, et al. (2010) The neural
basis of the speed-accuracy tradeoff. Trends Neurosci 33: 10–16.
Heathcote A, Popiel SJ and Mewhort DJK (1991) Analysis of response
time distributions: An example using the Stroop task. Psychol Bull
109: 340–347.
Johns MW (1991) A new method for measuring daytime sleepiness: The
Epworth Sleepiness Scale. Sleep 14: 540–545.
Kruisselbrink LD, Martin KL and Megeney M (2006) Physical and psy-cho-motor functioning of females the morning after consuming low
to moderate quantities of beer. J Stud Alcohol 67: 416–420.
Lemon J, Chester G, Fox A, et al. (1993) Investigation of the “hangover” effects of an acute dose of alcohol on psychomotor performance.
Alcohol Clin Exp Res 17: 665–668.
McKinney A, Coyle K, Penning R, et al. (2012) Next day effects of
natu-ralistic alcohol consumption on tasks of attention. Hum
Psychophar-macol 27: 587–594.
McKinney A and Coyle K (2004) Next day effects of a normal night’s
drinking on memory and psychomotor performance. Alcohol
Alco-holism 39: 509–513.
Massidda D (2013) Retimes: Reaction time analysis. R Package. Avail-able at: http://CRAN.R-project.org/package=retimes (accessed 13 April 2016).
Matzke D and Wagenmakers E-J (2009) Psychological interpretation of ex–Gaussian and shifted Wald parameters: A diffusion model
analy-sis. Psychon Bull Rev 16: 798–817.
Morey RD, Rouder JN and Jamil T (2013) BayesFactor: Computation of
Bayes factors for common designs. R package.
Open Science Collaboration (2015) Estimating the reproducibility of
psychological science. Science 349: 943.
Penning R, van Nuland M, Flieveroet LAL, et al. (2010). The pathology
of alcohol hangover. Curr Drug Abuse Rev 3: 68–75.
Prat G and Adan A (2011) Influence of circadian typology on drug
con-sumption, hazardous alcohol use, and hangover symptoms.
Chrono-biol Int 28: 248–257.
Prat G, Adan A, Pérez-Pàmies M, et al. (2008) Neurocognitive effects of
alcohol hangover. Addict Behav 33: 15–23.
Prat G, Adan A and Sánchez-Turet M (2009) Alcohol hangover: A critical
review of explanatory factors. Hum Psychopharmacol 24: 259–267.
R Core Team (2013) R: A language and environment for statistical
com-puting. Vienna, Austria.
Roehrs T, Yoon J and Roth T (1991) Nocturnal and next-day effects of
ethanol and basal levels of sleepiness. Hum Psychopharmacol 6:
307–311.
Rohsenow DJ, Howland J, Arnedt JT, et al. (2010) Intoxication with bourbon versus vodka: Effects on hangover sleep and nextday
neu-rocognitive performance in young adults. Alcohol Clin Exp Res 34:
1–10.
Rouder JN, Speckman PL, Sun D, et al. (2009) Bayesian t tests for
accepting and rejecting the null hypothesis. Psychon Bull Rev 16:
225–237.
Schmiedek F, Oberauer K, Wilhelm O, et al. (2007) Individual differ-ences in components of reaction time distributions and their
rela-tions to working memory and intelligence. J Exp Psychol Gen 136:
414–429
Schweizer TA and Vogel-Sprott M (2008) Alcohol-impaired speed and accuracy of cognitive functions: A review of acute tolerance and
recovery of cognitive performance. Experimental Clinical
Psycho-pharmacology 16: 240–250
Seidl S, Jensen U and Alt A (2002) The calculation of blood ethanol
concentrations in males and females. Int J Legal Med 114: 71–77.
Stephens R, Grange JA, Jones K, et al. (2014) A critical analysis of alco-hol hangover research methodology for surveys or studies of effects
on cognition. Psychopharmacology 231: 2223–2236.
Streufert S, Pogash R, Baig D, et al. (1995) Alcohol hangover and
mana-gerial effectiveness. Alcohol Clin Exp Res 19: 1141–1146.
Van Ravenzwaaij D, Dutilh G and Wagenmakers E-J (2012) A diffusion model decomposition of the effects of alcohol on perceptual decision
making. Psychopharmacology 219: 1017–1025.
Van Ravenzwaaij and Oberauer (2009). How to use the diffusion model: Parameter recovery of three methods: EZ, fast-dm, and DMAT.
J Math Psychol 53: 463–473.
Verster JC, Bervoets AC, de Klerk S, et al. (2014) Effects of alcohol
hangover on simulated highway driving performance.
Psychophar-macology 231: 2999–3008.
Verster JC, Stephens R, Penning R, et al. (2010) The alcohol hangover research group consensus statement on best practice in alcohol
hang-over research. Curr Drug Abuse Rev 3: 116–126.
Verster JC, van Duin D, Volkerts ER, et al. (2003) Alcohol hangover effects on memory functioning and vigilance performance after an
evening of binge drinking. Neuorpsychopharmacology 28: 740–746.
Voss A, Nagler M and Lerche V (2013) Diffusion models in
experimen-tal psychology: A practical introduction. Exp Psychol 60: 385–402.
Wabersich D and Vanderckhove J (2014) The RWiener package: An R package providing distribution functions for the Wiener diffusion model. R J 6: 49–56.
Wagenmakers E-J (2007) A practical solution to the pervasive problems
of p-values. Psychon Bull Rev 14: 779–804.
Wagenmakers E-J (2009) Methodological and empirical developments
for the Ratcliff diffusion model of response times and accuracy. Eur
J Cogn Psychol 21: 641–671.
Wagenmakers E-J, van der Maas HLJ, Dolan C, et al. (2008) EZ does
it! Extensions of the EZ-diffusion model. Psychon Bull Rev 15:
1229–1235.
Wagenmakers E-J, van der Maas HLJ and Grasman RPPP (2007) An
EZ-diffusion model for response time and accuracy. Psychon Bull
Rev 14: 3–22.
Wagenmakers E-J, Wetzels R, Borsboom D, et al. (2012) An agenda for