The effect of intracortical bone pin
application on kinetics and tibiocalcaneal
kinematics of walking gait
Maiwald, C, Arndt, A, Nester, CJ, Jones, R, Lundberg, A and Wolf, P
http://dx.doi.org/10.1016/j.gaitpost.2016.10.023
Title The effect of intracortical bone pin application on kinetics and tibiocalcaneal kinematics of walking gait
Authors Maiwald, C, Arndt, A, Nester, CJ, Jones, R, Lundberg, A and Wolf, P
Type Article
URL This version is available at: http://usir.salford.ac.uk/41197/
Published Date 2016
USIR is a digital collection of the research output of the University of Salford. Where copyright permits, full text material held in the repository is made freely available online and can be read, downloaded and copied for noncommercial private study or research purposes. Please check the manuscript for any further copyright restrictions.
The effect of intracortical bone pin application on
kinetics and tibiocalcaneal kinematics of walking gait
Christian Maiwald
Institute of Human Movement Science and Health, Technische Universität Chemnitz, Chemnitz, Germany
Anton Arndt
The Swedish School of Sport and Health Sciences (GIH), Stockholm, Sweden, and Karolinska Institute, Stockholm,
Sweden
Chris Nester,
School of Health Sciences, University of Salford, Salford, UK
Richard Jones,
School of Health Sciences, University of Salford, Salford, UK
Arne Lundberg,
Karolinska Institute, Stockholm, Sweden
Peter Wolf,
Abstract
Bone anchored markers using intracortical bone pins are one of the few available methods for
analyzing skeletal motion during human gait in-vivo without errors induced by soft tissue artifacts.
However, bone anchored markers require local anesthesia and may alter the motor control and
motor output during gait. The purpose of this study was to examine the effect of local anesthesia
and the use of bone anchored markers on typical gait analysis variables. Five subjects were
analyzed in two different gait analysis sessions. In the first session, a protocol with skin markers
was used. In the second session, bone anchored markers were added after local anesthesia was
applied. For both sessions, three dimensional infrared kinematics of the calcaneus and tibia
segments, ground reaction forces, and plantar pressure data were collected. 95% confidence
intervals and boxplots were used to compare protocols and assess the data distribution and data
variability for each subject. Although considerable variation was found between subjects,
within-subject comparison of the two protocols revealed non-systematic effects on the target variables.
Two of the five subjects walked at reduced gait speed during the bone pin session, which explained
the between-session differences found in kinetic and kinematic variables. The remaining three
subjects did not systematically alter their gait pattern between the two sessions. Results support the
hypothesis that local anesthesia and the presence of bone pins still allow a valid gait pattern to be
analyzed.
Keywords
gait analysis; bone anchored markers; walking; kinematics; ground reaction forces; plantar
pressures.
Introduction
Over the past decades, marker-based optoelectronic stereophotogrammetry has become a standard
locomotion. However, the limitations of skin based marker placement (SKIN), especially the
presence of soft tissue artifacts, are well-known [1]. Bone anchored markers using intracortical
bone pins (PIN) are considered to be one of the few available methods for analyzing skeletal motion
of the lower extremity in-vivo without errors induced by soft tissue artifacts. Another appealing
advantage of PIN over SKIN is the fact that bony structures of the foot and ankle can be analyzed
that are either too small for valid marker placement, suffer from heavy skin movement artifacts, or
are inaccessible by surface markers, e. g. the navicular or the talus. Other techniques of
image-based kinematic analyses, like magnetic resonance imaging, radiostereometric analysis or
fluoroscopy, are currently only capable of capturing static or slow dynamic situations and thus may
not be feasible for analyzing human locomotion.
The most evident drawback of PIN is the requirement of local anesthesia and its potential effects on
motor control and motor output. Previous studies have demonstrated effects of local anesthesia on
roll-over during gait, e. g. the increase of metatarsal head loading in plantar pressure data after
applying ice to the plantar surface of the foot [2]. Furthermore, the mechanical intervention of
protruding pins anchored to the bone might interfere with the motion of tendons, ligaments, skin
and other pins applied in close proximity. Psychological effects of PIN cannot be ruled out either, as
subjects may alter their gait patterns towards a more cautious roll-over pattern and less range of
motion.
This study aimed to analyze whether the application of PIN results in altered motor output and thus,
whether PIN is a valid method for analyzing human gait. The validity of PIN can only be assured if
the magnitude and variability of human gait kinematics and kinetics are unaffected by local
anesthesia and pin application.
An experimental protocol was designed with PIN as an independent variable, and with kinematics
and kinetics collected as target variables. It was hypothesized that target variable magnitude and
variability would not differ between use of PIN and SKIN protocols.
similar PIN approach is used to analyze kinetics and kinematics during human gait [3–10].
Methods
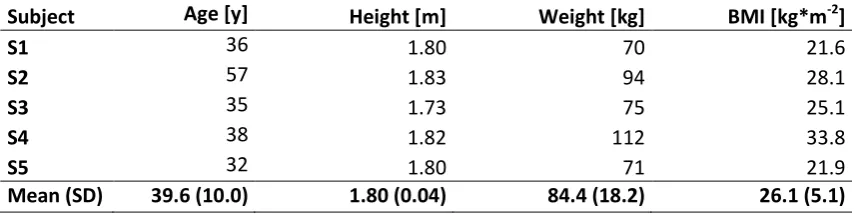
Five healthy male subjects participated in the study. Anthropometric data for each subject are listed
in Table 1. A sixth subject had to be excluded due to problems with the application of the pins.
Study procedures were approved by the local ethics committee of the Karolinska Institute,
Huddinge, Sweden.
Insert Table 1 here
Subjects were analyzed during normal walking gait in laboratory conditions, collecting kinetics and
kinematics of their movement patterns. Two measurement sessions were carried out for each subject
in the following sequence, either on the same day or on two consecutive days: during session 1
(SKIN), a marker set of skin-mounted markers was applied to the calcaneus and tibia of each
subject. Session 2 (PIN) succeeded SKIN and was conducted after local anesthetics had been
applied and intracortical bone pins had been inserted to the bony structures of the subjects’ right
foot. Hence, a combined marker set of SKIN and PIN markers was used in session 2 (see Figure 1).
The locations of SKIN markers were marked directly on subjects‘ skin to ensure the reproducible
placement of SKIN markers after pin insertion.
Insert Figure 1 here
Each subject was asked to complete 9-12 SKIN and at least 20 PIN walking gait trials. Data were
collected while subjects walked on a 9.5 m walkway at their self-selected pace.
sampling at 240 Hz. Kinetics were captured by a force plate (Kistler, Winterthur, Switzerland, 960
Hz, sync to Kinematics) and a pressure distribution platform (Emed, Novel, Munich, Germany, 50
Hz), which were mounted flush with the walkway and approximately 1 m apart from each other in
order to capture two consecutive foot strikes of the same foot.
Differences between SKIN and PIN were assessed by analyzing relative motion of the shank and
heel. In both conditions, four markers were attached to the calcaneus (one lateral, one medial, two
posterior) in such a way as to prevent artifacts from the motion of the calcaneal fat pad. The motion
of the shank was captured using six markers (fibular head, tibial tuberosity, middle of tibia crest,
both malleoli, and the lower lateral malleolus, see [11] for marker positions). Gaps in marker
trajectories were interpolated up to a gap size of 10 frames (42ms) using a higher order polynomial
fit. Trials featuring larger trajectory gaps were discarded.
The technical reference frame for each segment was set up during relaxed standing in a neutral foot
position, i.e., foot length axis was in parallel to the sagittal plane. The segment origin was placed at
the mean marker location of all segment markers, and axes were aligned parallel to the global
reference frame. Segment motions were calculated by matching corresponding markers across
frames according to the procedures described by [12]. This approach is robust against small
deviations of marker placement between sessions, and does not rely on any markers placed on
specific anatomical locations. Relative motion of the heel versus the shank in anatomical planes was
calculated by projecting the rotation of the heel around its helical axis onto the shank coordinate
system, accounting for the instantaneous helical axis orientation.
The range of motion (ROM) in three anatomical planes during the stance phase of subjects’ gait was
calculated as the target variable in order to allow for simple interpretation and comparison of the
obtained results to other studies [3,11,13]. The stance phase was determined by setting a 10 N
threshold on the Kistler force plate. Since the EMED platform was not synchronized to the
kinematic system, the second stance phase was detected based on a local extremum of the
Two local maxima (Fz2 and Fz4) and one local minimum (Fz3) [15,16], as well as their relative
timing (Fz2_t, Fz3_t, Fz4_t), and ground contact time (GCT) were calculated from force plate data.
Gait speed was calculated based on the distance between two consecutive foot strikes, which was
determined from the average positions of all heel markers. Kinematic data and force plate data were
processed using custom-written Matlab software (The Math Works, Natick, USA).
Plantar pressures were recorded using the EMED AT platform (4 sensors/cm², 50 Hz). Raw data
were exported to ASCII and analyzed using custom-written Matlab software as described in [17],
including the definition of anatomical regions (masks M1 through M9, see Figure 3). For the
analyses conducted in this study, the relative force-time integral (FTI) of each mask as well as the
timing of heel-off during roll-over (HO) were calculated. FTI was calculated as relative impulse of
each mask compared to the total impulse of the foot area. HO was determined as the relative point
in stance phase, at which the cumulated force of the heel sensors dropped below 10% of the total
maximum force recorded during the entire stance phase. Other studies have employed similar
variables to analyze roll-over timing based on plantar pressure data [18].
Arch regions M4 and M5 were not considered for analysis in this study, as none of the subjects’ feet
had any deformity or pathology, and thus most of the loads in M4 and M5 were near or exactly zero
for each stance phase.
Insert Figure 2 here
Due to the small sample size and the explorative nature of this study, we did not conduct any
statistical testing. Instead, 95%-confidence intervals (upper bound: up95, lower bound: lo95) for the
mean of each variable and condition were calculated from sample data. Data distribution and
variance were assessed graphically using boxplots.
Non-overlapping confidence bounds for SKIN and PIN indicate possible differences between the
respective variable, which– due to the small sample of our dataset – was synthesized from other
studies involving larger samples. As long as differences between SKIN and PIN did not exceed the
expected random fluctuations of repeated measurements of a variable, they were considered
practically irrelevant [19].
Results
Technical problems caused missing values for some of the subjects (kinematics: trajectory gaps in
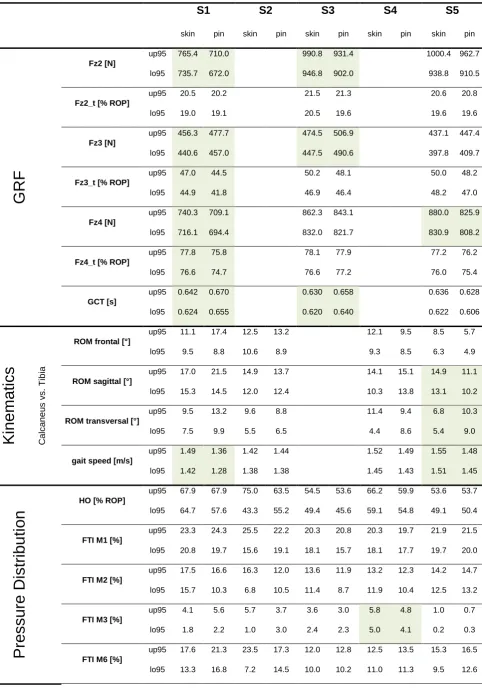
S3, GRF: operator faults in S2 & S4). Table 2 contains the 95%-confidence bounds for all variables.
Non-overlapping bounds are shaded grey. Figure 3 depicts the distribution of GRF data as an
example.
Insert Table 2 here
None of the collected variables indicated systematic differences between SKIN and PIN conditions
across all subjects. Differences in GRF were aggregated for S1, and kinematic differences
aggregated for S5. These cases will be discussed in the following section. All other differences
appeared to occur randomly and in a non-systematic manner.
Insert Figure 3 here
Discussion
The aim of this study was to investigate the influence of intracortical bone pins on the kinematics
and kinetics of walking gait. GRF, plantar pressures, and 3D kinematics were measured with and
without intracortical bone pins applied to the subjects’ foot and shank, and compared between
conditions. We hypothesized that the presence of pins would not systematically alter subjects’ gait
was available for analysis.
The results of these five subjects do not indicate a systematic effect of intracortical bone pins on the
gait pattern during walking. Subjects 1 and 5 effectively reduced their gait speed after pin
application, which explains the reduced excursion of vertical GRF curves, especially at Fz4. The
pattern of GRF changes observed in our data was similar across subjects (lower Fz2 and Fz4 &
larger Fz3 and GCT for PIN). This can be interpreted as a less pronounced foot strike and a more
cautious stance phase in the PIN condition and may be directly linked to gait speed [20]. Relative
timing of GRF variables was only marginally influenced by PIN.
Effects of PIN on kinematic data appear to be less uniform. Only the data of S5 indicate an increase
of transversal and a decrease of sagittal ROM in the PIN condition. The remaining subjects’ data
indicate a substantial amount of variability across trials even within conditions. However, similar
effects have been observed in other studies [11] and may mask smaller, but more systematic effects.
Being smaller than the normal variation we assume these are incidental and do not compromise the
validity of the kinematic data.
Plantar pressure distributions did not indicate any systematic effect between SKIN and PIN. Only
the increase of medial forefoot loading in S3 corresponded to the interpretation of GRF data that
subjects tend to demonstrate a more cautious gait pattern in PIN.
In summary, PIN induced a systematically decreased gait dynamic in one of our subjects (S1).
Across all subjects, effects on kinetics were consistently lower than 5% (20-30 N vertical GRF, 1%
ROP in timing variables, 1% of relative FTI). These effect magnitudes were considered subtle,
compared to the random fluctuations expected from repeated measures in this type of experimental
design [21,22]. The most prominent differences between SKIN and PIN occurred in kinematic data
with up to 25% of ROM (~2-3°). In light of the more variable nature of kinematic data, the
SKIN-PIN differences in our data were considered small, based on the amount of variation to be expected
from repeated trials collected with a similar protocol, but with only skin markers attached [11].
irrelevant given the limiting factors of experimental protocols in laboratory gait analysis.
The size of the 95%-confidence-intervals as well as the size of the box-plots indicate that SKIN and
PIN conditions caused the same amount of variability in the recorded data, for most of the subjects
and most of the collected variables. Based on this observation, we did not find evidence for a less
reliable, less secure or less stable gait in the PIN condition.
Therefore, the data of our study support our hypothesis that there is no difference in gait between
SKIN and PIN conditions. A similar result was already observed for slow running gait by [3]. Both
studies support the assumption that intracortical bone pins and local anesthesia still allow for a valid
gait pattern to be analyzed.
Moreover, the authors think that the increasing availability of studies on the reliability of classic
gait analyses causes a more general problem with these kinds of protocols: biomechanical data
collected during human locomotion contains substantial amounts of variability across repeated
trials, which statistically override the smaller systematic effects that researchers aim to observe
when they conduct studies involving gait analyses. This phenomenon does not appear to be causally
linked to invasive bone pin application. Gait variability appears to be a more generic feature of
human motor performance, and becomes especially problematic when gait analysis protocols are
conducted in a laboratory environment with a limited number of foot strikes to be captured and
analyzed [23].
In the past, studies involving intracortical bone pins have not been conducted with sample sizes that
would allow the generalization of the observed effects. Since a non-random sample was recruited in
our study, its scope is of a predominantly descriptive nature. External validity may seem limited
with such protocols. However, the benefit of applying invasive bone pins can be found in their
contribution to the inductive reconstruction of theories about the kinematic mechanisms of bony
structures, e. g. the amount of bony movement within the upper and lower ankle joints during gait
[3]. Results of bone pin studies may be unexpected at first and specific to a small group of
Conclusion
The results of this study suggest that intracortical bone pins applied under local anesthesia do not
alter subjects’ gait patterns in a systematic way. Data of gait analysis protocols using intracortical
bone pins should therefore be comparable to protocols using skin mounted markers.
Acknowledgements
The authors would like to thank Qualysis AB for providing the cameras for the study. Financial
assistance was received from the Swiss National Science Foundation and the Karolinska Institute’s
Research Fund. We would also like to thank Lisa C. Peterson for her linguistic assistance with the
manuscript.
Conflict of interest statement
References
[1] Leardini A, Chiari L, Della Croce U, Cappozzo A. Human movement analysis using
stereophotogrammetry. Part 3. Soft tissue artifact assessment and compensation. Gait & posture
2005;21(2):212–25.
[2] Nurse MA, Nigg BM. The effect of changes in foot sensation on plantar pressure and muscle
activity. Clinical biomechanics (Bristol, Avon) 2001;16(9):719–27.
[3] Arndt A, Wolf P, Liu A, Nester C, Stacoff A, Jones R et al. Intrinsic foot kinematics measured
in vivo during the stance phase of slow running. Journal of biomechanics 2007;40(12):2672–8.
[4] Stacoff A, Reinschmidt C, Nigg BM, Van Den Bogert, A J, Lundberg A, Denoth J et al. Effects
of foot orthoses on skeletal motion during running. Clinical biomechanics (Bristol, Avon)
2000;15(1):54–64.
[5] Stacoff A, Reinschmidt C, Nigg BM, Van Den Bogert, A J, Lundberg A, Denoth J et al. Effects
of shoe sole construction on skeletal motion during running. Medicine and science in sports
and exercise 2001;33(2):311–9.
[6] Nester C, Jones RK, Liu A, Howard D, Lundberg A, Arndt A et al. Foot kinematics during
walking measured using bone and surface mounted markers. Journal of biomechanics
2007;40(15):3412–23.
[7] Lundgren P, Nester C, Liu A, Arndt A, Jones R, Stacoff A et al. Invasive in vivo measurement
of rear-, mid- and forefoot motion during walking. Gait & posture 2008;28(1):93–100.
[8] Wolf P, Stacoff A, Liu A, Nester C, Arndt A, Lundberg A et al. Functional units of the human
foot. Gait & posture 2008;28(3):434–41.
[9] Liu A, Nester CJ, Jones RK, Lundgren P, Lundberg A, Arndt A et al. Effect of an antipronation
foot orthosis on ankle and subtalar kinematics. Medicine and science in sports and exercise
2012;44(12):2384–91.
[10] Arndt A, Lundgren P, Liu A, Nester C, Maiwald C, Jones R et al. The effect of a midfoot cut in
2013;5(1):63–9.
[11] Wolf P, List R, Ukelo T, Maiwald C, Stacoff A. Day-to-Day consistency of lower extremity
kinematics during walking and running. Journal of applied biomechanics 2009;25(4):369–76.
[12] Challis JH. A procedure for determining rigid body transformation parameters. Journal of
biomechanics 1995;28(6):733–7.
[13] Arndt A, Westblad P, Winson I, Hashimoto T, Lundberg A. Ankle and subtalar kinematics
measured with intracortical pins during the stance phase of walking. Foot & ankle international
2004;25(5):357–64.
[14] O'Connor CM, Thorpe SK, O'Malley MJ, Vaughan CL. Automatic detection of gait events
using kinematic data. Gait & posture 2007;25(3):469–74.
[15] Stüssi E, Debrunner HU. Parameter-Analyse des menschlichen Ganges. Biomedizinische
Technik/Biomedical Engineering 1980;25(s1):222–4.
[16] Stacoff A, Diezi C, Luder G, Stüssi E, Kramers-de Quervain IA. Ground reaction forces on
stairs: effects of stair inclination and age. Gait & posture 2005;21(1):24–38.
[17] Maiwald C, Grau S, Krauss I, Mauch M, Axmann D, Horstmann T. Reproducibility of plantar
pressure distribution data in barefoot running. Journal of applied biomechanics 2008;24(1):14–
23.
[18] Cock A de, Clercq D de, Willems T, Witvrouw E. Temporal characteristics of foot roll-over
during barefoot jogging: reference data for young adults. Gait & posture 2005;21(4):432–9.
[19] Maiwald C, Axmann D, Grau S. Measurement error in footwear research biomechanics.
Footwear Science 2011;3(2):117–24.
[20] Chiu M, Wang M. The effect of gait speed and gender on perceived exertion, muscle activity,
joint motion of lower extremity, ground reaction force and heart rate during normal walking.
Gait & posture 2007;25(3):385–92.
[21] Reed LF, Urry SR, Wearing SC. Reliability of spatiotemporal and kinetic gait parameters
2013;14:249.
[22] Putti AB, Arnold GP, Cochrane LA, Abboud RJ. Normal pressure values and repeatability of
the Emed ST4 system. Gait & posture 2008;27(3):501–5.
[23] Oriwol D, Milani TL, Maiwald C. Methodological issues associated with the mean value of
Table 1: Anthropometric data for all five subjects
Subject Age [y] Height [m] Weight [kg] BMI [kg*m-2]
S1 36 1.80 70 21.6
S2 57 1.83 94 28.1
S3 35 1.73 75 25.1
S4 38 1.82 112 33.8
S5 32 1.80 71 21.9
Table 2: Overview of GRF, kinematics, and plantar pressure data of all five subjects
S1 S2 S3 S4 S5
skin pin skin pin skin pin skin pin skin pin
G
R
F
Fz2 [N]
up95 765.4 710.0 990.8 931.4 1000.4 962.7
lo95 735.7 672.0 946.8 902.0 938.8 910.5
Fz2_t [% ROP]
up95 20.5 20.2 21.5 21.3 20.6 20.8
lo95 19.0 19.1 20.5 19.6 19.6 19.6
Fz3 [N]
up95 456.3 477.7 474.5 506.9 437.1 447.4
lo95 440.6 457.0 447.5 490.6 397.8 409.7
Fz3_t [% ROP]
up95 47.0 44.5 50.2 48.1 50.0 48.2
lo95 44.9 41.8 46.9 46.4 48.2 47.0
Fz4 [N]
up95 740.3 709.1 862.3 843.1 880.0 825.9
lo95 716.1 694.4 832.0 821.7 830.9 808.2
Fz4_t [% ROP]
up95 77.8 75.8 78.1 77.9 77.2 76.2
lo95 76.6 74.7 76.6 77.2 76.0 75.4
GCT [s]
up95 0.642 0.670 0.630 0.658 0.636 0.628
lo95 0.624 0.655 0.620 0.640 0.622 0.606
K
inem
ati
c
s
C al c a neu s v s . T ibi aROM frontal [°]
up95 11.1 17.4 12.5 13.2 12.1 9.5 8.5 5.7
lo95 9.5 8.8 10.6 8.9 9.3 8.5 6.3 4.9
ROM sagittal [°]
up95 17.0 21.5 14.9 13.7 14.1 15.1 14.9 11.1
lo95 15.3 14.5 12.0 12.4 10.3 13.8 13.1 10.2
ROM transversal [°]
up95 9.5 13.2 9.6 8.8 11.4 9.4 6.8 10.3
lo95 7.5 9.9 5.5 6.5 4.4 8.6 5.4 9.0
gait speed [m/s]
up95 1.49 1.36 1.42 1.44 1.52 1.49 1.55 1.48
lo95 1.42 1.28 1.38 1.38 1.45 1.43 1.51 1.45
P
res
s
ur
e Di
s
tr
ibu
ti
on
HO [% ROP]
up95 67.9 67.9 75.0 63.5 54.5 53.6 66.2 59.9 53.6 53.7
lo95 64.7 57.6 43.3 55.2 49.4 45.6 59.1 54.8 49.1 50.4
FTI M1 [%]
up95 23.3 24.3 25.5 22.2 20.3 20.8 20.3 19.7 21.9 21.5
lo95 20.8 19.7 15.6 19.1 18.1 15.7 18.1 17.7 19.7 20.0
FTI M2 [%]
up95 17.5 16.6 16.3 12.0 13.6 11.9 13.2 12.3 14.2 14.7
lo95 15.7 10.3 6.8 10.5 11.4 8.7 11.9 10.4 12.5 13.2
FTI M3 [%]
up95 4.1 5.6 5.7 3.7 3.6 3.0 5.8 4.8 1.0 0.7
lo95 1.8 2.2 1.0 3.0 2.4 2.3 5.0 4.1 0.2 0.3
FTI M6 [%]
up95 17.6 21.3 23.5 17.3 12.0 12.8 12.5 13.5 15.3 16.5
FTI M7 [%]
up95 31.6 35.3 34.6 31.2 27.5 30.3 29.4 31.3 36.3 35.0
lo95 30.3 29.3 20.8 29.1 26.2 28.3 27.0 29.2 33.9 33.2
FTI M8 [%]
up95 7.3 6.3 20.0 14.3 20.7 22.5 13.4 13.1 14.9 12.5
lo95 4.0 2.8 5.6 12.3 18.2 16.2 10.3 10.7 9.7 9.4
FTI M9 [%]
up95 7.3 5.9 18.0 4.9 7.7 9.2 8.0 8.8 6.8 5.9
Figure captions
Figure 1: Marker setup of SKIN and PIN markers involving the foot and tibia.
Figure 2: Division of the plantar pressure signal into 9 subareas as described in [16].
Figure 3: Boxplots of GRF variables. Small numbers above boxplots indicate the number of