International Journal of Emerging Technology and Advanced Engineering
Website: www.ijetae.com (ISSN 2250-2459, ISO 9001:2008 Certified Journal, Volume 5, Issue 7, July 2015)
184
Stability of Protection Layer at Downstream of Major Hydraulic
Structures
Ebtehal Sayed Mohamed
1, Osama K.S
2, Ahmed Mohamed Hassan Mirdan
3, Abdel-Azim M.Ali
4 1,3Civil Engineering Dept, Faculty of Engineering, Port Said University & Egypt2Prof. of hydraulics, Zagazig University, zagazig & Egypt
4Hydraulic Research Institute, National Water Research Center, Cairo & Egypt
Abstract—In terms of the importance of stilling basins in Egypt, this research was initiated with the impartial of investigating the stability of bed protection at their downstream “D.S”. An undistorted 3-D physical model was constructed for Assuit New Barrage (ANB) with a scale of 1:45. A riprap with a mean particle diameter of 16 mm was placed at the D.S. of the spillway of ANB. Thirty (30) experiments were carried out. Different discharges (13) were investigated (i.e. 51.53-515.3 l/sec corresponding to 700-7000 m3/sec in the prototype). The effect of the number of gates was studied (i.e. 2 to 8 gates). Measurements were undertaken, analysed and compared to the results of different formulae. The obtained results indicated that the riprap was unstable in case of discharges more than 40.5 L/s/gate (i.e. 2 to 3 gates were opened).
Keywords— Riprap Hydraulic force Incipient motion
-Stilling basin - physical model.
I. INTRODUCTION
Stilling basins are used when designing heading-up hydraulic structures such as barrages, dam, weirs…..etc. They are energy dissipaters that are provided at D.S. Riprap is simultaneously added at the D.S. of stilling basin that is widely used to stabilize and protect the river bed. It is defined as a layer of protective mound of stones that are randomly placed.
Many researchers investigated stilling basins and ripraps, among them are Osama (1995) and Seyed Morteza et al (2008). However; this research investigates the bed protection (riprap) DS. the stilling basin where Assuit New Barrage was taken a case study where several investigation phases were implemented.
This paper presents the investigation phases, under the following headlines:
Literature review Problem definition Case study
Field visits and data accumulation Physical model
Experimental runs
Measurements
Experimental procedure Results analysis and discussions Conclusions and recommendations
II. LITERATURES REVIEW
Primarily, literature was reviewed in the field of stilling basins from which it was clear that many researchers investigated barrages, stilling basins and riprap. For example:
Anderson [1] investigated the effect of riprap grading experimentally. He stated that in order to fill the gaps between the larger particles the layer thickness should prevent the attack on the base material and should be appreciably less than riprap material.
Simons and Senturk [2] suggested that with a well distributed size range, the interstices formed by the larger particles are filled with the smaller sizes preventing formation of open pockets which affect the stability of the riprap layer. The ratio of maximum size to median size D50
should be approximately two.
nieb [3] mentioned that the protective layer will be increasingly stable as the layer thickness conforms the relationship between riprap stability and thickness of riprap layer. Thickness should satisfy “Tmin=1.5*D100”where Tmin
is the minimum riprap thickness.
Isbash [4], Mavis [5], USBR [6], Graf [7], Römisch [8], and Osama [9] reported that the stable stone mean diameter is calculated by using different formulae.
Isbash [4] developed an equation for stone movement
Vav= C (1)
Mavis et al. [5] published an equation for the competent bottom velocity. Data from about 400 tests were analyzed. The resulting equation is:
International Journal of Emerging Technology and Advanced Engineering
Website: www.ijetae.com (ISSN 2250-2459, ISO 9001:2008 Certified Journal, Volume 5, Issue 7, July 2015)
185
USBR [6] developed a formula in order to investigate the maximum size of riprap mixture downstream of stilling basin. The different formulae related the stable mean stone diameter with the mean/bottom velocity, as follows:
Vb= 4.97 (British unit) (3)
The stone size D100 is equal to double D50.
D50 = (Vb /3.88)2 (Metric unit) (4)
Graf [7] correlated the bed velocity with the bed particle diameter as:
Vb= 4 (5)
Römisch, K. et al. [8] formulated the stability coefficient “B'” to study the stability of riprap particles remembering that the stability of riprap downstream of a stilling basin depends on both velocity and turbulence level:
B' = (6)
Osama [9] suggested that the value of modified Froude number gives the following relation between bed velocity vb and bed particle D50:
vb = 4.32 (7)
Seyed, et al. [10] studied the incipient condition of riprap protection at the end of a stilling basin at downstream of a sluice gate. Flows with and without hydraulic jump were tested where eight different river gravel sizes were used as riprap grains (i.e. 8.75 to 47.5 mm). The experiments were conducted with different gate openings. The results showed that at a constant discharge, the incipient flow depth decreases as the riprap size increased.
III. PROBLEM DEFINITION
Assiut Barrage was efficiently operating under a maximum head difference of 4.2 m but seepage and uplift pressure under the barrage increased. This is attributed to the fact that the river bed degraded at the D.S. after commissioning Aswan High Dam in 1968 which would most probably affect the lifetime of the barrage. It is now facing major problems related to ageing. Consequently, the Ministry of Water Resources and Irrigation (MWRI) decided to replace the existing barrage with a new barrage. Accordingly, the feasibility of constructing ANB should be initiated.
New designs were set for barrages considering the large span vents, bottom-dropped aprons, and several contracted flow fields. For example, according to the recent designs, Esna New Barrage that was constructed in 1994, Naga Hammadi New Barrage was constructed in 2008, Zefta Old Barrage and Delta Old Barrages were replaced with new barrages.
IV. CASE STUDY
Assuit Barrage was taken as a case study. It is located across the Nile River at Assiut and was constructed 530 km D.S. of Aswan. It was completed in 1902. The existing barrage was designed as an arched viaduct on a masonry floor with a 16.0 m lock width positioned at the left bank. The overall length of the structure is 800 m with 110 vents of 5 m with double leaf vertical lift roller gate designed for a maximum head difference of 4.2 m.
ANB and the hydropower plant will comprise three main components. These are the hydropower plant with 4 units of bulb turbines, spillway equipped with 8 radial gates each 17 m wide and a double chamber navigation lock of 160 m long and 17 m wide. During construction, flow will be diverted through parts of the existing barrage structure in a two or, potentially, three-phase operation. ANB would provide an increase in the allowed head, allowing more water discharges into Ibrahimiya Canal and will improve navigation conditions. Moreover; it will include a low head hydropower plant providing about 40 Megawatts.
V. FIELD VISITS AND DATA ACCUMULATION
Field visits were carried out to perceive a complete picture about the site. Data was accumulated and analysed. From the accumulated data, it was apparent that scour problems were evident at the D.S. of barrages.
VI. PHYSICAL MODEL
Due to scour problems D.S. barrages, a physical model was designed and constructed in the experimental hall of Hydraulic Research Institute (HRI) (i.e. The area of laboratory hall is 100 m x 40 m from wall to the other wall). The model is undistorted model with scale 1:45. Moreover; calibration was executed. Thirty (30) tests were conducted for one type of riprap soil. The used size of riprap particle is 0.72 m (Prototype).
International Journal of Emerging Technology and Advanced Engineering
Website: www.ijetae.com (ISSN 2250-2459, ISO 9001:2008 Certified Journal, Volume 5, Issue 7, July 2015)
186
The model included El-Walideya power plant intake and discharge structures. In addition Ibrahimia Canal was modelled as far as the head regulator structure (a distance of about 350 m). The model consisted of three parts; the entrance, the reach, and the exit. The model included all structural barrage components i.e. existing barrage sluiceway, new and existing navigation lock, new barrage, sluiceway, closure dam and HPP.
The model entrance was made of 0.25 m thick brick wall covered with 0.02 m cement mortar mixed with chemical isolated materials to prevent seepage from the model. The entrance has suitable dimension to evacuate the discharge from the pump. At the beginning of the model, there is a weir followed by bars of wood to distribute the incoming flow to the entire model width.
The modeled reach included all the prototype conditions. The bed of the model and the banks was made of cement mortar with thickness of 0.10 m. The cross section in the study area was scaled and inserted in the model and levelled. The area between the cross sections was filled with mortar layer. The Assuit New Barrage and the Hydropower Plant comprised three main components; navigation locks, Hydropower Plant with 4 units of bulb turbines and spillway. The spillway equipped with 8 vents each 17 m wide. Each vent is equipped by bras radial gate with a radius of 12 m is used to regulate the flow, figure 1. A hand driven gearbox controlled the radial gate opening. The gear system composed of a vertical and horizontal level gears. The vertical gear is engaged with a steel rod and a handle. The gate closes or opens by moving the handle and the gate opening was measured by using a vertical scale. A sill under the radial gate was used and the distance between sill under the radial gate and the apron was 4.6 m (prototype) followed by an inclination apron with slope 1:1.74 (30º) (the middle apron) and the rear apron with a horizontal length of 6.5 cm (Model) from the downstream nose of the piers. The sill under the gate was raised to an elevation of (41.60) (fore apron) in the prototype. There is an end step with an elevation of (38.50) in the prototype. The overall design length of the stilling basin is 1.97 m (Model) 88.65 m (prototype). The hydraulic structure model made of wood. This wood was painted very well by a waterproof material (plastic) to prevent wood from changing its volume by absorbing water.
The model exit consisted of the tailgate with length of 9.50 m to fit with the last cross section in the model. The tailgate is used to adjust the water level in the model and is made of 5 mm rectangular steel plate and hinged from bottom to provide an adjustable inclination which is installed at the downstream end of the model to control the D.S.tailwater depth.
The model is provided with a re-circulating system. There are two centrifugal pumps with different capacities; of 500 L/s for each of them. These two pumps are connected with two pipelines 10 inches for each. The maximum feeding capacity of the system is 1 m3/s (1000 L/s).
The model bed U.S. and D.S. the barrage was covered by a movable bed. U.S. Assuit New Barrage is followed by a 7.16 m (Model) (representing 322 m in the prototype). This part was covered by riprap, figure 2. The riprap layer is 8.9 m long in the model (representing 400 m in the prototype) and is placed just D.S. the solid apron at the left and the right side of the spillway, figure 3.
The minimum riprap thickness ranged between twice to three times the mean stone diameter. The downstream is shaped to distribute the flow uniformly. The geometric mean diameter of the riprap layer D50 is equal to 16.0 mm.
It should be mentioned that the riprap was analyzed in HRI laboratory. The same type of riprap was used in all the tests. Table 1 shows the characteristics of the riprap layer. The grain size distribution curves for type R1, figure 4.
TABLEI
CHARACTERISTICS OF THE DESIGNED RIPRAP PROTECTION
Material
characteristics D15 (mm) D50 (mm) D85 (mm)
R1 7.76 15.51 31
R2 6 12 24
R3 4.11 8.2 16.4
R4 2.8 5.6 11.2
R5 1.8 3.6 7.2
VII. EXPERIMENTAL RUNS
Different scenarios were experimentally tested. Thirteen (13) different discharges were tested. Table 2 provides the experimental work program. The discharge was changed (i.e. 700-7000 m3/sec in prototype and 51.53-515.3 L/sec in model).
VIII. MEASUREMENTS
The model was equipped by many measuring devices and measurements were undertaken. For example:
An electromagnetic flow-meter was used for
International Journal of Emerging Technology and Advanced Engineering
Website: www.ijetae.com (ISSN 2250-2459, ISO 9001:2008 Certified Journal, Volume 5, Issue 7, July 2015)
187
Electromagnetic current-meter type EMS,
manufactured by Delft Hydraulic, Holland, was used to measure the flow velocity profiles at two cross sections D.S. the stilling basin.
Point gauges were used to adjust the water level at
the U.S. and D.S. gates.
Digital camera was used for recording the scour
downstream the apron.
The velocity was measured at two cross sections 1 and 2, photo 2. Cross section 1 is located at the concrete slab end of the stilling basin at a distance of 1.96 m in the model from the beginning of the nose of pier to the end of apron. Cross section 2 is located at the end of the abutments of the spillway at distance 0.64 m in the model from the end of the concrete slab. Riprap layer extends along the bed of the model. The velocity values were measured at four points in the vertical direction along the water depth at relative distances from the surface of 0.2, 0.6, 0.8 and 0.9 of total water depth to represent the vertical velocity profile. The velocity values are measured at 0.9 of the total water depth to represent velocity values near to bed
.
IX. EXPERIMENTAL PROCEDURE
The fixed tailgate at the end of the model was used to control the tail-water depth at D.S. of ANB. The variables during the tests were the passing discharge, gate opening and water levels U.S. so as D.S., table 2. Test procedure was performed in steps, as follows:
1.Bed protection level D.S. the apron was adjusted at the same level as the apron. The layers were colored each 20 cm in order to investigate the movement of any particle.
2.A gate opening was adjusted partially opening with normal discharge and the gate opening fully opens at higher discharge, then a selected discharge was allowed to pass.
3.The reservoir was filled with clear water.
4.The pump was operated. The flow was adjusted by the control valve and measured by an electromagnetic flowmeter.
5.The model was filled with water from U.S. and D.S. with low rate to prevent bed particle form movement. 6.The U.S., D.S. water depths and gate opening were
adjusted to the required test condition.
7.After the model adjustment, the following measurements were carried out: velocity measurements in cross section 1 and 2 and the bed particles movements were observed.
8. The experimental time was selected to be 4 hours. 9. The above steps were repeated (i.e. 1 to 8) for every
tested discharge, tail-water level and number of opened gates to obtain the required parameters.
Photo (1): Layout of Assiut New Barrage
Figure (1): Longitudinal Section of Typical Spillway
[image:4.612.332.558.175.334.2] [image:4.612.323.564.534.667.2]International Journal of Emerging Technology and Advanced Engineering
Website: www.ijetae.com (ISSN 2250-2459, ISO 9001:2008 Certified Journal, Volume 5, Issue 7, July 2015)
188
Figure (4): Sieve Analysis of Riprap Materials (Type R1).
Photo (2): The location of the velocity measurements at D.S.Left & Right Spillway
TABLEIII
[image:5.612.333.551.147.491.2] [image:5.612.65.273.276.436.2]International Journal of Emerging Technology and Advanced Engineering
Website: www.ijetae.com (ISSN 2250-2459, ISO 9001:2008 Certified Journal, Volume 5, Issue 7, July 2015)
189
X. RESULTS ANALYSIS AND DISCUSSIONS
The stability of the protection layer downstream the barrage was studied by checking the used particle mean diameter D50 D.S. Assiut New barrage. The grain size
stability of the protection layer D.S. Assiut New Barrage is checked against the mean/bottom velocity. The experimental results for the 30 experiments with constant mean particle diameter D50=1.6 cm were compared to the
results of six different formulae in order to calculate the stable mean stone diameter against the mean/bottom velocity.
Model results were subdivided into two categories the first category covers the discharges up to maximum normal discharge and the second category covers range of discharges higher than the normal discharges.
A. Results Analysis And Discussions For Category 1
The discharge ranged between 700 and 2900 m3/sec to study the stability of riprap D.S. Assiut barrage. This section encompasses two cases the first case is of low discharge per vent and the second part is of medium discharge per vent, as follows:
First case:
The first twelve tests together with test 15 were executed under the following conditions:
Discharges were 700-1800 m3/s and the minimum number of opened gates was three.
Discharges were 700-2200 m3/s and the minimum number of opened gates was four.
The results of the thirteen tests provided similar results. They indicated stable bed particles with no movements. Test 4 presents the rest of twelve testes as following:
Test No. 4:
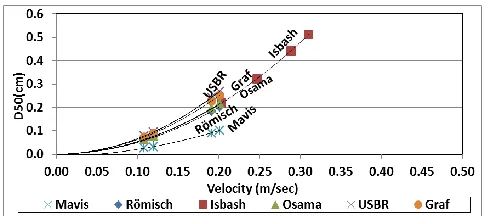
The results of test 4 was executed under the condition of closing the hydro power, right spillway and gate 3 at the left of spillway. The passing discharge (Q) was 1200 m3/sec (88.338 L/sec Model). The gate opening was constant for all opened gates and was equal to 2.385 m (5.3 cm Model). The velocity ranged between (0.068) and (0.311) m/sec. Appling equations, figure 5, it can be concluded that the required stable riprap (D50) D.S. Barrage
ranged between (0.102) and (0.511) cm at C.S. 1. Theoretically, it is clear that the maximum values of (D50)
produced from equations were less than the used value of D50 which is 1.6 cm. All equations indicated that all bed
particles D.S. the gate are stable and no particle movement.
Figure 6 represent the relationship between the velocity and the mean particle diameter for test 4 at C.S. 2. The velocity ranged between (0.037) and (0.262) m/sec. Appling equations, it can be concluded that the required stable riprap (D50) D.S. Barrage ranged between (0.187)
and (0.380) cm. Theoretically, it was clear that all equations provided maximum values of (D50) that were less
than the used value of D50 which is 1.6 cm. in this group of
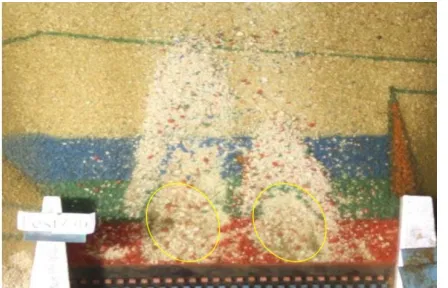
tests, no particle movements were evident, photo 3.
Second case:
The testes 13 and 14 together with 16 to 21 were executed under the condition of a discharge range (2200-2900) m3/s, where the minimum number of open gates was two. The results of the eight tests provided similar results where the bed particles were unstable where particles movements were evident. Test 14 presented the other seven testes as follows:
Test No. 14:
The results of test 14 were obtained. In this test only gates 2 and 4 at the left of the spillway were opened. The passing discharge (Q) was 2200 m3/sec (161.953 L/sec) model and the gates opening were fully opened. The velocity ranged between (0.15) and (1.03) m/sec at C.S.No.1. Appling equations, figure 7, it was concluded that the required stable riprap (D50) D.S. Barrage ranged
between (3.365) and (6.024) cm. Theoretically, it was clear that all equations provided maximum values of (D50) while
greater values were used, D50 is 1.6 cm at C.S.1. The
maximum velocity and D50 were recorded D.S. gate 2 and
4. The value of the velocity and D50 were small D.S. the
closed gates compared to the velocity D.S. the opened gates.
Figure 8 represented the relationship between the velocity and the mean particle diameter for test 14 at C.S. 2. The velocity ranged between (0.1737) and (0.847) m/sec at C.S. 2. Appling equations, it was concluded that the required stable riprap (D50) D.S. Barrage ranged between
(0.993) and (3.80) cm at C.S. 2. Theoretically, it was clear that all equations provided the maximum values of (D50)
that were more than the used D50 which is 1.6 cm except
Mavis equation.
International Journal of Emerging Technology and Advanced Engineering
Website: www.ijetae.com (ISSN 2250-2459, ISO 9001:2008 Certified Journal, Volume 5, Issue 7, July 2015)
190 B. Results Analysis And Discussions For Category 2
The tests from 22 to 30, table 1 were executed under the following conditions:
Discharge (4050-6000) m3/s and the minimum opened gates were six.
Discharge is equal to 7000 m3/s and the minimum opened gates were seven.
The results of the nine tests provided similar results. The bed particles were stable when all gates were fully opened. Test 30 presented the other eight tests as follows:
Test No.30:
The results of test 30 with hydro power and gate 4 on left spillway were closed and right spillway was opened had a discharge of 7000 m3/sec (515.3078 L/sec model). The gates opening were fully opened. The velocity range was (0.068) to (0.586) m/sec at C.S. 1. Appling equations, figure 9, it was concluded that the required stable riprap (D50) D.S. Barrage range should be 1.29 to 2.57 cm.
Theoretically, it was clear that all equations provided maximum value of (D50) which was more than the used
value of D50 which is 1.6 cm except Mavis equation. The
value of the velocity and D50 were small D.S. the closed
gate 4.
Figure 10 represents the relationship between the velocity and the mean particle diameter for test 30 at C.S. 2 where the velocity values ranged between (0.077) and (0.681) m/sec. Appling equations, it was concluded that the required stable riprap (D50) D.S. the barrage ranged
between (1.06) and (2.267) cm. Theoretically, it is clear that all equations provided the maximum value of (D50)
more than the used value of D50 which is 1.6 cm except
Mavis equation.
In this group of tests, photos 5 and 6, few small particles D.S. the spillway moved. Large particles D.S. the spillway was stable. There was no change more than the other tests 22 to 29 at the D.S. The upstream water level (just U.S. new barrage) was found to be 52.61m above mean sea level.
Figure (5): Relationship between V and D50 for test 4 at C.S.No.1
Figure (6): Relationship between V and D50 for test 4 at C.S.No.2
Photo (3): Riprap Conditions D.S. Left & Right Spillway for test 4.
Figure (7): Relationship between V and D50 for test 14 at C.S.No.1
[image:7.612.321.564.128.308.2] [image:7.612.324.559.384.622.2] [image:7.612.326.561.389.501.2] [image:7.612.325.558.520.624.2] [image:7.612.47.289.594.702.2]International Journal of Emerging Technology and Advanced Engineering
Website: www.ijetae.com (ISSN 2250-2459, ISO 9001:2008 Certified Journal, Volume 5, Issue 7, July 2015)
191
Photo (4): Riprap Conditions downstream Left Spillway for test 14
Figure (9): Relationship between V and D50 for test No.30 at C.S.No.1
Figure (10): Relationship between V and D50 for test 30 at C.S.No.2
Photo (5): Riprap Conditions downstream left Spillway for test No.30.
Photo (6): Riprap Conditions downstream right Spillway for test No.30
XI. CONCLUSIONS AND RECOMMENDATIONS
Based on the model results, the main conclusions that were derived were as following:
1. Gate opening is one of the most important factors that affect scour hole.
2. The particles should be economically designed (at the same stable) according to the passing discharge per vent. Moreover; all gates of the barrage should be kept opened at the same height in order to uniformly distribute the discharge and obtain a relatively smaller scour hole.
The riprap was found to be stable at:
1. normal operation and equally opened gates.
2. discharges of 700 and 900 m3/s where the right or left gates were closed.
3. discharges of 1200 m3/s where the left or right gates were opened.
4. discharge of 1400 m3/s where two and three gates were closed.
5. discharges of 1800 m3/s and 2200 m3/s where four gates were closed.
Problems occurred to the riprap, for example:
1. Discharges of 4050 and 5000 m3/s when gates were closed, where the scour hole increased by increasing these discharges by 10%.
2. Few small particles moved at higher discharges (i.e. 6000-7000 m3/s) through eight or seven gates. 3. Discharge of 2900 m3/s when 5 gates were opened.
The riprap was unstable in case of:
1. Discharge of 2200 m3/s where 3 gates were opened. 2. Riprap was washed away at 2200 m3/s from2 gates. 3. Exceptional gate conditions (stagger way).
[image:8.612.59.283.133.277.2] [image:8.612.324.563.133.253.2]International Journal of Emerging Technology and Advanced Engineering
Website: www.ijetae.com (ISSN 2250-2459, ISO 9001:2008 Certified Journal, Volume 5, Issue 7, July 2015)
192
The equations provided different perspective, for example:
1.Mavis equation provided the most economic and the least stable bed protection.
2.Isbash, Römisch, and Osama equations provided economic and stable bed protection.
3.USBR and Graf equations provided more bed protection stability and less economic.
Based on the obtained results the following recommendations were suggested:
For more economic stable riprap, the designer is advised to implement Isbash, Römisch, and osama equations.
For more safety the designer is advised to implement USBR and Graf equation.
Staggered open and closed gates should be avoided. Passing the flow through hydropower plants should be
tested thoroughly in future investigations.
Passing higher discharge per gate at low tail water level is not recommended.
The riprap type with mean stone diameter D50=1.6 cm
could be replaced by smaller size and should be checked if more stability is required.
Acknowledgements
This work was carried out at Hydraulics Research Institute (HRI), National Water Research Center (NWRC), Egypt. The author gratefully acknowledges the collaboration done by all staff members of the Institute during the experimental work.
REFERENCES
[1] Anderson, A.G. (1970). “Tentative design procedure of riprap lined channels”, Project report No. 96, St. Antony Falls Hyd. Lab., Minneapolis, Minnesota.
[2] Simons, D. and Senturk, F. (1977) “Sediment transport technology”, water Resources Publications, Fort Collins, Colorado. .
[3] Knieb, H.G. (1977). “Bemmessung Von schuttstein-deckwerken im verkehrswasserbau” teil 1: Lose steinschuttungen, Mitt. B:.d.BAW, No. 42
[4] Isbash (1936) “stone sizing criteria” Technical Supplement 14C, 210–VI–NEH, August 2007.
[5] Mavis, F.T., and L.M. Laushey (1948). “A Reappraisal of the beginning of bed movement competent velocity, intern. Assoc. Hyd. Res., 2d Meeting, Stockholm
[6] United State Bureau of Reclamation, "Hydraulic design of stilling basins and Energy dissipators" water resources technical publication, Denver, Colorado, 1958
[7] Graf, W.H. (1971).” Hydraulics of sediment transport.” McGraw – Hill, New York.
[8] New Assuit Barrage Hydraulic Model Investigation of Modified Layout 3-6, Barrage Model, Phase 2. July 201, HRI-159/2011. [9] Osama K.S (1995) “ Incipient motion and riprap protection
methods”
[10] Seyed Morteza Sadat-Helbar and Javad Farhoudi(2008)" Shear Velocity Method to Riprap Sizing at Downstream of Stilling Basins" World Applied Sciences Journal 4 (1): 116-13, 2008 ISSN 1818-4952© IDOSI Publications, Department of Irrigation and Reclamation Engineering,Faculty of Soil and Water Engineering, University of Tehran, Iran.
LIST OF ABBREVIATIONS
D.S : Downstream
D.S.W.L: Downstream Water Level
FS : Feasibility Study
HRI : Hydraulic Research Institute
G.O : Gate Opening (m)
SDV: Standard deviation of the velocity fluctuations.
MWRI : Ministry of Water Resources and Irrigation
ANB: Assiut New Barrage
3D :Three Dimensional Model
U.S : Upstream
USBR : United States Bureau of Reclamation
U.S.W.L: Upstream Water Level
LIST OF SYMBOLS
C : coefficient (0.86 for high turbulence level flow and 1.20 for low turbulence level) (-)
D50 : Mean size of riprap particles (L)
D100 : Maximum size of riprap particles (L)
𝛥' :Relative density of the submerged rip-rap (-) 𝛾s : Specific weight of stone ,Ib/ft3 (F/L3)
𝛾w : Specific weight of water, Ib/ft 3
(F/L3)
G : Acceleration of gravity, ft/sec2 (L/T2)
Vav : is the average mean velocity in ft/s and calculated
Vav = [(V0.2 + V0.8) /2 + V0.6] /2
Where V0.2, V0.6 and V0.8 are the velocities at depths of 0.2Y,
0.6Yand 0.8Y measure from surface of water for Isbash equation (L/T)
Vb :the bottom velocity at (0.9Y) from surface of water and in
m/sec. (L/T)
Lr :Length scale ratio. (-)