Ap plic a ti o n of t h e fuzzy a n a ly ti c
h i e r a r c h y p r o c e s s in m u l
ti-c ri t e ri a d e ti-ci sio n in n oi s e a ti-c ti o n
p l a n s : p r i o ri tizi n g r o a d s t r e t c h e s
R uiz-P a dillo, A, To rij a M a r ti n e z, AJ, R a m o s-Ri d a o , A a n d R uiz, D P
h t t p :// dx. d oi.o r g / 1 0 . 1 0 1 6 /j. e n v s of t. 2 0 1 6 . 0 3 . 0 0 9
T i t l e Ap plic a ti o n of t h e f uzzy a n a ly tic h i e r a r c h y p r o c e s s i n m u l ti-c ri t e r i a d e ci sio n in n oi s e a c tio n p l a n s : p r i o ri tizi n g r o a d s t r e t c h e s
A u t h o r s R uiz-P a dillo, A, To rij a M a r ti n e z, AJ, R a m o s-Ri d a o , A a n d R uiz, D P
Typ e Ar ticl e
U RL T hi s v e r si o n is a v ail a bl e a t :
h t t p :// u sir. s alfo r d . a c . u k /i d/ e p ri n t/ 5 3 2 0 5 / P u b l i s h e d D a t e 2 0 1 6
U S IR is a d i gi t al c oll e c ti o n of t h e r e s e a r c h o u t p u t of t h e U n iv e r si ty of S alfo r d . W h e r e c o p y ri g h t p e r m i t s , f ull t e x t m a t e r i al h el d i n t h e r e p o si t o r y is m a d e f r e ely a v ail a bl e o nli n e a n d c a n b e r e a d , d o w nl o a d e d a n d c o pi e d fo r n o
n-c o m m e r n-ci al p r iv a t e s t u d y o r r e s e a r n-c h p u r p o s e s . Pl e a s e n-c h e n-c k t h e m a n u s n-c ri p t fo r a n y f u r t h e r c o p y ri g h t r e s t r i c ti o n s .
Application of the fuzzy analytic hierarchy process in multi-criteria
decision in Noise Action Plans: prioritizing road stretches
Alejandro Ruiz-Padilloa, Antonio J. Torija b, Ramos-Ridao A.F.a, Diego P. Ruiz c
a Civil Engineering Department, Escuela Técnica Superior de Ingenieros de Caminos,
Canales y Puertos, University of Granada. Edificio Politécnico, Campus Fuentenueva s/n,
18071 Granada, Spain.
b ISVR, University of Southampton, Highfield Campus, SO17 1BJ Southampton, UK. c Information Technology and Communication Research Center (CITIC-UGR), Applied
Physics Department, Faculty of Sciences, University of Granada, Spain.
Tel: +34 958 244 161
Fax: +34 958 243 214
E-mail: aruizp@correo.ugr.es, aleruizpadillo@hotmail.com (Alejandro Ruiz-Padillo);
ajtorija@ugr.es (Antonio J. Torija); druiz@ugr.es (Diego P. Ruiz); ramosr@ugr.es (Ángel
F. Ramos-Ridao)
Abstract
Traffic noise is one of the major environmental impacts of road infrastructures.
Critical study of published Noise Action Plans (NAP) signals a widespread lack of
objective criteria and methodologies for prioritizing actions against noise as well as the
suitability of solutions. The present paper develops a methodology to sort, by priority,
road stretches included in a NAP. In obtaining and allocating weights to variables
involved in the decision-making problem (“Road Stretch Priority Variables”) to define a
normalized numerical index (“Road Stretch Priority Index”), Fuzzy Analytic Hierarchy
Process (FAHP) with two different defuzzification methods is applied to the results of an
expert panel. Comparison of the outcomes of both FAHP versions, plus analysis of the
results of a case study, enables to determine the relative influence of these variables in the
problem. An objective and reasoned methodology for the prioritized classification of road
1. Introduction.
The road traffic noise exposure problem has intensified in recent years, and stands
out over the other environmental and urban noise sources, such us industry, aircraft,
railway, or leisure activities. In Europe, initiatives and current legislation respond by
providing tools for local Administrations and society as a whole in order to combat this
serious adverse effect of road infrastructure on the environment and the health of
inhabitants (De Vos, 2009; WHO, 2011; EEA, 2014).
The main objectives of the European Parliament and of The Council of 25 June
2002, on the assessment and management of environmental noise (or “European
Environmental Noise Directive”) (European Union, 2002) included the evaluation of this
problem in the biggest European road infrastructures, assessing the number of exposed
people, and mapping sound levels using simulation software and specific noise indicators
(De Vos, 2008; Licitra and Ascari, 2014).
The problem appears to be getting out of hand in several European countries. This
negative trend can be seen through the data of road traffic noise exposure reflected in the
Strategic Noise Maps (SNM) generated in application of the Environmental Noise
Directive, and the design and implementation of numerous measures against road traffic
noise. The Public Administrations involved have furthermore approved and adopted
several measures in their plans for action against noise (EEA, 2014; Mileu et al., 2010).
The Noise Action Plans (NAP) published in Spain up to date (available at
sicaweb.cedex.es) were analyzed, and a critical review of them served us to confirm a
widespread lack of prioritization criteria for pertinent actions, both at the level of
management of stretches and suitability of solutions. Moreover, all these NAPs dealt with
a narrow spectrum of possible alternatives.
Decision-making concerning the actions included in these NAP as a result of the
SNM must take into account several variables and criteria, such us traffic data, noise
levels and exposure values, the environment characteristics and local constraints
(WG-AEN, 2007; Silence project, 2009; De Vos, 2008). These elements are often in conflict
and not clearly defined, and may have an impact of diverse intensity or nature (Torija et
al., 2010; D’Alessandro and Schiavoni, 2015; Licitra et al., 2011). Moreover, the different
the noise exposure values imply that the reported data are not directly comparable, and
action plans may be heavily dependent on these issues (Licitra et al., 2012; D’Alessandro
and Schiavoni, 2015). Therefore, in the current engineering panorama, planning processes
are highly complex due to such associated uncertainties and their eventual significance
(De Vos, 2009; Brown and Elms, 2015).
Moreover, many Member States and researchers have developed different
approaches to determine the priority for action against noise among the so-called
“hotspots” considering various criteria and procedures (De Vos, 2008; Licitra et al.,
2011). Some of these experiences define single or aggregated indicators, that are very
useful to technicians and policy makers to understand and express reasoned decisions and
comparisons in a more comprehensive way (Licitra and Ascari, 2014; D’Alessandro and
Schiavoni, 2015). However, a considerable controversy still exists concerning which the
most important principles must be in the noise action planning (De Vos, 2009).
A previous paper (Ruiz-Padillo et al., 2014) presented a preliminary methodology
to sort, by priority, road stretches included in a particular NAP. Based on the so-called
“road stretch priority index” (RSPI), the method combines the weighted influence of
several “road stretch priority variables” (RSPV) through a few weights and intervals
defined for this purpose, obtained from the RSPV bibliographic review and in the light of
the results of Naish (2010). But there is a need to determine them in a more objective
way. The value allocation system using intervals might also be improved to avoid
sensitivity problems in the methodology.
Therefore, the present study proposes a methodology for weight allocation for
these RSPV by applying the analytic hierarchy process in its fuzzy version (FAHP) to the
results obtained from ad hoc questionnaires prepared for an expert panel. Discussion of
the obtained results features a qualitative comparison between the different FAHP
versions used to sort and weigh variables. Testing the adaptability of the developed
methodology to real cases entailed a practical application involving the reviewed Noise
Action Plan for regional roads of the province of Almería, in Andalusia (southern Spain).
The proposed methodology can use input data from the SNM, regardless of the method
employed to simulate and estimate the road traffic noise. The obtained weights are
independent of the origin of the data used for the variable calculation, as presented in
2. Material and Methods.
2.1. RSPV and RSPI.
The main RSPV were determined and defined in Ruiz-Padillo et al. (2014), while
the present paper introduces the following improvements:
- Stretch traffic data: in addition to the intensity of vehicles (average daily traffic
- ADT) and the percentage of heavy vehicles (%hv), the average speed of the vehicles in
the stretch (s) is added, since it also bears influence on the generation and reduction of
noise, as evidenced in the noise mapping (Naish, 2010, Ouis, 2001).
- Complaints about traffic noise produced in a particular road stretch, if existing,
would be covered in the variable EC (taking on a binary value, either “yes” or “no”, which
translates into respective numerical values of 1 and 0).
- The RSPV noise level of necessary attenuation (ΔL) is divided into two
sub-variables, depending on the time-slot; this is because sound levels during day- or
night-time periods should not be given the same emphasis. A community noise annoyance
degree is higher during the night, even at lower sound levels. Thus, two sub-variables are
considered: the minimum attenuation in the daytime period, ΔLd, and the minimum
attenuation at night, ΔLn. Then, taking into account the definition of noise indicators
(European Union, 2002; D’Alessandro and Schiavoni, 2015) offered by the SNM, noise
levels of necessary attenuations are calculated by Eq. 1 and 2:
ΔLd = Lexist,d - Lobj,d (1)
ΔLn = Lexist,n - Lobj,n (2)
where ΔLd is the daytime necessary attenuation in dB(A);
Lexist,d is the A-weighted long-term average sound level determined over all the
day and evening periods of a year (i.e. it includes the daytime period, 7:00 to 19:00, and
the evening period, 19:00 to 23:00), obtained from the noise map;
Lobj,d is the A-weighted sound level corresponding to acoustic quality objectives
for day and evening periods, in view of the corresponding noise zoning of the stretch
ΔLn is the night-time required attenuation in dB(A);
Lexist,n is the A-weighted long-term average sound level determined over all the
night periods of a year (23:00 to 7:00), obtained from the noise map; and
Lobj,n is the A-weighted sound level corresponding to the night-time acoustic
quality objective, in view of the corresponding noise zoning of the stretch studied under
current legislation.
- Exposed surface (Sexp) and exposed population (Pexp) to excessive noise level
(i.e. sound levels above legislation limits) are also extracted from the SNM, relative to
values of the Lden, day-evening-night noise indicator, defined by Eq. 3 (European Union,
2002):
𝐿𝐿𝑑𝑑𝑑𝑑𝑑𝑑 = 10 𝑙𝑙𝑙𝑙𝑙𝑙 �12∙10
𝐿𝐿𝑑𝑑𝑑𝑑𝑑𝑑
10 +4∙10𝐿𝐿𝑒𝑒𝑒𝑒𝑒𝑒𝑒𝑒𝑒𝑒𝑒𝑒𝑒𝑒+510 +8∙10𝐿𝐿𝑒𝑒𝑒𝑒𝑒𝑒ℎ𝑡𝑡+1010
24 � (3)
in which Lday is the A-weighted long-term average sound level determined over all the
day periods of a year (7:00 to 19:00);
Levening is the A-weighted long-term average sound level determined over all the
evening periods of a year (19:00 to 23:00); and
Lnight is the A-weighted long-term average sound level determined over all the
night periods of a year (23:00 to 7:00).
In the SNM these data are distributed by intervals of sound levels, which are
usually the following: from 55 to 65 dB(A), from 65 to 75 dB(A), and values higher than
75 dB(A) (European Union, 2002; D’Alessandro and Schiavoni, 2015). In fact, it is
reasonable to assume that equal importance should not be given to a surface or people
exposed to sound levels close to acoustic quality objective levels as opposed to those who
are affected by much higher local sound levels. Therefore, based on the information of
Lden distributed by intervals obtained from the noise maps, both Sexp and Pexp variables can
be subdivided into three sub-variables according to these intervals, i.e. surface and
population exposed to sound levels between 55 and 65 dB(A), between 65 and 75 dB(A),
and higher than 75 dB(A). They are denoted, respectively: Sexp,55, Sexp,65 and Sexp,75, and
Pexp,55, Pexp,65 and Pexp,75.
- Noise sensitive centers are not only important for determining noise zoning that
that the number of sensitive centers exposed to high levels of noise on the RSPI must be
taken into account just as the previous variables, rather than as a binary variable (ESC)
(Ruiz-Padillo et al., 2014). Therefore, the formulation of this variable was adapted to the
number of exposed noise sensitive centers (SCexp), which is also determined in the SNM
according to the corresponding intervals of levels of noise exposure. These data can thus
be broken down into three sub-variables, as above, to be denoted SCexp,55, SCexp,65 and
SCexp,75.
- Finally, the existence of anti-noise measures —both previously established and
planned— was still considered in the variable EANM (also with a binary value, i.e. 1 if
there are not anti-noise measures neither already implemented nor planned, or 0,
otherwise) (Ruiz-Padillo et al., 2014).
The methodology therefore involves nine road stretch priority variables, four of
them having dependent sub-variables, bringing us to a total of 16 factors, as shown in
Table 1. The RSPI is determined as a weighted sum of these parameters. So, the RSPI is
defined by Eq. 4:
𝑅𝑅𝑅𝑅𝑅𝑅𝑅𝑅= ∑16𝑖𝑖=1𝑅𝑅𝑅𝑅𝑅𝑅𝑅𝑅𝑖𝑖 ∙ 𝑤𝑤𝑖𝑖 (4)
where RSPVi are the normalized road stretch priority variables and sub-variables; and
wi denotes the corresponding weights to each parameter, obtained from
application of FAHP and the expert panel, as explained below.
2.2. Fuzzy Analytic Hierarchy Process.
There is extensive literature on the application of the Analytic Hierarchy Process
developed by Saaty (AHP). This technique is easily understood, and widely used as a
decision model due to both the way that multiple criteria are treated and its qualitative
and quantitative data processing (Saaty, 1987; Gass and Rapscák, 2004; Mahmoodzadeh
et al., 2007; García-Cascales and Lamata, 2009; Zhu and Dale, 2001). AHP is based on a
concept of balance that is used to determine the overall importance of criteria about the
problem at hand. Obtaining normalized weights, the main purpose of applying AHP, can
relative significance for each level of criteria in relation to an upper level, represented by
numerical comparisons in a set of matrices (Zhu and Dale, 2001; Saaty, 2002; Bottero et
al., 2011; Kazakis et al., 2015; Delgado-Galván et al., 2014).
Still, AHP is not able to mimic the way human thought makes decisions
(Kahraman et al., 2003; Chan and Kumar, 2007) by means of a model of uncertain and
inaccurate evaluation. Taking into account the complexity and uncertainty involved in
real-life problems, decision-makers tend to be imprecise in their preferences, and experts
are uninclined or unable to assign accurate values when comparing various criteria
(Mikhailov, 2003; Erensal et al., 2006). Furthermore, available data and information
regarding the variables may be vague and ambiguous.
Hence it is particularly interesting to link traditional AHP with the fuzzy systems
theory in order to harbor the concept of uncertainty that is inherent to human judgment
(Buckley, 1985; Cheng, 1996; Van Laarhoven and Pedrycz, 1983; Wang et al., 2008;
Rinderknecht et al., 2012). This methodological extension with the concept of fuzzy set
theory as introduced by Zadeh (1965) is known in the literature as Fuzzy Analytic
Hierarchy Process (FAHP). It was eventually developed as a solution for hierarchical
fuzzy problems (García-Cascales and Lamata, 2009; Kahraman et al., 2003; Chan and
Kumar, 2007; Lau et al., 2003).
FAHP can be discerned from traditional AHP by the following main characteristics
(Mahmoodzadeh et al., 2007; García-Cascales and Lamata, 2009):
- The use of fuzzy numbers in Saaty’s fundamental scale (l/9, l/8, …, 1, …, 8, 9)
(Saaty, 1987) to shape expressions closer to natural language in the judgments when
constructing pairwise comparison matrices.
- The use of linguistic labels to assess the relative importance of attributes, factors,
conditions and/or criteria in pairwise comparisons with others of the same hierarchical
level.
Of course, calculation procedures are based on the principles of the “fuzzy sets”
theory, since the assessments are no longer crisp numbers.
It is important to recall that, when using FAHP for criteria weighting, a
consistency ratio (C.R.) is obtained in addition to the corresponding principal eigenvector,
which represents the priority vector, integrated by the intended weights (Bottero et al.,
ratio is the measure of how good this eigenvector estimates the weight vector. It is
obtained by comparing the consistency index (C.I.) with the appropriate average random
consistency index (R.I.), derived from a sample of size 500 from a randomly generated
reciprocal matrix, using Saaty’s fundamental scale (Saaty, 1987) (Eq. 5):
𝐶𝐶.𝑅𝑅. =𝐶𝐶𝑅𝑅..𝐼𝐼𝐼𝐼.. (5)
Values of the R.I. are obtained according to the size of the pairwise comparisons
matrix (Saaty, 1987).
The C.I. of a matrix of comparisons is given by Eq. 6:
𝐶𝐶.𝑅𝑅. =𝜆𝜆𝑚𝑚𝑑𝑑𝑚𝑚−𝑑𝑑
𝑑𝑑−1 (6)
where λmax is the largest or principal eigenvalue of the comparison matrix; and
n is the size of the matrix (number of elements of the diagonal).
If the consistency ratio is not less than 10%, it is recommended to re-study the
problem and review the judgments. For n = 3 the threshold is fixed at 5%, and for n = 4
at 8%.
Other fundamental aspects of implementation of the FAHP are:
i) The comparison scale through linguistic labels associated with triangular fuzzy
numbers (Büyüközkan et al., 2004; Celik et al., 2009). Table 2 shows the scale used in
this paper.
ii) Data aggregation. Given the utilization of the expert panel technique to obtain
necessary pairwise comparisons, global judgments must be obtained through an
aggregation model. Saaty proposed geometric means of aggregating pairwise valuations
carried out by several experts or decision-makers (Zhu and Dale, 2001; Kazakis et al.,
2015; Liao, 2011; Saaty, 1990). Moreover, the geometric mean is an acceptable, simple
and rapid procedure that meets the conditions of symmetry (overall assessment is not
modified if two individual valuations are exchanged), of agreement (if all individuals
agree, the overall opinion correlates with them), of linear homogeneity (if each valuation
of the members of the group is multiplied by a constant, the group preference is also
multiplied by the constant), and of reciprocity (the average of reciprocal judgments being
the unit of reference). Both the weight vector and the eigenvalue are obtained from this
iii) The defuzzification of the fuzzy weight vector obtained from the pairwise
comparisons matrix. Two fundamental versions of the FAHP can be used to get the crisp
associated values: the so-called original version deploys the defuzzification technique
through the fuzzy centroid or the center of gravity of a triangular fuzzy number —i.e., if
(a, b, c) is a triangular fuzzy number, the defuzzificated associated value is (a + b + c) /
3 (Lau et al., 2003); or the approach based on Chang’s extent analysis (Chang, 1996) and
denominated Fuzzy Extended Hierarchy Process (FEAHP), which performs
defuzzification through the measure of the possibility, as described below:
If the object set is denoted by X = {x1, x2, …, xn} and the goal set is denoted by G
= {g1, g2, ... , gm}, then according to the principles of Chang’s extent analysis, each object
is considered correspondingly, and for each object the analysis is carried out for each of
the possible goals, gi. The m extent analysis values for each object are thus obtained as
𝑀𝑀�𝑔𝑔1𝑒𝑒,𝑀𝑀�𝑔𝑔2𝑒𝑒, … ,𝑀𝑀�𝑔𝑔𝑚𝑚𝑒𝑒,𝑖𝑖= 1, 2, … ,𝑛𝑛, where 𝑀𝑀�𝑔𝑔𝑒𝑒
𝑗𝑗 (𝑗𝑗= 1, 2, … ,𝑚𝑚) are all triangular fuzzy
numbers. The membership function of the triangular fuzzy number is denoted by 𝜇𝜇𝑀𝑀� =
(𝑙𝑙,𝑢𝑢,𝑣𝑣).
The steps of Chang’s extent analysis can be summed up as follows (Chan and
Kumar, 2007; Erensal et al., 2006; Liao, 2011; Büyüközkan et al., 2004; Celik et al.,
2009; Chan et al., 2013).
Step 1: The value of fuzzy synthetic extent with respect to the ith object is defined
by Eq. 7:
𝑅𝑅𝑖𝑖 =∑ 𝑀𝑀�𝑔𝑔𝑒𝑒
𝑗𝑗⨂�∑ ∑ 𝑀𝑀� 𝑔𝑔𝑒𝑒 𝑗𝑗 𝑚𝑚 𝑗𝑗=1 𝑑𝑑 𝑖𝑖=1 � −1 𝑚𝑚 𝑗𝑗=1 (7)
where ⨂ denotes the extended multiplication of two fuzzy numbers.
The value of ∑𝑚𝑚𝑗𝑗=1𝑀𝑀�𝑔𝑔𝑗𝑗𝑒𝑒 can be found by performing the fuzzy addition of m extent analysis values for a particular matrix such that
∑𝑚𝑚 𝑀𝑀�𝑔𝑔𝑗𝑗𝑒𝑒
𝑗𝑗=1 =�∑𝑚𝑚𝑗𝑗=1𝑙𝑙𝑗𝑗,∑𝑗𝑗=1𝑚𝑚 𝑢𝑢𝑗𝑗,∑𝑚𝑚𝑗𝑗=1𝑣𝑣𝑗𝑗� (8)
and �∑𝑑𝑑𝑖𝑖=1∑𝑚𝑚𝑗𝑗=1𝑀𝑀�𝑔𝑔𝑗𝑗𝑒𝑒�−1 can be expressed as
�∑ ∑ 𝑀𝑀�𝑔𝑔𝑒𝑒
𝑗𝑗 𝑚𝑚 𝑗𝑗=1 𝑑𝑑 𝑖𝑖=1 � −1
=�∑ 1 𝑣𝑣
𝑗𝑗 𝑚𝑚 𝑗𝑗=1 ,
1 ∑𝑚𝑚𝑗𝑗=1𝑢𝑢𝑗𝑗,
1
∑𝑚𝑚𝑗𝑗=1𝑙𝑙𝑗𝑗� (9)
Step 2: The degree of possibility of 𝑀𝑀�2 = (𝑙𝑙2,𝑢𝑢2,𝑣𝑣2)≥ 𝑀𝑀�1 = (𝑙𝑙1,𝑢𝑢1,𝑣𝑣1) is defined by Eq. 10:
𝑅𝑅�𝑀𝑀�2 ≥ 𝑀𝑀�1�= sup𝑦𝑦≥𝑥𝑥�min�𝜇𝜇𝑀𝑀�1(𝑥𝑥),𝜇𝜇𝑀𝑀�2(𝑥𝑥)�� (10)
and can be calculated by Eq. 11 (Fig. 1):
𝑅𝑅�𝑀𝑀�2 ≥ 𝑀𝑀�1�= hgt�𝑀𝑀�2∩ 𝑀𝑀�1�= 𝜇𝜇𝑀𝑀�2(𝑑𝑑) =�
1, 𝑖𝑖𝑖𝑖𝑢𝑢2 ≥ 𝑢𝑢1 0, 𝑖𝑖𝑖𝑖𝑙𝑙1 ≥ 𝑣𝑣2 𝑙𝑙1−𝑣𝑣2
(𝑢𝑢2−𝑣𝑣2)−(𝑢𝑢1−𝑙𝑙1), 𝑙𝑙𝑜𝑜ℎ𝑒𝑒𝑒𝑒𝑤𝑤𝑖𝑖𝑒𝑒𝑒𝑒 (11)
where d is the ordinate of the highest intersection point between 𝜇𝜇𝑀𝑀�1 and 𝜇𝜇𝑀𝑀�2. In order to
compare, both the values of 𝑅𝑅�𝑀𝑀�2 ≥ 𝑀𝑀�1� and 𝑅𝑅�𝑀𝑀�1 ≥ 𝑀𝑀�2� are required.
Step 3: The degree possibility for a convex fuzzy number to be greater than k
convex fuzzy numbers 𝑀𝑀�𝑖𝑖, 𝑖𝑖= 1, 2, … ,𝑘𝑘 can be defined by Eq. 12:
𝑅𝑅�𝑀𝑀� ≥ 𝑀𝑀�1,𝑀𝑀�2, … ,𝑀𝑀�𝑘𝑘�= V��𝑀𝑀� ≥ 𝑀𝑀�1� and �𝑀𝑀� ≥ 𝑀𝑀�2� and … and �𝑀𝑀� ≥
𝑀𝑀�𝑘𝑘��= min V�𝑀𝑀� ≥ 𝑀𝑀�𝑖𝑖�,𝑖𝑖= 1, 2, … ,𝑘𝑘 (12)
Then, assuming that d’(Ai) = min V(Si≥ Sk), for k = 1, 2, …, n; k ≠ i, the weight
vector is given by W’ = (d’(A1), d’(A2), …, d’(An))T, where Ai, i = 1, 2, …, n, are n
elements.
Step 4: Finally, via normalization, the normalized weight vector is W = (d(A1),
d(A2), …, d(An))T, where W is a nonfuzzy number that gives the priority weights of one
attribute or alternative over another. Normalization is the fourth fundamental aspect of
FAHP implementation, as will be shown below.
Subsequently, having reached the crisp weight vector, calculating its consistency
depends on the principal eigenvalue of the comparisons matrix λmax, another value to be
defuzzificated. In both FAHP versions, defuzzification of the eigenvalue entails choosing
the central or modal value of the fuzzy number.
iv) The normalization of results is required as the final step for arriving at the
intended values. This paper uses a linear procedure, which presents each value as a
percentage of the total, i.e. (Eq. 13)
𝑒𝑒𝑖𝑖𝑗𝑗 =∑𝑚𝑚𝑥𝑥𝑒𝑒𝑗𝑗𝑥𝑥𝑒𝑒𝑗𝑗
where rij are normalized values and xij are values obtained directly from FAHP
implementation.
Both the original FAHP version and FEAHP are implemented in this paper so that
their results can be compared, revealing any consistency differences.
2.3. Expert panel.
For the purpose of minimizing subjectivity, and in light of the impropriety of
evaluations required for the pairwise comparisons used by the FAHP, despite knowing
that uncertainty characterizes and motivates the use of fuzzy techniques, these
assessments were obtained via questionnaires involving experts in respective
decision-making fields (Wang et al., 2008; Rinderknecht et al., 2012; Liao, 2011; Zhu and Dale,
2001; Celik et al., 2009; Delgado-Galván et al., 2014). Among the different options that
could be employed to form the expert panel, postal questionnaires were selected. A total
of 21 questionnaires were sent via e-mail to technical specialists in senior management
positions of the three Spanish Administrations responsible for roads, specifically in the
geographical scope of Andalusia (southern Spain): state (1), regional (18) and provincial
(2) levels. Three further experts from the regional administration responsible for
informing/transmitting NAP to the Ministry of Environment were added to the panel.
After some instructions about the process, the nine RSPV were submitted to the
experts with a brief explanation about its meaning and the adopted notation in the
questionnaire. Before starting filling in the questionnaire, experts had the option to solve
any doubt with the authors about the process, but not about the responses, in order to
avoid biased results. Then, they were asked to sort the variables according to their relative
importance in the decision-making problem of sorting road stretches by priority for action
against traffic noise. They were also asked if it was necessary to consider some other
variables in the problem in addition to the mentioned RSPV. If so, experts must fill in the
appropriate field of the questionnaire with the additional variables and indicators. This
procedure ensured the convenience and quality of the considered RSPV, and was the
Subsequently, each RSPV was compared with the other variables, and experts
must answer with the linguistic labels defined in Table 2. A similar process was repeated
with the four groups of sub-variables, until achieving all the pairwise comparisons.
Finally, each expert was asked to send back to the authors of the study his/her
completed questionnaire, thanking him/her for the collaboration in the research. After the
initially specified period of two months, 19 questionnaires were correctly received and
processed, with participants coming from all the Administration departments.
It should be remarked that in this study, great importance was given to the
composition and size of the members for the expert panel with the intention of ensuring
valid and unbiased results (people who really are really involved in this problem in a road
network). Therefore, technicians of the highest hierarchical level of the departments
responsible for roads in the three different administrative categories in the autonomous
region of Andalusia, southern Spain, were consulted. Since they are the small number of
people with management responsibilities in the problem addressed here, only these group
satisfies the specific characteristics required for being members of the expert panel in our
study. As a result the entire population involved in the decision-making process coming
from all provinces and Administration levels in the territorial scope of the expert panel
were chosen. In addition, the consistency of the results was also verified according to the
Fuzzy Analytical Hierarchy Process to apply the methodology and it was successful.
3. Results and Discussion.
3.1. Weighting the RSPV.
FAHP was implemented to obtain the weights applied to RSPV for calculating
RSPI. It was therefore necessary to define the hierarchy system only for the levels
concerning the goal and criteria (the 9 RSPV, within the recommendations issued by Saaty
for the FAHP) and sub-criteria (the various sub-variables), but not the alternative level
(e.g. the different sorts of road stretch in the NAP). We strove to put forth a more generic
The hierarchy system used in the FAHP is as shown in Fig. 2.
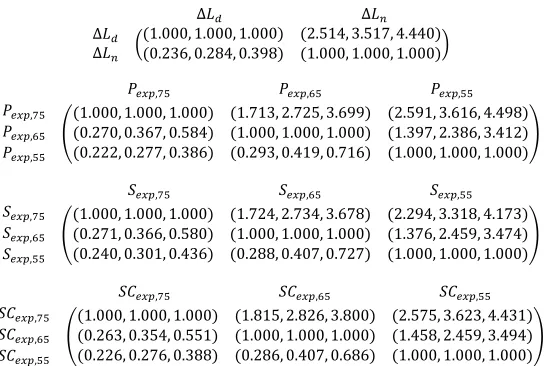
The pairwise comparison matrices with the relative importance fuzzy judgments
of the 9 RSPV and their corresponding sub-variables were obtained from the geometric
mean of the corresponding fuzzy elements of the comparison matrices generated from the
interviewed experts’ responses, as can be seen in Fig. 3 and 4.
RSPV crisp weight vectors were obtained by means of FAHP application in both
versions presented above. The results, normalized and denoted in percentage, are shown
below:
𝑊𝑊𝑅𝑅𝑅𝑅𝑅𝑅𝑅𝑅,𝑜𝑜𝑜𝑜𝑖𝑖𝑔𝑔𝑖𝑖𝑑𝑑𝑜𝑜𝑙𝑙 =
⎝ ⎜ ⎜ ⎜ ⎜ ⎜ ⎛ 𝑤𝑤∆𝐿𝐿
𝑤𝑤𝑅𝑅𝑒𝑒𝑚𝑚𝑒𝑒
𝑤𝑤𝑅𝑅𝑒𝑒𝑚𝑚𝑒𝑒
𝑤𝑤𝐴𝐴𝐴𝐴𝐴𝐴
𝑤𝑤%ℎ𝑣𝑣
𝑤𝑤𝑠𝑠
𝑤𝑤𝐸𝐸𝐶𝐶
𝑤𝑤𝑅𝑅𝐶𝐶𝑒𝑒𝑚𝑚𝑒𝑒
𝑤𝑤𝐸𝐸𝐴𝐴𝐴𝐴𝐴𝐴⎠
⎟ ⎟ ⎟ ⎟ ⎟ ⎞ 𝑜𝑜𝑜𝑜𝑖𝑖𝑔𝑔𝑖𝑖𝑑𝑑𝑜𝑜𝑙𝑙 = ⎝ ⎜ ⎜ ⎜ ⎜ ⎜ ⎛ 14.77% 21.00% 5.15% 11.60% 6.63% 6.21% 9.05% 18.97% 6.62%⎠ ⎟ ⎟ ⎟ ⎟ ⎟ ⎞
𝐶𝐶.𝑅𝑅. = 0.003
𝑊𝑊𝑅𝑅𝑅𝑅𝑅𝑅𝑅𝑅,𝑑𝑑𝑥𝑥𝑒𝑒𝑑𝑑𝑑𝑑𝑒𝑒=
⎝ ⎜ ⎜ ⎜ ⎜ ⎜ ⎛ 𝑤𝑤∆𝐿𝐿
𝑤𝑤𝑅𝑅𝑒𝑒𝑚𝑚𝑒𝑒
𝑤𝑤𝑅𝑅𝑒𝑒𝑚𝑚𝑒𝑒
𝑤𝑤𝐴𝐴𝐴𝐴𝐴𝐴
𝑤𝑤%ℎ𝑣𝑣
𝑤𝑤𝑠𝑠
𝑤𝑤𝐸𝐸𝐶𝐶
𝑤𝑤𝑅𝑅𝐶𝐶𝑒𝑒𝑚𝑚𝑒𝑒
𝑤𝑤𝐸𝐸𝐴𝐴𝐴𝐴𝐴𝐴⎠
⎟ ⎟ ⎟ ⎟ ⎟ ⎞ 𝑑𝑑𝑥𝑥𝑒𝑒𝑑𝑑𝑑𝑑𝑒𝑒 = ⎝ ⎜ ⎜ ⎜ ⎜ ⎜ ⎛ 17.87% 23.59% 0.00% 14.39% 4.36% 4.49% 9.46% 22.23% 3.62%⎠ ⎟ ⎟ ⎟ ⎟ ⎟ ⎞
𝐶𝐶.𝑅𝑅. = 0.005
Weights of sub-variables were obtained in the same way, from the sub-variable
pairwise comparison matrices, except for sub-variables related to necessary attenuation
(ΔL), because FAHP is not applicable to 2-size matrices. In this case, the only
representative element of the pairwise comparison matrix was defuzzificated, and a value
of the necessary attenuation sub-variables´ relative importance was given. This value
could be directly transformed into weights of both sub-variables; hence, we have the
vectors:
𝑊𝑊∆𝐿𝐿 =�𝑤𝑤𝑤𝑤∆𝐿𝐿∆𝐿𝐿𝑑𝑑
𝑒𝑒�=�
𝑊𝑊𝑅𝑅𝑒𝑒𝑚𝑚𝑒𝑒,𝑜𝑜𝑜𝑜𝑖𝑖𝑔𝑔𝑖𝑖𝑑𝑑𝑜𝑜𝑙𝑙 =�
𝑤𝑤𝑅𝑅𝑒𝑒𝑚𝑚𝑒𝑒,75
𝑤𝑤𝑅𝑅𝑒𝑒𝑚𝑚𝑒𝑒,65
𝑤𝑤𝑅𝑅𝑒𝑒𝑚𝑚𝑒𝑒,55
�
𝑜𝑜𝑜𝑜𝑖𝑖𝑔𝑔𝑖𝑖𝑑𝑑𝑜𝑜𝑙𝑙
=�58.41%27.32% 14.27%�
𝐶𝐶.𝑅𝑅. = 0.037
𝑊𝑊𝑅𝑅𝑒𝑒𝑚𝑚𝑒𝑒,𝑑𝑑𝑥𝑥𝑒𝑒𝑑𝑑𝑑𝑑𝑒𝑒 =�
𝑤𝑤𝑅𝑅𝑒𝑒𝑚𝑚𝑒𝑒,75
𝑤𝑤𝑅𝑅𝑒𝑒𝑚𝑚𝑒𝑒,65
𝑤𝑤𝑅𝑅𝑒𝑒𝑚𝑚𝑒𝑒,55
�
𝑑𝑑𝑥𝑥𝑒𝑒𝑑𝑑𝑑𝑑𝑒𝑒
=�70.54%29.46% 0.00%�
𝐶𝐶.𝑅𝑅. = 0.084
𝑊𝑊𝑅𝑅𝑒𝑒𝑚𝑚𝑒𝑒,𝑜𝑜𝑜𝑜𝑖𝑖𝑔𝑔𝑖𝑖𝑑𝑑𝑜𝑜𝑙𝑙 =�
𝑤𝑤𝑠𝑠𝑒𝑒𝑚𝑚𝑒𝑒,75
𝑤𝑤𝑅𝑅𝑒𝑒𝑚𝑚𝑒𝑒,65
𝑤𝑤𝑅𝑅𝑒𝑒𝑚𝑚𝑒𝑒,55
�
𝑜𝑜𝑜𝑜𝑖𝑖𝑔𝑔𝑖𝑖𝑑𝑑𝑜𝑜𝑙𝑙
=�57.35%27.74% 14.91%�
𝐶𝐶.𝑅𝑅. = 0.054
𝑊𝑊𝑅𝑅𝑒𝑒𝑚𝑚𝑒𝑒,𝑑𝑑𝑥𝑥𝑒𝑒𝑑𝑑𝑑𝑑𝑒𝑒 =�
𝑤𝑤𝑅𝑅𝑒𝑒𝑚𝑚𝑒𝑒,75
𝑤𝑤𝑅𝑅𝑒𝑒𝑚𝑚𝑒𝑒,65
𝑤𝑤𝑅𝑅𝑒𝑒𝑚𝑚𝑒𝑒,55
�
𝑑𝑑𝑥𝑥𝑒𝑒𝑑𝑑𝑑𝑑𝑒𝑒
=�67.52%32.48% 0.00%�
𝐶𝐶.𝑅𝑅. = 0.108
𝑊𝑊𝑅𝑅𝐶𝐶𝑒𝑒𝑚𝑚𝑒𝑒,𝑜𝑜𝑜𝑜𝑖𝑖𝑔𝑔𝑖𝑖𝑑𝑑𝑜𝑜𝑙𝑙 =�
𝑤𝑤𝑅𝑅𝐶𝐶𝑒𝑒𝑚𝑚𝑒𝑒,75
𝑤𝑤𝑅𝑅𝐶𝐶𝑒𝑒𝑚𝑚𝑒𝑒,65
𝑤𝑤𝑅𝑅𝐶𝐶𝑒𝑒𝑚𝑚𝑒𝑒,55
�
𝑜𝑜𝑜𝑜𝑖𝑖𝑔𝑔𝑖𝑖𝑑𝑑𝑜𝑜𝑙𝑙
= �58.81%27.10% 14.09%�
𝐶𝐶.𝑅𝑅. = 0.045
𝑊𝑊𝑅𝑅𝐶𝐶𝑒𝑒𝑚𝑚𝑒𝑒,𝑑𝑑𝑥𝑥𝑒𝑒𝑑𝑑𝑑𝑑𝑒𝑒 =�
𝑤𝑤𝑅𝑅𝐶𝐶𝑒𝑒𝑚𝑚𝑒𝑒,75
𝑤𝑤𝑅𝑅𝐶𝐶𝑒𝑒𝑚𝑚𝑒𝑒,65
𝑤𝑤𝑅𝑅𝐶𝐶𝑒𝑒𝑚𝑚𝑒𝑒,55
�
𝑑𝑑𝑥𝑥𝑒𝑒𝑑𝑑𝑑𝑑𝑒𝑒
=�70.96%29.04% 0.00%�
𝐶𝐶.𝑅𝑅. = 0.101
Consistency ratios (Eq. (5)) were obtained for each weight set. In the case of the
RSPV weight vectors, consistency ratio values are seen to be much lower than 0.10, the
threshold proposed by Saaty to ensure consistency of results. That is, the achieved
weighting was perceived as very robust, especially with the application of the original
FAHP method. In the case of Pexp, Sexp and SCexp sub-variables, results after applying
FAHP extent analysis method do not present adequate consistency, since their C.R. values
were higher than 0.05 (limit established for n = 3). However, the consistency ratios
obtained for the original FAHP method results were lower than 5%, the exception being
the exposed surface sub-variables (yet very close to this value). FAHP original method
results were therefore more appropriately estimated in terms of consistency. In terms of
weight values, the RSPV sets proved to be very similar in the established order and in
analysis method, the Sexp variable was removed (zero weight). For sub-variable results
entailing extent analysis, exposure parameters for the interval of Lden between 55 and 65
dB(A) sub-variables were also removed.
In light of a literature review including consideration of the reference standards
for developing NAP, we opted not to eliminate the influence of the exposed surface
variable (particularly relevant in SNM), nor the influence of exposure to sound levels
below 65 dB(A) parameters, which would imply dismissing an important part of the
acoustic impact.
Therefore, weight vectors obtained by means of the original FAHP, combined with
defuzzification by the fuzzy centroid, were held to be more adequate as weight values for
the RSPV and sub-variables in the context of the proposed methodology.
Finally, sub-variable weights (relative to the objective upper level) were derived
by aggregation under the established hierarchy, simply by multiplying the sub-criteria
weight sets by the corresponding criterion weight (Bottero et al., 2011; Liao, 2011; Zhu
and Dale, 2001). Accordingly, as the main results achieved in this work, the values
weighting each variable within the RSPI (Eq. (4)) are shown in Table 3. These weights
may be used in any Road Noise Action Plan analysis, and regardless of the origin of the
data employed to assess the RSPV, the calculation tool or the Road Network size.
Based on the values of the weightings obtained, the variables “exposed population
to more than 75 dB(A) of Lden”, “ADT”, “attenuation of sound level in night periods” and
“number of sensitive-centers exposed to Lden above 75 dB(A)” were found to be the most
influential variables for prioritizing road stretches. In other words, the variables having
the most substantial effect on the population, according to the consensus of the expert
panel, were the variables with the greatest weighting in the decision-making
methodology. This result would appear to be consistent with the primary objective of
NAP´s formulation, regarding which road stretches are to be prioritized, and with the
philosophy behind the European Environmental Noise Directive as well as
recommendations issued at the European level for prioritization in actions against noise
3.2. Illustrative case: Application to priority review of road stretches from the Regional
Noise Action Plan 2008-2012 within the province of Almería (Andalusia, Spain).
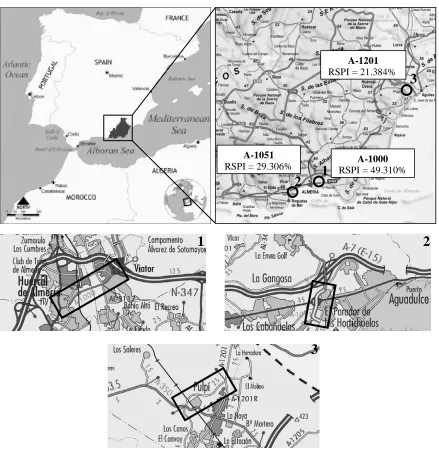
To illustrate the methodology developed in this paper, we offer a case study of the
Andalusian Regional Road Network in the province of Almería. The present results were
compared with those published in a previous paper (Ruiz-Padillo et al., 2014). The road
stretches chosen for the case study have a greater ADT and population living nearby
(COFV, 2014), or else citizens’ complaints accurately reflect road traffic noise at certain
locations:
- A-1000 road, which runs from N-340a in “Huércal de Almería” to A-7 in
“Viator”, in the stretch between km 0+350 and km 1+100;
- A-1051 motorway, in the stretch from A-7 in “Aguadulce” to “El Parador de las
Hortichuelas”, from km 0+400 to km 2+300; and
- A-1201 road, in the stretch between the center and the northern exit to “Pulpí”,
which received recurring complaints from citizens about road traffic noise in neighboring
dwellings, from km 13+700 to km 13+800.
The specific location of the studied road stretches can be seen in Figure 5, as well
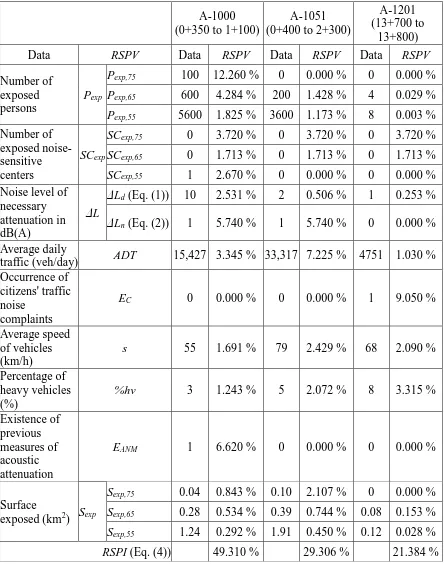
as the RSPI index for each one.
RSPV values for the studied road stretches, obtained from SNM data elaborated
by the Regional Administration (“Junta de Andalucía”) in 2014, are summarized in Table
4 (COFV, 2014). It includes the calculated values for each RSPV after normalization (Eq.
(13)) and multiplication by weights listed in Table 3, as well as the resulting RSPI (Eq.
(4)) for each road stretch. These index values facilitate sorting by priority for action in
the corresponding NAP.
The priority order for action that should be given to the road stretches within the
NAP 2008-2012 of the regional road in the province of Almería (in the corresponding
review at the present time: A-1000, A-1051 and A-1201) is provided by the calculated
RSPI values.
The methodology pointed to highest priority for action for the A-1000 road stretch.
in the NAP formulated in 2008 (COPT, 2008)). Its traffic volume has since dropped from
6,000,000 vehicles/year (the threshold for the obligation to be included in NAP in 2008).
Despite showing the highest ADT value, the A-1051 motorway stretch was not
considered by the Regional Administration in the first phase of the implementation of the
Directive. Consequently it was not included under the needs for prompt action of the
published plan.
The A-1201 road stretch received the lowest priority, although the Regional
Administration was not obliged to include it in the action plan by strictly applying the
Environmental Noise Directive.
From the values of the RSPV (in the estimation of the RSPI) for the three stretches
studied, it is observed that:
- High priority of the A-1000 road stretch was significantly influenced by the high
sound level affecting the population (even over 75 dB(A)) and by the existence of a school
(noise-sensitive center) above the 55 dB(A) level of Lden.
- The RSPI value reached by the A-1051 road stretch mostly responds to its high
traffic data (ADT, percentage of heavy vehicles and speed of vehicles), and the larger
surface exposed to high sound levels; notwithstanding, it already had a noise barrier along
its entire length and had a less adverse effect on the population.
- In relation to the A-1201 road stretch, it was found that the most important factors
comparatively contributing to the final value of its RSPI were mainly the occurrence of
citizens’ complaints, and to a lesser extent, the percentage of heavy vehicles and the speed
of the vehicles, which were higher than on the other stretches (excepting the speed on
A-1051, somewhat greater, but not as high as might be expected for a motorway). Apart
from having less ADT, the small population exposed to noise essentially reduces urgency
for action. We should stress, however, that the Regional Administration has already
planned noise barriers to mitigate existing noise due to the road traffic in neighboring
dwellings whose inhabitants have submitted complaints about it in this area. For this
reason, and even though road stretch A-1201 has the lowest priority for action in the NAP,
it seems appropriate to include A-1201 in the budget planning for the period of validity
of the NAP. A solution for annoying noise would thus be ensured for the citizens having
The road stretches of this case study were sorted with the same priority achieved
using weights estimated in the methodology design (Ruiz-Padillo et al., 2014), although
RSPI values obtained have changed, especially for the A-1051 road stretch. The results in
the illustrative case remain equally logical in both applications; and having checked the
robustness of the developed methodology, the greater validity of the results is highlighted
by the accuracy of the weight set used. Moreover, classifications by priority as derived
through this methodology are enhanced by a more objective and reasoned basis,
supported by previous expert opinions and FAHP use.
Another noteworthy outcome in this illustrative case stems from our comparison
of the priority established by applying the proposed methodology and the classifications
offered by interviewed experts. All the experts consulted coincided in sorting the three
road stretches with the same priority. This stands as proof of the accuracy and consistency
of the obtained results.
Methodological validation can be soundly based on the techniques used and the
case study analyzed in this work. Once road stretches that require planning solutions
against road traffic noise have been sorted according to by priority in the NAP, it is
possible to examine suitable alternatives and choose the most suitable option in
accordance with the second phase of the proposed methodology, as described in
Ruiz-Padillo et al. (2014). This decision-making problem is again of the multicriteria analysis
type and is applied to the pre-selected alternatives. Of course, this choice should be
reasoned and justified, meaning further research is necessary to determine criteria and
their relative influence in this phase. Subsequently, actions for estimating total cost
distribution should be carried out within the period of NAP validity, taking into account
prioritization as established by the RSPI calculated values.
4. Conclusions.
The development and implementation of a multi-criteria methodology for
decision-making were deemed necessary for the classification by priority for action of
road stretches included under Noise Action Plans, mainly in terms of the weights assigned
formulation. Given the complexity of the decisions to be made and the associated
uncertainty in decision-making, the Fuzzy Analytic Hierarchy Process was adopted as the
most practical approach. This multi-criteria decision-making method was applied to
results from an expert panel, through questionnaires given to specialists with appropriate
knowledge and experience in the raised issues.
The methodology developed in this work made it possible to obtain RSPV weights
in the context of RSPI calculation in a more objective way. This sound foundation implies
a broader application capacity for the methodology. For instance, it might be useful for
policy-makers elaborating Noise Action Plans for any Road Network. Managers can
decide about the prioritization of the road stretches included in a certain Noise Action
Plan, simply by comparing their RSPI values with each other. For this, they must evaluate
the RSPV and sub-variables from traffic and SNM data of each stretch, in addition to
information of possible complaints about traffic noise. The RSPI is obtained by weighting
the normalized RSPV values with the weights proposed in this paper (Table 3), and then
adding them up (eq. 4). Widely circulated math softwares, such as spreadsheets, can easily
implement this process.
The accuracy and quality of our proposal were confirmed through a comparison
of results achieved in a previously estimated application. This improved methodology
presented here ensures a well-founded weighting of the variables involve in the
prioritization of road-traffic stretches, allowing a high extrapolation/generalization ability
of the method. The methodology was implemented in a review of the Noise Action Plan
for the Andalusian Road Network within the province of Almería (southern Spain). In
fact, the methodology lends objectivity and rigor to the decision-making process in road
stretch prioritization, supporting valuable arguments for the adoption and implementation
of the Noise Action Plan, as well as public opinion (as required by European
Environmental Noise Directive).
The application of the presented methodology is possible regardless of the noise
simulation technique used, and has been shown a very useful tool for subsequent stages
of implementation of the European Environmental Noise Directive, especially when the
CNOSSOS-EU method will be adopted as the method of generation of the strategic noise
maps in 2017.
The success of the approach described here, applied to road stretch classification
establishment of a weighted multicriteria method for the choice of suitable alternatives
against road noise in each particular stretch of the NAP. Indeed, studying the influence of
fuzzy logic on criteria and alternatives determined for such a particular problem is viewed
as a highly interesting research proposal.
Acknowledgments.
This work was supported by the “Ministerio de Economía y Competitividad” of
Spain under project TEC2012-38883-C02-02.
This work is also funded by the University of Malaga and the European
Commission under the Agreement Grant no. 246550 of the seventh Framework
Programme for R & D of the EU, granted within the People Programme, “Co-funding of
Regional, National and International Programmes” (COFUND), and “Ministerio de
Economía y Competitividad” of Spain (COFUND2013-40259).
The authors wish to thank the “Dirección General de Infraestructuras de la
Consejería de Fomento y Vivienda” of the “Junta de Andalucía” (Spain) for facilitating
access to the data required for this study and the reviewers for their valuable comments.
References.
Bottero, M., Comino, E., Riggio, V., 2011. Application of the Analytic Hierarchy Process
and the Analytic Network Process for the assessment of different wastewater treatment
systems. Environmental Modelling & Software 26, 1211-1224.
Brown, C.B., Elms, D.G., 2015. Engineering decisions: Information, knowledge and
understanding. Structural Safety 52, 66–77.
Buckley, J.J., 1985. Fuzzy hierarchical analysis. Fuzzy Sets and Systems 17(3), 233–247.
Büyüközkan, G., Kabraman, C., Ruan, D., 2004. A fuzzy multi-criteria decision approach
for software development strategy selection. International Journal of General Systems
Celik, M., Er, I.D., Ozok, A.F., 2009. Application of fuzzy extended AHP methodology
on shipping registry selection: The case of Turkish maritime industry. Expert Systems
with Applications 36, 190–198.
Chan, F.T.S., Kumar, N., 2007. Global supplier development considering risk factors
using fuzzy extended AHP-based approach. Omega 35, 417–431.
Chan, H., Wang, X., White, G.R.T., Yip, N., 2013. An Extended Fuzzy-AHP Approach
for the Evaluation of Green Product Designs. IEEE Transactions on Engineering
Management 60 (2), 327–339.
Chang, D.-Y., 1996. Applications of the extent analysis method on fuzzy AHP. European
Journal of Operational Research 96, 649–655.
Cheng, C.H., 1996. Evaluating naval tactical missile systems by fuzzy-AHP based on the
grade value of membership function. European Journal of Operational Research 96, 343–
350.
Consejería de Fomento y Vivienda de la Junta de Andalucía (COFV), 2014. Plan General
de Aforos de Andalucía. 2014. [Road occupancy and traffic data. General Plan for
Andalusia].
Consejería de Obras Públicas y Transportes de la Junta de Andalucía (COPT), 2008. Plan
de Acción Contra el Ruido de la Red Autonómica de Carreteras de Andalucía con tráfico
superior a seis millones de vehículos al año. 2008. [Action Plan Against Noise of the
Regional Road Network of Andalusia with more than six million vehicles/year].
D'Alessandro, F., Schiavoni, S., 2015. A review and comparative analysis of European
priority indices for noise action plans. Science of the Total Environment 518–519, 290–
301.
Delgado-Galván, X., Izquierdo. J., Benítez, J., Pérez-García, R., 2014. Joint stakeholder
decision-making on the management of the Silao-Romita aquifer using AHP.
Environmental Modelling & Software 51, 310-322.
De Vos, P., 2008. Strategies for noise action plans. Proceedings of Euronoise Paris, France
De Vos, P., 2009. Environmental noise directive: do's and don'ts for the second round
Proceedings of Euronoise Edinburgh, Scotland 2009.
Erensal, Y.C., Öncan, T., Demircan, M.L., 2006. Determining key capabilities in
technology management using fuzzy analytic hierarchy process: A case study of Turkey.
Information Sciences 176, 2755–2770.
European Commission Working Group. Assessment of exposure to noise (WG-AEN),
2007. Good practice for strategic noise mapping and the production of associated data on
noise exposure. Version 2. August, 2007.
European Environmental Agency (EEA), 2014. Noise in Europe 2014.
http://www.eea.europa.eu/publications/noise-in-europe-2014/at_download/file
European Union, 2002. Directive 2002/49/EC of the European Parliament and of the
Council of 25 June 2002 relating to the assessment and management of environmental
noise. Official Journal L 189, 18/07/2002, P. 0012–0026.
García-Cascales, M.S., Lamata, M.T., 2009. Selection of a cleaning system for engine
maintenance based on the analytic hierarchy process. Computers & Industrial
Engineering 56(4), 1442–1451.
Gass, S.I., Rapcsák, T., 2004. Singular value decomposition in AHP. European Journal of
Operational Research 154, 573–584.
IMAGINE Project, 2004. Improved methods for the assessment of the generic impact of
noise in the environment. State of the art. IMAGINE report
IMA10TR-040423-AEATNL32, 14 October 2004.
Kahraman, C., Cebeci, U., Ulukan, Z., 2003. Multi-criteria supplier selection using fuzzy
AHP. Logistics Information Management 16(6), 382–394.
Kazakis, N., Kougias, I., Patsialis, T., 2015. Assessment of flood hazard areas at a regional
scale using an index-based approach and Analytical Hierarchy Process: Application in
Lau, H.C.W., Wong, C.W.Y., Lau, P.K.H., Pun, K.F., Chin, K.S., Jiang, B., 2003. A fuzzy
multi-criteria decision support procedure for enhancing information delivery in extended
enterprise networks. Engineering Applications of Artificial Intelligence 16, 1–9.
Liao, C.-N., 2011. Fuzzy analytical hierarchy process and multi-segment goal
programming applied to new product segmented under price strategy. Computers &
Industrial Engineering 61, 831–841.
Licitra, G., Ascari, E., Brambilla, G., 2012. Comparative Analysis of Methods to Estimate
Urban Noise Exposure of Inhabitants. Acta Acustica united with Acustica 98 (4),
659-666.Licitra, G., Ascari, E., 2014. Gden: An indicator for European noise maps comparison
and to support action plans. Science of the Total Environment 482, 411-419.
Licitra, G., Gallo, P., Rossi, E., Brambilla, G., 2011. A novel method to determine
multiexposure priority indices tested for Pisa action plan, Applied Acoustics 72 (8),
505-510.
Mahmoodzadeh, S., Shahrabi, J., Pariazar, M., Zaeri, M.S., 2007. Project selection by
using fuzzy AHP and TOPSIS technique. International Journal of Humanities and Social
Sciences 1(3), 135–140.
Mikhailov, L., 2003. Deriving priorities from fuzzy pairwise comparison judgements.
Fuzzy Sets and Systems 134(3), 365–385.
Milieu Ltd., Risk and Policy Analysis Ltd., TNO, 2010. Review of the Implementation of
Directive 2002/49/EC on Environmental Noise. Final report.
Naish, D., 2010. A method of developing regional road traffic noise management strategy.
Applied Acoustics 71, 640–652.
Ouis, D., 2001. Annoyance from road traffic noise: a review. J. Environ. Psychol 21, 101–
120.
Rinderknecht, S.L., Borsuk, M.E., Reichert, P., 2012. Bridging uncertain and ambiguous
knowledge with imprecise probabilities. Environmental Modelling & Software 36,
Ruiz-Padillo, A., Torija, A.J., Ramos-Ridao, Á., Ruiz. D.P., 2014. A methodology for
classification by priority for action: selecting road stretches for network noise action
plans. Transportation Research Part D 29, 66–78.
Saaty, R.W., 1987. The Analytic Hierarchy Process - What it is and how it is used. Mathl
Modelling 9(3-5), 161–176.
Saaty, T.L., 1990. How to Make a Decision. European Journal of Operational Research
48, 9–26.
Saaty, T.L., 2002. Decision making with the analytic hierarchy process. Scientia Iranica
9(3), 215–229.
Silence Project, 2009. Silence: Practitioner handbook for local noise action plans.
www.silence-ip.org/site
Torija, A.J., Genaro, N., Ruiz, D.P., Ramos-Ridao, Á., Zamorano, M., Requena, I., 2010.
Priorization of acoustic variables: environmental decision support for the physical
characterization of urban sound environments. Building and Environment 45, 1477–1489.
Van Laarhoven, P.J.M., Pedrycz, W., 1983. A fuzzy extension of Saaty's priority theory.
Fuzzy Sets and Systems 11(1-3), 199–227.
Wang, Y.-M., Luo, Y., Hua, Z., 2008. On the extent analysis method for fuzzy AHP and
its applications. European Journal of Operational Research 186, 735–747.
World Health Organization (WHO), 2011. Burden of disease from environmental noise.
WHO and JRC, Bonn, 2011.
Zadeh, L.A., 1965. Fuzzy Sets. Information and Control 8(3), 338–353.
Zhu, X., Dale, A.P., 2001. JavaAHP: a web-based decision analysis tool for natural
resource and environmental management. Environmental Modelling & Software 16,
Table 1: List of road stretch priority variables and sub-variables.
Table 2: Triangular scale of conversion of linguistic variables to fuzzy numbers.
Table 3: Weighting of the RSPV and sub-variables.
Table 4: Calculation of the RSPV and the RSPI values for the road stretches analyzed in
Table 1:
No. Road stretch priority variables Road stretch priority sub-variables
1
ΔL Noise level of necessary attenuation
Daytime period ΔLd
2 Night period ΔLn
3
Pexp Exposed population
to Lden > 75 dB(A) Pexp,75
4 to Lden [65, 75[ dB(A) Pexp,65
5 to Lden [55, 65[ dB(A) Pexp,55
6
Sexp Exposed surface
to Lden > 75 dB(A) Sexp,75
7 to Lden [65, 75[ dB(A) Sexp,65
8 to Lden [55, 65[ dB(A) Sexp,55
9 ADT Average daily traffic
10 %hv Percentage of heavy vehicles
11 s Average speed of vehicles
12 EC Occurrence of citizens' traffic noise complaints
13
SCexp Exposed noise-sensitive centers
to Lden > 75 dB(A) SCexp,75
14 to Lden [65, 75[ dB(A) SCexp,65
15 to Lden [55, 65[ dB(A) SCexp,55
16 EANM Existence of previous measures of acoustic attenuation
Table 2:
Intensity of importance on an
absolute scale
Linguistic label associated Triangular fuzzy scale
Triangular fuzzy reciprocal scale
Exactly the same (1, 1, 1) (1, 1, 1)
1 Equally important (1/2, 1, 2) (1/2, 1, 2)
2 Moderately more important (1, 2, 3) (1/3, 1/2, 1)
3 More important (2, 3, 4) (1/4, 1/3, 1/2)
4 Much more important (3, 4, 5) (1/5, 1/4, 1/3)
5 Extremely more important (4, 5, 5) (1/5, 1/5, 1/4)
Table 3:
No. Road stretch priority
variables Road stretch priority sub-variables
Total weight (%)
1
Pexp Exposed population
to Lden > 75 dB(A) Pexp,75 12.26 %
2 to Lden [65, 75[ dB(A) Pexp,65 5.74 %
3 to Lden [55, 65[ dB(A) Pexp,55 3.00 %
4
SCexp
Exposed
noise-sensitive centers
to Lden > 75 dB(A) SCexp,75 11.16 %
5 to Lden [65, 75[ dB(A) SCexp,65 5.14 %
6 to Lden [55, 65[ dB(A) SCexp,55 2.67 %
7
ΔL Noise level of
necessary attenuation
Daytime period ΔLd 3.29 %
8 Night period ΔLn 11.48 %
9 ADT Average daily traffic 11.60 %
10 EC Occurrence of citizens' traffic noise complaints 9.05 %
11 s Average speed of vehicles 6.21 %
12 %hv Percentage of heavy vehicles 6.63 %
13 EANM Existence of previous measures of acoustic attenuation 6.62 %
14
Sexp Surface exposed
to Lden > 75 dB(A) Sexp,75 2.95 %
15 to Lden [65, 75[ dB(A) Sexp,65 1.43 %
16 to Lden [55, 65[ dB(A) Sexp,55 0.77 %
TOTAL 100.00 %
Table 4:
A-1000 (0+350 to 1+100)
A-1051 (0+400 to 2+300)
A-1201 (13+700 to
13+800)
Data RSPV Data RSPV Data RSPV Data RSPV
Number of exposed persons
Pexp
Pexp,75 100 12.260 % 0 0.000 % 0 0.000 %
Pexp,65 600 4.284 % 200 1.428 % 4 0.029 %
Pexp,55 5600 1.825 % 3600 1.173 % 8 0.003 %
Number of exposed noise-sensitive centers
SCexp
SCexp,75 0 3.720 % 0 3.720 % 0 3.720 %
SCexp,65 0 1.713 % 0 1.713 % 0 1.713 %
SCexp,55 1 2.670 % 0 0.000 % 0 0.000 %
Noise level of necessary attenuation in dB(A)
ΔL
ΔLd(Eq. (1)) 10 2.531 % 2 0.506 % 1 0.253 %
ΔLn(Eq. (2)) 1 5.740 % 1 5.740 % 0 0.000 %
Average daily
traffic (veh/day) ADT 15,427 3.345 % 33,317 7.225 % 4751 1.030 %
Occurrence of citizens' traffic noise
complaints
EC 0 0.000 % 0 0.000 % 1 9.050 %
Average speed of vehicles (km/h)
s 55 1.691 % 79 2.429 % 68 2.090 %
Percentage of heavy vehicles (%)
%hv 3 1.243 % 5 2.072 % 8 3.315 %
Existence of previous measures of acoustic attenuation
EANM 1 6.620 % 0 0.000 % 0 0.000 %
Surface
exposed (km2) Sexp
Sexp,75 0.04 0.843 % 0.10 2.107 % 0 0.000 %
Sexp,65 0.28 0.534 % 0.39 0.744 % 0.08 0.153 %
Sexp,55 1.24 0.292 % 1.91 0.450 % 0.12 0.028 %
Fig. 1: The degree of possibility of M2 ≥M1. Adapted from Erensal et al. (2006).
Fig. 2: Hierarchy system for criteria and sub-criteria FAHP weighting.
Fig. 3: RSPV fuzzy comparison matrix.
Fig. 4: Sub-variables fuzzy comparison matrix.
Fig. 1:
M
µ
2 1
( )
V M ≥M
1
M M2
l
1m
1l
2d
u
1m
2u
20
1
M
µ
2 1
( )
V M ≥M
1
M M2
l
1m
1l
2d
u
1m
2u
2Fig. 2:
Sorting by priority road
stretches for action
ΔL ADT Pexp s %hv Sexp EC SCexp EANM
Level 1: goal
Level 2: criteria and sub-criteria
Fig 3:
∆𝐿𝐿 𝑅𝑅𝑑𝑑𝑥𝑥𝑒𝑒 𝑅𝑅𝑑𝑑𝑥𝑥𝑒𝑒 𝐴𝐴𝐴𝐴𝐴𝐴 %ℎ𝑣𝑣 𝑒𝑒 𝐸𝐸𝐶𝐶 𝑅𝑅𝐶𝐶𝑑𝑑𝑥𝑥𝑒𝑒 𝐸𝐸𝐴𝐴𝐴𝐴𝑀𝑀
∆𝐿𝐿 𝑅𝑅𝑑𝑑𝑥𝑥𝑒𝑒
𝑅𝑅𝑑𝑑𝑥𝑥𝑒𝑒
𝐴𝐴𝐴𝐴𝐴𝐴
%ℎ𝑣𝑣 𝑒𝑒 𝐸𝐸𝐶𝐶
𝑅𝑅𝐶𝐶𝑑𝑑𝑥𝑥𝑒𝑒
𝐸𝐸𝐴𝐴𝐴𝐴𝑀𝑀 ⎝
⎜ ⎜ ⎜ ⎜ ⎜ ⎜ ⎛
(1.000, 1.000, 1.000) (0.420, 0.638, 1.053) (1.935,2.808, 3.692) (0.876, 1.411, 2.086) (1.441,2.335, 3.228) (1.687, 2.647, 3.656) (1.010, 1.577, 2.409) (0.499, 0.745, 1.196) (1.471, 2.332, 3.208) (0.950, 1.568, 2.383) (1.000, 1.000, 1.000) (2.670,3.743, 4.468) (1.458, 2.335, 3.277) (2.273,3.290, 4.222) (2.460, 3.498, 4.431) (1.750, 2.652, 3.641) (0.749, 1.238, 1.894) (1.713, 2.627, 3.586) (0.271, 0.356, 0.517) (0.224, 0.267, 0.374) (1.000,1.000, 1.000) (0.333, 0.456, 0.684) (0.502,0.698, 1.034) (0.551, 0.773, 1.111) (0.423, 0.535, 0.728) (0.235, 0.284, 0.405) (0.456, 0.804, 1.178) (0.479, 0.709, 1.142) (0.305, 0.428, 0.686) (1.462,2.194, 2.999) (1.000, 1.000, 1.000) (1.140,1.988, 3.050) (1.279, 2.204, 3.259) (0.844, 1.315, 1.982) (0.374, 0.538, 0.803) (1.352, 2.086, 2.919) (0.310, 0.428, 0.694) (0.237, 0.304, 0.440) (0.967,1.434, 1.991) (0.328, 0.503, 0.877) (1.000,1.000, 1.000) (0.619, 1.053, 1.819) (0.451, 0.638, 1.039) (0.249, 0.326, 0.473) (0.672, 1.015, 1.624) (0.274, 0.378, 0.593) (0.226, 0.286, 0.406) (0.900,1.294, 1.815) (0.307, 0.454, 0.782) (0.550,0.950, 1.617) (1.000, 1.000, 1.000) (0.439, 0.675, 1.099) (0.249, 0.312, 0.452) (0.650, 0.955, 1.500) (0.415, 0.634, 0.990) (0.275, 0.377, 0.571) (1.373,1.868, 2.363) (0.504, 0.760, 1.185) (0.962,1.569, 2.218) (0.910, 1.480, 2.278) (1.000, 1.000, 1.000) (0.294, 0.414, 0.665) (0.894, 1.414, 2.053) (0.836, 1.343, 2.006) (0.528, 0.808, 1.334) (2.467,3.521, 4.258) (1.245, 1.859, 2.674) (2.113,3.069, 4.010) (2.211, 3.210, 4.023) (1.503, 2.414, 3.399) (1.000, 1.000, 1.000) (1.995, 3.040, 3.988) (0.312, 0.429, 0.680) (0.279, 0.381, 0.584) (0.849,1.243, 1.833) (0.343, 0.479, 0.740) (0.616,0.985, 1.489) (0.667, 1.047, 1.539) (0.487, 0.707, 1.118) (0.251, 0.329, 0.501) (1.000, 1.000, 1.000)⎠
Fig. 4:
∆𝐿𝐿𝑑𝑑 ∆𝐿𝐿𝑑𝑑
∆𝐿𝐿𝑑𝑑
∆𝐿𝐿𝑑𝑑 �
(1.000, 1.000, 1.000) (2.514, 3.517, 4.440) (0.236, 0.284, 0.398) (1.000, 1.000, 1.000)�
𝑅𝑅𝑑𝑑𝑥𝑥𝑒𝑒,75 𝑅𝑅𝑑𝑑𝑥𝑥𝑒𝑒,65 𝑅𝑅𝑑𝑑𝑥𝑥𝑒𝑒,55
𝑅𝑅𝑑𝑑𝑥𝑥𝑒𝑒,75
𝑅𝑅𝑑𝑑𝑥𝑥𝑒𝑒,65
𝑅𝑅𝑑𝑑𝑥𝑥𝑒𝑒,55
�(1.000, 1.000, 1.000) (1.713, 2.725, 3.699) (2.591, 3.616, 4.498)(0.270, 0.367, 0.584) (1.000, 1.000, 1.000) (1.397, 2.386, 3.412) (0.222, 0.277, 0.386) (0.293, 0.419, 0.716) (1.000, 1.000, 1.000)�
𝑅𝑅𝑑𝑑𝑥𝑥𝑒𝑒,75 𝑅𝑅𝑑𝑑𝑥𝑥𝑒𝑒,65 𝑅𝑅𝑑𝑑𝑥𝑥𝑒𝑒,55
𝑅𝑅𝑑𝑑𝑥𝑥𝑒𝑒,75
𝑅𝑅𝑑𝑑𝑥𝑥𝑒𝑒,65
𝑅𝑅𝑑𝑑𝑥𝑥𝑒𝑒,55
�(1.000, 1.000, 1.000) (1.724, 2.734, 3.678) (2.294, 3.318, 4.173)(0.271, 0.366, 0.580) (1.000, 1.000, 1.000) (1.376, 2.459, 3.474) (0.240, 0.301, 0.436) (0.288, 0.407, 0.727) (1.000, 1.000, 1.000)�
𝑅𝑅𝐶𝐶𝑑𝑑𝑥𝑥𝑒𝑒,75 𝑅𝑅𝐶𝐶𝑑𝑑𝑥𝑥𝑒𝑒,65 𝑅𝑅𝐶𝐶𝑑𝑑𝑥𝑥𝑒𝑒,55
𝑅𝑅𝐶𝐶𝑑𝑑𝑥𝑥𝑒𝑒,75
𝑅𝑅𝐶𝐶𝑑𝑑𝑥𝑥𝑒𝑒,65
𝑅𝑅𝐶𝐶𝑑𝑑𝑥𝑥𝑒𝑒,55
Fig. 5:
3
2
1
1
3
2
A-1000
RSPI = 49.310%
A-1051
RSPI = 29.306%
A-1201