International Journal of Emerging Technology and Advanced Engineering
Website: www.ijetae.com (ISSN 2250-2459,ISO 9001:2008 Certified Journal, Volume 5, Issue 6, June 2015)
355
Effect of Unified Power Flow Controller on Power System
Performance: A Case Study of Maryland 132/33/11 kV
Transmission Station
Oluwagbade Z.V.
1, Wara S.T
2, Adejumobi, I.A.
3, Mustapha, A.O.
41,3Electrical and Electronics Engineering Department, Federal University of Agriculture, Abeokuta, Nigeria 2Electrical and Information Engineering Department, Covenant University, Ota, Nigeria
4Physics Department, Federal University of Agriculture, Abeokuta, Nigeria
Abstract— This work examines the effect of Unified Power Flow Controller (UPFC) on power system performance using Maryland 132/33/11 kV transmission station as a case study. The transmission network consists of Alausa, Police Training College and Mushin 33 kV feeders and T1A-15 MVA, T2A-15 MVA and T3A-15 MVA 33/11 kV tertiary transformers with their respective peak load designated A-F. The developed model equations for the network without and with UPFC were implemented using Matlab/Simulink software (R2009b Version). The system’s performance was further examined by introducing a fault condition on D and E transformers. With A-F as 25, 37.5, 12.5, 12.5, 12.5 and 37.5 MW respectively, the average voltage improved from 0.95297, 0.93832, 0.93952, 0.93123, 0.91937 and 0.95297 p.u. respectively without the UPFC to 0.96142, 0.95560, 0.94782, 0.93838, 0.92755 and 0.96142 p.u. respectively when the UPFC was applied. Similarly, the average power improved from 3.55883, 6.85067, 9.8335, 12.4735, 14.74483 and 6.85067 MW respectively without the UPFC to 3.62233, 6.97133, 10.0095, 12.6952, 15.0113 and 6.97133 MW respectively with the UPFC. Also, for the earth fault introduced on D and E transformers, the average voltage improved from 0.4467 and 0.84005 p.u. respectively without the UPFC to 0.4507 and 0.8475 p.u. respectively with the UPFC. The average power similarly improved from 1.9435 and 5.3665 MW respectively without the UPFC to 1.9775 and 5.4625 MW respectively when the UPFC was applied. The results of this work showed that the application of UPFC on the Maryland transmission network appreciably improved the voltage and power profiles of the system.
Keywords
—
UPFC, power system performance, Maryland transmission station, earth fault, voltage and power profilesI. INTRODUCTION
One of the major constraints being faced by the electricity supply utilities in most developing countries of the world like Nigeria is the large electric power supply-demand gap. Demand for electrical energy continues to grow steadily without corresponding increase in electric power generation capacity to match the ever-growing demand for electrical energy.
Electric power systems consisting of complex interconnection of various essential components such as generators, transformers, transmission lines, cables etc. are economically very expensive to establish to meet up with the increasing electrical energy demand. Electricity grid upgrade cannot keep pace with the growing power plant capacity and energy demand. Also, finding suitable right of ways for new transmission systems is particularly difficult and gaining the necessary approval is time consuming due to some environmental considerations [1]. Therefore, the only alternative to these challenges is to devise means to optimise the use of existing power system facilities particularly the transmission systems for provision of stable, secure and high quality electricity supply.
Transmission system is one of the two indispensable links between the electric power generating stations and the consumers, the other being distribution system. Optimal utilization of transmission lines is a strict requirement of the energy systems in view of limited availability of transmission corridors. With the growing requirement of transmission of bulk power to expanding load centres over restricted right of ways, the need to use transmission facilities in an optimum and efficient manner is being increasingly felt [2]. Since voltage fluctuation is a common phenomenon in alternating current transmission systems, there is also the need to improve the transient and steady state stability of long distance high voltage transmission lines in order to conserve the power transfer capability of the systems to serve increasing energy demand.
International Journal of Emerging Technology and Advanced Engineering
Website: www.ijetae.com (ISSN 2250-2459,ISO 9001:2008 Certified Journal, Volume 5, Issue 6, June 2015)
356
The main FACT devices used in transmission system for power quality enhancement are Static VAR Compensator (SVC), Thyristor Controlled Series Capacitor (TCSC), phase shifter, Static Synchronous Compensator (STATCOM), Static Synchronous Series Compensator (SSSC), and Unified Power Flow Controller (UPFC) [3], [4], [5]. These controllers have distinct characteristics making them suitable for various applications.
In this work, we examined the effect of UPFC on power system performance using Maryland 132/33/11 kV transmission station as a case study. Maryland transmission station is sited in one of the most densely populated, commercial and industrial centres of Lagos State, South West, Nigeria and due to this, there is high energy demand placed on the transmission station. Hence, this calls for the need to examine its performance and how it can be enhanced to serve the end-users in load areas maximally.
II. TRANSMISSION SYSTEM AND ITS LIMITATION TO
POWER FLOW
The transmission system is the phase of electric power system required to deliver bulk power from power generating stations to the load centres and industrial consumers beyond the economical service range of the regular primary distribution lines [6]. This system is expected to be efficient, technically sound and reliable as well as has sufficient current carrying capacity so as to transmit the required power over a given distance without an excessive voltage drop and overheating. However, there are some factors that limit the loading capacity of transmission lines. According to Song and Johns [7], these factors are classified as thermal, voltage drop and stability limits.
A. Thermal Limit
Thermal limit of a transmission line depends on a number factors including temperature, environmental conditions, physical structure of the conductor, and ground clearance. The heat generated as a result of line losses (loss of electrical energy) weakens the power line conductors. The heat may cause the conductors to expand leading to undesired sagging of the power line. At some temperature, the conductors may become soft enough to be permanently damaged by the line weight. At a higher temperature, the conductors may melt and break. Therefore, thermal limit imposes constraints on the power flow through the transmission line.
B
.
Voltage Drop LimitWhen load on the transmission line increases, the voltage at receiving substation decreases. For the equipment to operate correctly, the voltage should not be allowed to fall outside the specified value since a higher voltage drop limits the power transfer over the transmission line.
C. Stability Limit
There are a number of stability concerns that limit the transmission capability. These include transient stability, steady state stability, voltage collapse and loop flow. In order to use the transmission line up to its capacity, these stability concerns need to be adequately addressed. For instance, fault,continual variation in loads and generation, voltage instability, difficulty in control of loop flow all affect the power transfer capability of the transmission line. Therefore, going by the above highlighted factors which limit the power transfer capability of the transmission lines, there is the need to employ the use of fast acting and less expensive technology such as FACTS which can improve the efficiency of transmissions line by enhancing the power flow to serve the increasing load demand in Nigeria.
III. FLEXIBLE ALTERNATING CURRENT TRANSMISSION
SYSTEM (FACTS)
International Journal of Emerging Technology and Advanced Engineering
Website: www.ijetae.com (ISSN 2250-2459,ISO 9001:2008 Certified Journal, Volume 5, Issue 6, June 2015)
357
With these methods the desired objectives were not effectively achieved with wear and tear in the mechanical components and slow response being the major problems. As a result, there is the need for an alternative technology with fast response characteristics. Within this technology is FACTS which are basically solid state electronic devices. FACTS are characterized by fast response time and low cost. They have the ability improve the power transfer capability of transmission systems and also keep power flow over designated routes at desired levels. Examples of FACTS are SVC, TCSC, phase shifter, STATCOM, SSSC, UPFC etc.
A. The Unified Power Flow Controller (UPFC)
[image:3.612.60.288.367.564.2]The UPFC is the most versatile member of the FACTS family employed for controlling the power flow on power grids [11]. The UPFC uses a combination of a shunt controller (STATCOM) and a series controller (SSSC) interconnected through a common Direct Current (DC) bus as shown in Fig. 1.
Fig. 1 Single-line diagram of a UPFC [11]
The operation of UPFC is based on the Synchronous Voltage Source (SVS) concept for providing a uniquely comprehensive capability for transmission system control [7]. It can provide the functional capability of independently controlling both the real and reactive power flow of the line. The functional capability of the UPFC from the traditional transmission concept is based on shunt compensation, series compensation and phase shifting [2]. The UPFC can fulfill all these functions and thereby meets multiple control objectives by injecting voltage with appropriate amplitude and phase angle, to the terminal voltage.
UPFC provides much more flexibility than the SSSC for controlling the line active and reactive power because active power can be transferred from the shunt converter to the series converter, through the DC bus [11]. In addition to allow control of the line active and reactive power, the UPFC provides an additional degree of freedom. Its shunt converter operating as a STATCOM controls voltage by absorbing or generating reactive power. Both the series and shunt converters use a Voltage-Sourced Converter (VSC) connected on the secondary side of a coupling transformer. The VSCs use forced-commutated power electronic devices such as Gate Turn-Off (GTO) thyristors to synthesize a voltage from a DC voltage source. The common capacitor connected on the DC side of the VSCs acts as a DC voltage source.
1) UPFC Power Flow Model: Referring to the Fig. 1 above, the output voltage of the series converter is added to the AC terminal voltage via the series connected coupling transformer. The injected voltage acts as an AC series voltage source, changing the effective sending-end voltage as seen from node m. The product of the transmission line current and the series voltage source , determines the active and reactive power exchanged between the series converter and the AC system. The UPFC equivalent circuit is used to derive the steady-state model in rectangular form. The equivalent circuit consists of two ideal voltage sources representing the fundamental Fourier series component of the switched voltage waveforms at the AC converter terminals. The ideal voltage sources namely the shunt and series converters are represented by equations (3.1) and (3.2):
) = (3.1) ) = (3.2) Where
is the voltage source representing the shunt converter
is the magnitude of the voltage source representing the shunt converter and satisfies the
limit )
is the angle of the voltage source representing the shunt converter and satisfies the limit
( )
is the real component of the voltage source representing the shunt converter
is the imaginary component of the voltage source representing the shunt converter
International Journal of Emerging Technology and Advanced Engineering
Website: www.ijetae.com (ISSN 2250-2459,ISO 9001:2008 Certified Journal, Volume 5, Issue 6, June 2015)
358
is the magnitude of the voltage source representing the series converter and satisfies the
limit
is the angle of the voltage source representing the series converter and satisfies the limit
( )
is the real component of the voltage source representing the series converter
is the imaginary component of the voltage source representing the series converter
Based on the equivalent circuit of Fig. 1, the power flow equations for the UPFC are obtained as follow:
At the sending-end node :
(3.3) Where
is the apparent power of bus k is the active power of bus k
is the reactive power of bus k is the voltage of bus k
is the complex conjugate the voltage source representing the shunt converter
is the complex conjugate of the admittance of the shunt converter
is the complex conjugate the voltage source representing the series converter
is the complex conjugate of the admittance of the series converter
is the complex conjugate of the voltage of bus m After performing some complex operations, equations (3.4) and (3.5) were respectively obtained for the active and reactive power of bus k:
(3.4)
(3.5) Where
is the real component of the voltage of bus k is the imaginary component of the voltage of bus k
is the real component of the voltage of bus m
is the imaginary component of the voltage of bus m
is the self-conductance of bus k
is the mutual-conductance between buses k and m is the mutual-susceptance between buses k and m is the conductance of the shunt converter is the susceptance of the shunt converter At the receiving-end node :
(3.6) Where
is the apparent power of bus m is the active power of bus m
is the reactive power of bus m is the voltage of bus m
is the complex conjugate of the voltage of bus m
Similarly, the receiving-end node active and reactive power equations are given by equations (3.7) and (3.8):
(3.7)
(3.8) Where
is the self-conductance of bus m is the self-susceptance between bus m
The series converter power equations are given by equations (3.9), (3.10) and (3.11):
(3.9)
(3.10)
(3.11) Where
International Journal of Emerging Technology and Advanced Engineering
Website: www.ijetae.com (ISSN 2250-2459,ISO 9001:2008 Certified Journal, Volume 5, Issue 6, June 2015)
359
is the reactive power of the series converter
is the complex conjugate of the current of series converter
The shunt converter power equations are given by equations (3.12), (3.13) and (3.14):
(3.12)
(3.13)
(3.14) Where
is the apparent power of the shunt converter is the active power of the shunt converter
is the reactive power of the shunt converter
is the complex conjugate of the current of shunt converter
The self-admittance of buses k and m and the mutual-admittance between buses k and m are defined by equations (3.15), (3.16) and (3.17) respectively:
(3.15) (3.16)
(3.17)
Assuming a free loss converter operation, the UPFC neither absorbs nor injects active power with respect to the AC system. The DC link voltage, , remains constant. The active power associated with the series converter becomes the DC power . The shunt converter must supply an equivalent amount of DC power to maintain constant. Hence, the active power supplied to the shunt converter, , must satisfy the active power demanded by the series converter, , that is:
= + = 0 (3.18)
The linearized system of power flow equations for UPFC in connection with the rest of the network is obtained using Newton-Raphson power flow given by equation (3.19):
(3.19) Where
(3.20)
(3.21) With as the solution vector, , the Jacobian matrix,
, the power mismatch equivalent to equation (3.21) and superscript T indicating transposition.
For the case when the UPFC controls voltage magnitude at the AC shunt converter terminal (node ), active power flowing from node m to node k and reactive power injected at node m and assuming that node m is PQ-type, the solution vector and Jacobian matrix are given by equations (3.22) and (3.23):
= (3.22)
(3.23) IV. SIMULATION RESULTS AND DISCUSSION
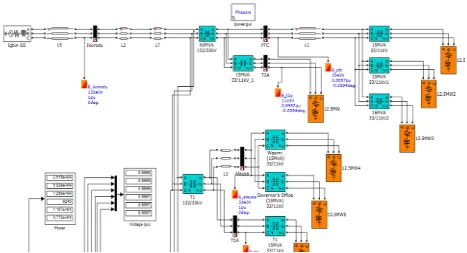
In this work, the modelled UPFC was implemented using the Matlab/Simulink software (R2009b Version). Figs. 2 and 3 respectively show the Simulink models of the Maryland 132/33/11 kV power transmission network without and with UPFC. The network consists of Alausa, Police Training College (PTC) and Mushin 33 kV feeders and T1A-15 MVA, T2A-15 MVA and T3A-15 MVA 33/11 kV tertiary transformers. Table 1 shows the 33 kV transmission route loads of Maryland transmission network used during the simulations.
International Journal of Emerging Technology and Advanced Engineering
Website: www.ijetae.com (ISSN 2250-2459,ISO 9001:2008 Certified Journal, Volume 5, Issue 6, June 2015)
360
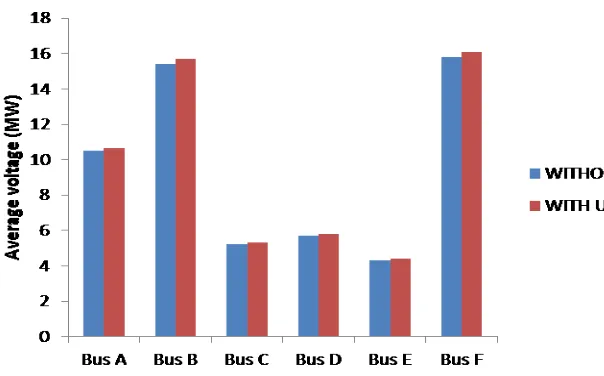
The average voltage of the buses corresponding to the loads improved from 0.95297, 0.93832, 0.93952, 0.93123, 0.91937 and 0.95297 p.u. respectively without the UPFC to 0.96142, 0.97133, 0.94782, 0.93838, 0.92755 and 0.96142 p.u. respectively with the inclusion of UPFC in the transmission system. Similarly, the average power improved from 3.5588, 6.8507, 9.8335, 12.4735, 14.7483 and 6.8507 MW respectively to 3.6223, 6.9713, 10.0095, 12.6952, 15.0113 and 6.9713 MW when the UPFC was applied.
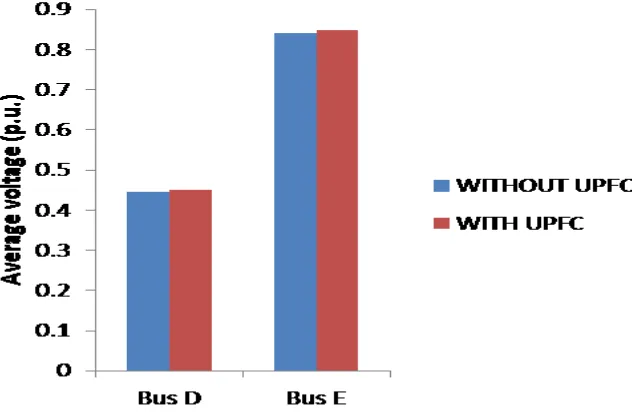
More so, in order to test whether the UPFC can effectively and efficiently work for Maryland transmission station under fault conditions, an earth fault was introduced on D and E transformers.
Figs. 6 and 7 respectively show the average voltage and average power of the buses corresponding to the D and E transformers without and with UPFC under fault condition.
[image:6.612.75.542.320.573.2]The results shown in Figs. 6 and 7 revealed that despite the earth fault introduced on D and E transformers, the average voltage for D and E still improved from 0.4467 and 0.84005 p.u. respectively without UPFC to 0.4507 and 0.8475 p.u. with the application of UPFC. Also, the average power for D and E under fault condition improved from 1,9435 and 5.3665 MW respectively without UPFC to 1.9775 and 5.4625 MW when UPFC was applied. The results of this work therefore showed that the application of UPFC can improve the voltage and power profiles of the power system under study. Hence, UPFC may be deployed for enhancing power system performance.
International Journal of Emerging Technology and Advanced Engineering
Website: www.ijetae.com (ISSN 2250-2459,ISO 9001:2008 Certified Journal, Volume 5, Issue 6, June 2015)
361
Fig. 3 Simulink model of the Maryland 132/33/11 kV power transmission system with UPFC
TABLE I
33KVTRANSMISSION ROUTE LOADS [12]
Feeder/Transformer turns ration/rating Load (MW) Designation
Alausa 33 kV 25 A
PTC 33 kV 37.5 B
TIA - 15MVA, 33/11 kV 12.5 C
T2A - 15MVA, 33/11 kV 12.5 D
T3A - 15MVA , 33/11 kV 12.5 E
International Journal of Emerging Technology and Advanced Engineering
Website: www.ijetae.com (ISSN 2250-2459,ISO 9001:2008 Certified Journal, Volume 5, Issue 6, June 2015)
[image:8.612.120.427.140.340.2]362
Fig. 4 Bar chart showing average voltage without and with UPFC
[image:8.612.139.441.367.555.2]International Journal of Emerging Technology and Advanced Engineering
Website: www.ijetae.com (ISSN 2250-2459,ISO 9001:2008 Certified Journal, Volume 5, Issue 6, June 2015)
[image:9.612.151.467.142.348.2]363
Fig. 6 Bar chart showing the average voltage without and with UPFC under earth fault
Fig. 7 Bar chart showing the average power without and with UPFC under earth fault
V. CONCLUSION
The modern approach towards the improvement of power system performance points in the direction of the use of advanced control technology. In this work, we examined the effect of UPFC in enhancing power system performance using the Maryland 132/33/11 kV power transmission station as a case study.
[image:9.612.134.476.389.578.2]International Journal of Emerging Technology and Advanced Engineering
Website: www.ijetae.com (ISSN 2250-2459,ISO 9001:2008 Certified Journal, Volume 5, Issue 6, June 2015)
364
REFERENCES
[1] Fardanesh, B., Shperling, B., Uzunovic, E. and Zelingher, S. 2000. Multi-convener FACTS devices: The Generalized Unified Power Flow Controller (GUPFC). IEEE Power Engineering Society Summer Meeting, 2: 1020-1025.
[2] Hingorani, N.G and Gyugyi, L. 2000. Understanding FACTS: Concepts and Technology of Flexible AC Transmission Systems. Institute of Electrical and Electronic Engineers Press, New York. [3] Sowjanya, S and Srinivasarao, J. 2012. Design of FACTS device for
the improvement of power system stability using mathematical matching controller. IOSR Journal of Electrical and Electronics Engineering, 1 (3): 7-11.
[4] Murali, D., Rajaram M. and Reka N. 2010. Comparison of FACTS devices for power system stability enhancement. International Journal of Computer Applications, 8: 30-35.
[5] Singh, S.N. 2006. Flexible AC Transmission Systems (FACTS) controllers: an overview. International Journal of Energy Technology and Policy, 4 (3): 236-254.
[6] Gupta, J.B. 2011. A course in power system. S.K. Katari and Sons Publisher, New Delhi, India.
[7] Song, Y.H. and Johns, A.T. 1999. Flexible AC Transmission Systems (FACTS). The Institution of Electrical Engineers, UK. [8] Ibe, A.O. 2011. Nigerian Electric Power Supply Quality
Improvement. Scientia Africana,10 (1): 21-22.
[9] Tarik A. and Teleke S. 2006. Modeling and Comparison of Synchronous Condenser and SVC, Thesis presented for Master Programme in Electric Power Engineering, Chalmers University of Technology, Sweden.
[10] Lerch, E. Povh, D. Witzmann, R. Hlebcar, R and Mihalic, R. 1994. Simulation and performance analysis of unified power flow controller, Conseil International des GrandsRe´seaux Electriques, Paris, paper 140-205.
[11] Matlab Software (R2009b Version). The Mathworks, Inc, Natick, MA, USA.
![Fig. 1 Single-line diagram of a UPFC [11]](https://thumb-us.123doks.com/thumbv2/123dok_us/8699621.879222/3.612.60.288.367.564/fig-single-line-diagram-of-a-upfc.webp)