International Journal of Emerging Technology and Advanced Engineering
Website: www.ijetae.com (ISSN 2250-2459, ISO 9001:2008 Certified Journal, Volume 4, Issue 1, January 2014)
349
Optimization and Sensitivity Analysis of a Hybrid System in
KISH_IRAN
Ali Salmani
1, Samaneh Sadeghzadeh
2, Majid R.Naseh
31
M.Sc. Student,Sciences & Researches Branch of Islamic Azad University, Birjand, Iran.
2 M.Sc. Students,Sciences & Researches, University of Shahrood, Shahrood, Iran. 3Asst. Professor, Dept. of Electrical Engineering, Islamic Azad University, Birjand, Iran.
Abstract—This paper is based on the analysis of a several
hybrid energy system models for optimization. For decentralized or remote areas, where grid connection is almost not possible, renewable energy generation system can be a reliable and optimized source of energy. The analysis of the hybrid systems are modeling in the HOMER software package. The HOMER software was utilized as the assessment tool with modeling performed with hourly load data input from Kish Island in tropical area of Hormozgan, Iran. In this study, a remote island of Iran has been taken for the discussion of the cost optimization analysis of a hybrid energy generation system. Here, HOMER is used to examine the most cost effective configurations among a set of systems for electricity requirement of 60 KWh/day primary load with 7.9 kW peak load.
Keywords— Optimization, Sensitivity Analysis, Hybrid
system, Renewable energy, HOMER
I. INTRODUCTION
HOMER, the micro power optimization model, simplifies the task of evaluating designs of both off-grid and grid-connected power systems for a variety of applications. HOMER is a software that designs the most optimized and cost effective hybrid generation system component configuration after a huge number of hourly simulations for a certain arena considering some parameters and component prices. The load profile, solar radiation data, wind speed data, prices of the system components have to be provided to the software.
HOMER performs hundreds or thousands of hourly simulations to ensure the best possible matching between supply and design in order to design the optimum system. To observe the impact of changes of the parameters such as, solar isolation variation, PV investment cost variation, wind speed and diesel fuel price variation on the optimum result, sensitivity analysis can also be done. HOMER simulates the operation of a system by making energy balance calculations for each of the 8,760 hours in a year.
For each hour, HOMER compares the electric and thermal demand in the hour to the energy that the system can supply in that hour, and calculates the flows of energy to and from each component of the system.[1]
For systems that include batteries or fuel-powered generators, HOMER also decides for each hour how to operate the generators and whether to charge or discharge the batteries. After simulating all of the possible system configurations, HOMER displays a list of configurations, sorted by net present cost (sometimes called lifecycle cost), that can be used to compare system design options. [1]
Many islands in the world live in isolated areas far from the main utility grid. It is really impossible their meet by the conventional sources because of the high cost of transport and the distribution of energy to this remote areas [2]. These islands do not have access to modern sources of energy including electricity. The electric provisioning of these sectors is done by the hybrid systems of production of electricity whose diesel generator plays a significant role like auxiliary source. The concept of hybrid energy system is shown in Fig 1 in which the diesel generator (or the electrical supply network) is used as auxiliary source [3]. In the past, the hybrid systems have been considered as preferred for remote systems like radio telecommunication, satellite earth stations, or at sites far away from a conventional power system [4, 5, 6, 7]. Today, there is a trend to update the existing one source system (PV, wind or hydro) into hybrid system [8].
II. HYBRID RENEWABLE ENERGY SYSTEM
Among the renewable energy sources, solar and wind energy have been utilized with diesel engine in this study. The hybrid generation system consists of an electrical load, renewable energy sources and other system components such as PV, wind turbines, battery and converter. Fig.1 shows the hybrid energy renewable system.
International Journal of Emerging Technology and Advanced Engineering
Website: www.ijetae.com (ISSN 2250-2459, ISO 9001:2008 Certified Journal, Volume 4, Issue 1, January 2014)
[image:2.612.52.286.136.289.2]350
Figure 1. Complete hybrid energy renewable system.
In the present work, the selection and sizing of components of hybrid power system has been done using HOMER software. HOMER is general purpose hybrid system design software that facilitates design of electric power systems for stand-alone applications .
III. ENERGY RESOURCES FOR HYBRID POWER SYSTEM
For this hybrid system, the meteorological data of Solar Radiation, hourly wind speed are taken for island of Kish(Latitude 26° 33' 28" North / Longitude 54° 1' 10" East)
A.Electric Load
A group of households has been considered at KISH Island. The annual peak load to 7.9 Kw and primary load to 60 KWh/day.Fig.2 shows load profile on a day.
Figure 2. Daily load profile
The proposed hybrid power system is designed to ensure the electric supply of a household with an average energy consumption of 60 K Wh/d and peak load of 7.9K W.
B.Solar Energy
[image:2.612.52.285.505.637.2]In this study, monthly average global radiation data has been taken from NASA (National Aeronautics and Space Administration)
Figure 3. Solar radiation data throughout the year.
PV arrays costs vary based on their technology.
The capital costs of a PV system include: the PV array cost and other costs such as labor, installation and structure costs. Different PV array costs were investigated and finally a 1 kW PV array cost was assumed to be $6000 and the replacement cost is 5000$. Operating and Maintenance costs are not high for a PV system; we assumed $10/Kw per year. The system is designed with no tracking and a range of sizes is considered from 0 to 20 kW. HOMER will simulate the system within the given range and will give the output with the optimal size of PV.
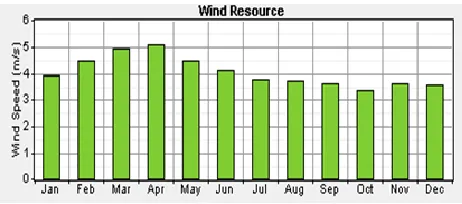
C.Wind Energy
Wind speed also varies seasonally. Average wind speed
of the respective area is 4.039 m/s These data were
collected from IRAN METEOROLOGICAL
ORGANIZATION (IRIMO)[9]. Figure4 shows the
monthly wind speed variation.
[image:2.612.329.560.567.669.2]International Journal of Emerging Technology and Advanced Engineering
Website: www.ijetae.com (ISSN 2250-2459, ISO 9001:2008 Certified Journal, Volume 4, Issue 1, January 2014)
351
The Weibull value: K value is a measurement of Distribution of wind speed over the year. The value of K is Taken 1.97 in this study. The autocorrelation factor: This factor measures the Randomness of the wind. Higher values indicate that the wind speed in 1 hour tends to depend strongly on the wind speed in the previous hour. Lower values mean that the wind speed tends to fluctuate in a more random fashion from hour to hour.
The autocorrelation factor value is taken as 0.85. The diurnal pattern strength: It is a measure of how strongly the wind speed depends on the time of day. In most locations, the afternoon trends to be windier than morning. Higher values indicate that there is a strong dependence on the time of the day. In this study, 0.25 is used.
The hour of peak wind speed: It is simply the time of day tends to be windiest on an average throughout the year. In this study, 15 is used as the hour of peak wind speed.
D.Diesel Generators
The cost of a diesel generator depends on its size. The diesel generators utilized are of 10kW for a capacity range of 5 Kw to 45 Kw, the slope and the intercept are 0.33 l/h/Kw and 0.05 l/h/Kw respectively. A diesel generator of 10 Kw rated power with technical and economic parameters in TABLE I.
TABLEI.
SPECIFICATIONSOFDIESELGENERATORS
Parameter Unit Value
Capital cost $/KW 10000
Replacement $/KW 8000
Operation and maintenance cost
$/h 20
Operational life time Hours 15000
Minimum load ratio Percent 10
Fuel curve intercept l/h/ KWrated 0.05
Fuel curve slope l/h/ KWrated 0.33
Fuel price
$
.8E.Wind Turbine
Starting wind speed is considered as 3 m/s in this study. Cut off wind speed is 14 m/s .Technical parameters and cost assumptions are stated in Table II.
TABLE II
SPECIFICATIONSOFWINDTURBINE
Parameter Unit Value
Rated power KW 100
Starting wind speed m/s 1
Hub height m/s 18.288
Cut-off wind speed m/s 14
Capital cost $/KW 32000
Replacement $/KW 29000
Operation and maintenance
cost $/year/turbine 400
life time year 30
Figure5 Power curve of Generic 100 Kw wind turbine.
F.Battery
International Journal of Emerging Technology and Advanced Engineering
Website: www.ijetae.com (ISSN 2250-2459, ISO 9001:2008 Certified Journal, Volume 4, Issue 1, January 2014)
352
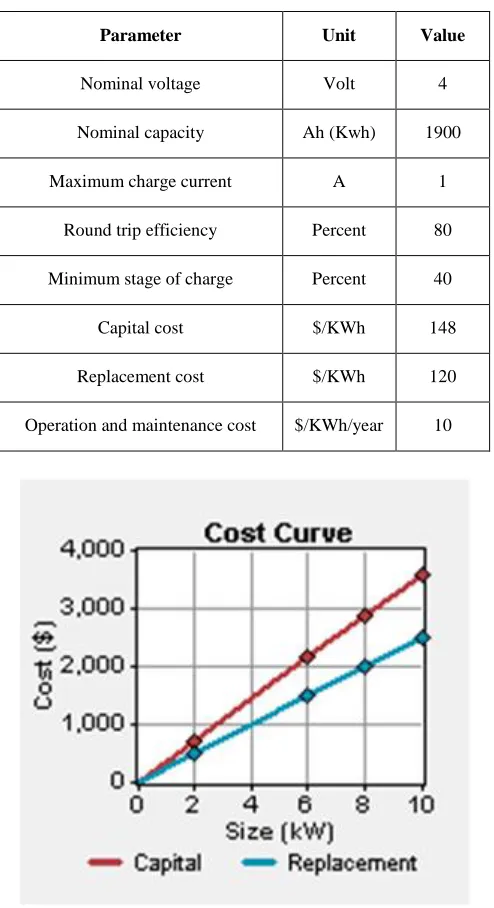
TABLEIII.
SPECIFICATIONSOFBATTERY
Parameter Unit Value
Nominal voltage Volt 4
Nominal capacity Ah (Kwh) 1900
Maximum charge current A 1
Round trip efficiency Percent 80
Minimum stage of charge Percent 40
Capital cost $/KWh 148
Replacement cost $/KWh 120
Operation and maintenance cost $/KWh/year 10
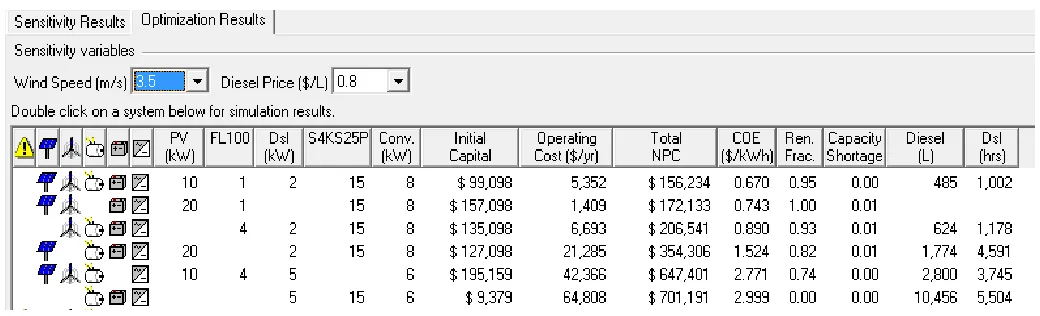
Figure 6. COST CURVE OF CONVERTERS.
IV. COST OPTIMIZATION
The aim of this study is to achieve a stand-alone hybrid generation system, which should be appropriately designed in terms of economic, reliability, and environ-mental
measures subject to physical and operational
constraints/strategies [10, 11, and 12].
The system cost is defined as sum of PV cost (CPV), WG cost (CWG), battery cost (CBAT), electrolyser cost (CELEC), FC cost (CFC), convertor cost (CCONV), and hydrogen tank cost(CTANK).
CSYSTEM = CPV + CWG + CBAT + CELEC + CFC + CCONV
+ CTANK (1)
The cost for each element should be deducted:
Ci = Ni * [CCosti + RCosti * Ki + OMCosti] (2) i = PV,WG, Battery, FC, Electrolyser,
Where Ni is the number/size of the system component, CCosti is the capital cost, RCosti is the replacement cost, Ki is the number of replacement, and OMCosti is operation and maintenance cost through the system operation[13].
V. RESULTS AND DISCUSSIONS
[image:4.612.46.293.154.608.2]International Journal of Emerging Technology and Advanced Engineering
Website: www.ijetae.com (ISSN 2250-2459, ISO 9001:2008 Certified Journal, Volume 4, Issue 1, January 2014)
[image:5.612.46.566.130.288.2]353
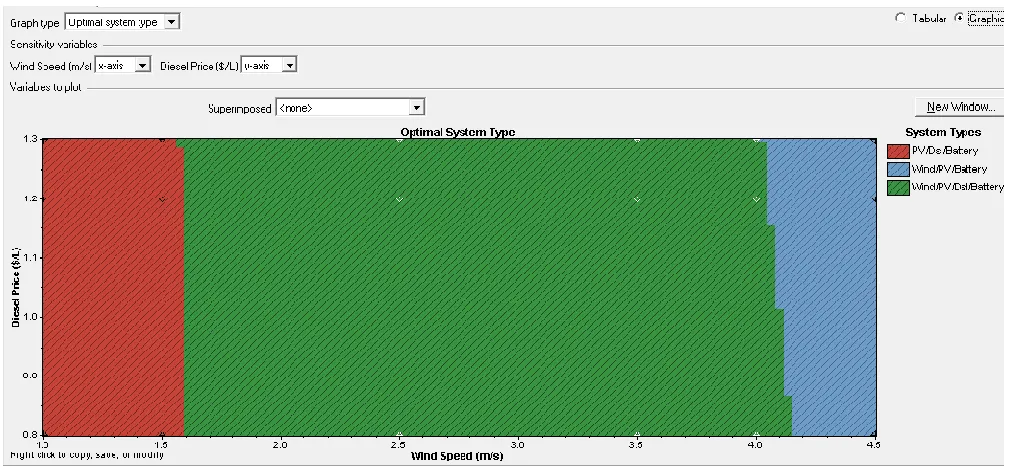
FIGURE 7. HOMER simulation results
VI. OPTIMIZATION RESULTS
Lots of simulations have been performed to find out the Most optimized and cost effective configuration of the hybrid system considering all the probable system components with respect to their prices. In figure7, a list has been presented of different configurations with respect to the ascending order of respective cost/ KWh and NPC. The combination of a PV array (10 KW), a wind turbine (100 KW), a diesel generator (20 KW) minimum and 15batteries is economically the most feasible with COE 0.67 $ /Kwh and a minimum NPC (Net Present Cost) of $156.234, without any annual energy shortage.
The second optimum system configuration is the combination of solar arrays (20kw), Wind Turbine, battery storage, and inverter. In this configuration, diesel generator has been eliminated and the number of solar arrays has been doubled (20kw). In this combination, Total NPC has increased slightly ($172,133).
The third optimum system configuration is the combination of wind turbine, Diesel Generators, battery storage, and inverter, In this scenario, the number of diesel generators are equal to the first configuration, but the number of wind turbines has increased to 4 and the solar arrays have removed. In this condition, the Total NPC grows significantly.
The next scenario shows that by increasing the solar arrays (20 kw) and elimination of wind turbines the Total NPC rises to $354,306 .this case is like third optimum without Wind Turbine.
The available energy from each renewable source, when the peak demand is low, will be stored in batteries. All sources including battery storage will contribute together to respond to the peak demand.
The solar source is available only during day time. Since the maximum output of PVs is during the mid-day the solar power can take care of the peak load in the mid-day where wind turbine alone would not be able to respond to the total demand. During the time when the demand is low, the excess energy produced by wind turbine and PVs is used to charge the batteries.
The highest load demand is during evenings. Since PVs do not produce power, the battery storage will produce enough power to meet load requirement during peak time. Wind turbine will run all the year and supply power to the base load.
VII. SENSITIVITY RESULTS
International Journal of Emerging Technology and Advanced Engineering
Website: www.ijetae.com (ISSN 2250-2459, ISO 9001:2008 Certified Journal, Volume 4, Issue 1, January 2014)
[image:6.612.60.566.132.367.2]354
FIGURE 8. Sensitivity analysis of system in terms of wind speed and diesel price
VIII. EMISSION ANALYSIS
Energy generation from renewable energy sources reduces the emission of SO2 and NOx to the atmosphere.
TABLE V AMMOUNT OF EMISSIONS.
Pollutant Emissions(kg/yr)
Carbon monoxide 6.5
Unburned hydrocarbons 0.72
Particulate matter 0.49
Sulfur dioxide 2.2
Nitrogen oxides 58
IX. CONCLUSION
A particular goal of this study was to show that at a site where solar and hydro resources are available. This system is able to developing and acting in remote areas that the lighting loads have the most contribution in peak load [14].
It was shown that the obtained optimal configuration of the hybrid wind-PV-battery system could overcome the effect of the climatic change on the reliable supply of the load.
The simulations results prove that the best solution to reliable load supply without interruption under climatic changes is the combination of a diesel generator with the hybrid wind-PV-battery system.
REFERENCES
[1] N. Mahmud and a. Hassan “Modeling and Cost Analysis of Hybrid Energy System for St. Martin Island Using HOMER” Informatics, Electronics & Vision (ICIEV), 2013 International Conference [2] S. Rehman, I.M. El-Amin, F. Ahmad, S.M. Shaahid, A.M. Al-
Shehri, J.M. Bakhashwain, A. Shash,2007. Feasibility study of hybrid retrofits to an isolated off-grid diesel power plant..
[3] Pragya Nema, R.K. Nema and Saroj Rangnekar, 2009. A current and future state of art development of hybrid energy system using wind and PV-solar: A review.
[4] Renewable and Sustainable Energy Reviews, 13(8):2096- 2103. [5] Hongxing Yang, Zhou Wei, Lou Chengzhi, 2009. Op=mal design
and techno-economic analysis of a hybrid solar– wind power generation system. Applied Energy, 86(2):163–169.
[6] Wei Zhou, Hongxing Yang, Zhaohong Fang, 2008. BaNery behavior prediction and battery working states analysis of a hybrid solar–wind power generation system. Renewable Energy, 33(6):1413–1423. [7] S. Diaf, M. Belhamel, M. Haddadi, A. Louche, 2008.Technical and
[image:6.612.37.301.443.628.2]International Journal of Emerging Technology and Advanced Engineering
Website: www.ijetae.com (ISSN 2250-2459, ISO 9001:2008 Certified Journal, Volume 4, Issue 1, January 2014)
355
[8] Ali Naci Celik, 2003. Techno-economic analysis of autonomous PV–wind hybrid energy systems using different sizing methods. Energy Conversion and Management; 44(12):1951–1968
[9] http://www.weather.ir/
[10] L. Wang and C. Singh, “PSO-Based Multi-Criteria Optimum Design of A Grid-Connected Hybrid Power System With Multiple Renewable Sources of Energy,” Proc. IEEE Int. Conf. on Swarm Intelligence Symposium, 2007.
[11] S.M. Shaahid, and M.A. Elhadidy, “Economic analysis of hybrid photovoltaic-diesel-battery power systems for residential loads in hot regions-A step to clean future,” Renewable and Sustainable EnergyReviews, pp.488-503, 2008.
[12] H. Kord, and A. Rohani, “An Integrated Hybrid Power Supply for Off-Grid Applications Fed by Wind/Photovoltaic/Fuel Cell Energy Systems,” Int. Power System Conference (PSC), Tehran, Nov. 2009. [13] A. Rohani and k.mazlumi and h. Kord “ Modeling of a Hybrid Power System for Economic Analysis and Environmental Impact in HOMER”