Simultaneous detection and quantification
of three bacterial meningitis pathogens by
SERS
Gracie, K, Correa, E, Mabbott, S, Dougan, JA, Graham, D, Goodacre, R and Faulds,
K
http://dx.doi.org/10.1039/C3SC52875H
Title
Simultaneous detection and quantification of three bacterial meningitis
pathogens by SERS
Authors
Gracie, K, Correa, E, Mabbott, S, Dougan, JA, Graham, D, Goodacre, R
and Faulds, K
Type
Article
URL
This version is available at: http://usir.salford.ac.uk/id/eprint/41371/
Published Date
2013
USIR is a digital collection of the research output of the University of Salford. Where copyright
permits, full text material held in the repository is made freely available online and can be read,
downloaded and copied for noncommercial private study or research purposes. Please check the
manuscript for any further copyright restrictions.
Simultaneous detection and quanti
fi
cation of three
bacterial meningitis pathogens by SERS
Kirsten Gracie,aElon Correa,bSamuel Mabbott,aJennifer A. Dougan,a Duncan Graham,aRoyston Goodacre*band Karen Faulds*a
Bacterial meningitis is well known for its rapid onset and high mortality rates, therefore rapid detection of bacteria found in cerebral spinal fluid (CSF) and subsequent effective treatment is crucial. A new quantitative assay for detection of three pathogens that result in bacterial meningitis using a combination of lambda exonuclease (l-exonuclease) and surface enhanced Raman scattering (SERS) is reported. SERS challenges current fluorescent-based detection methods in terms of both sensitivity and more importantly the detection of multiple components in a mixture, which is becoming increasingly more desirable for clinical diagnostics.l-Exonuclease is a processive enzyme that digests one strand of double stranded DNA bearing a terminal 50-phosphate group. The new assay format involves the simultaneous hybridisation of two complementary DNA probes (one containing a SERS active dye) to a target sequence followed by l-exonuclease digestion of double stranded DNA and SERS detection of the digestion product. Three meningitis pathogens were successfully quantified in a multiplexed test with calculated limits of detection in the pico-molar range, eliminating the need for time consuming culture based methods that are currently used for analysis. Quantification of each individual pathogen in a mixture using SERS is complex, however, this is the first report that this is possible using the unique spectral features of the SERS signals combined with partial least squares (PLS) regression. This is a powerful demonstration of the ability of this SERS assay to be used for analysis of clinically relevant targets with significant advantages over existing approaches and offers the opportunity for future deployment in healthcare applications.
Introduction
The detection of DNA sequences correlating to specic disease states has become vital in medical diagnostics. The majority of current methods of DNA detection involve the polymerase chain reaction (PCR) coupled with various uorescence-based tech-niques.1,2 An alternative optical spectroscopy is surface
enhanced Raman scattering (SERS) which is fast becoming a sensitive,3highly molecularly specic technique with the ability
to detect multiple analytes simultaneously due to the charac-teristic molecular ngerprint spectra obtained.4,5 As a result,
numerous assays have been developed that involve the direct
detection of DNA using SERS.6–11 The detection of many
different disease states is possible but in order to demonstrate the potential of using SERS for analysis of disease, we opted for an infectious disease target since when the target is present, a positive result and identication is possible.
Meningitis is an inammation of the lining around the brain and spinal cord. Most cases of meningitis are caused by viruses such as herpes, mumps or measles.12–14Unfortunately there are no effective therapies for most viruses that cause meningitis; therefore treatment is aimed at limiting the effects of the symptoms. Meningitis and septicaemia caused by bacteria are usually more serious compared to viral meningitis and require urgent medical attention with appropriate antibiotic therapy. Around 3400 people each year in the UK and Ireland are affected by bacterial meningitis, according to an investigation by the
Meningitis Research Foundation.15,16 Three of the most
common meningitis pathogens are Haemophilus inuenzae,
Streptococcus pneumoniae and Neisseria meningitidis. Most courses of treatment involve the administration of antibiotics, however this can obscure results from culture based methods, therefore making a positive diagnosis difficult. It is imperative that the correct pathogen is identied to allow for the most effective course of treatment. Results obtained from this new assay format are not affected by the presence of any antibiotics. SERS is a promising technique for the detection of bacterial meningitis pathogens. SERS has previously been used to detect DNA due to the high discrimination achieved from the molec-ularly specicngerprint spectra.17–19Whilst SERS of individual aCentre of Molecular Nanometrology, WestCHEM, Department of Pure and Applied
Chemistry, University of Strathclyde, 295 Cathedral Street, Glasgow, G1 1XL, UK. E-mail: [email protected]
bSchool of Chemistry and Manchester Institute of Biotechnology, University of
Manchester, 131 Princess Street, Manchester, M1 7ND, UK
Cite this:Chem. Sci., 2014,5, 1030
Received 16th October 2013 Accepted 2nd December 2013
DOI: 10.1039/c3sc52875h
www.rsc.org/chemicalscience
Science
EDGE ARTICLE
Open Access Article. Published on 20 December 2013. Downloaded on 10/02/2017 14:35:47.
This article is licensed under a
Creative Commons Attribution 3.0 Unported Licence.
View Article Online
DNA bases can be obtained, this does not allow identication of the order of bases and therefore is not sequence specic. As a result dye labels can be used to allow sequence specic detec-tion of DNA using SERS.9Using a label, such as auorescent dye
attached to a specic sequence, the SERS signal of the label will be indicative of the presence of that specic sequence. SERS has been employed in various multiplex assays for the detection of several DNA sequences simultaneously. In 2002, Grahamet al.
were therst to use a SERS multiplex system for the detection of
the cystic brosis trans-membrane conductance regulator
(CFTCT) gene, which can be expressed in three forms.6Further
developments include an assay that reported the multiplex detection of DNA sequences coding for methicillin-resistant
Staphylococcus aureus (MRSA).18 The assay was used for the
detection of three genes associated with MRSA using three differentuorophores as the SERS labels. Vo-Dinhet al. devel-oped a multiplex DNA detection assay using“molecular senti-nels”, a structure that contains a looped sequence of DNA held
together by two complementary sequences forming stems.20
“Molecular sentinels” have been used to achieve multiplexed detection of two genes that are biomarkers for breast cancer.
These examples highlight the use of SERS for clinically relevant targets however one of the main strengths of SERS is the ability to detect several analytes in a mixture and without separation steps. The simultaneous detection of ve labelled oligonucleotides was reported by Faulds et al.4 Two different
excitation wavelengths were used based on the responses the different dyes gave at different wavelengths. Five labelled oligonucleotides were mixed within a single sample and each of the dyes was successfully detected at either of the two
wavelengths, without the need for any multivariate analysis. Following this success a 6-plex detection system was developed using one excitation wavelength and this time employed che-mometrics,5 which is becoming increasingly popular for the
analysis of Raman data.21,22Each of the six dye labelled DNA
sequences in the mixture were successfully identied using multivariate analysis. Zhonget al.then used the same 6-plex mixture and analysed the results using Bayesian methods, which gave a more accurate analysis of the various components within the mixture.23
The assay format reported in this study involves the use of the enzymel-exonuclease (Fig. 1).57It is a processive enzyme24–26
that digests one strand of 50-phosphorylated double stranded DNA producing mononucleotides and leaving one DNA strand
intact.27 The enzyme has a toroidal structure with three
subunits. A central channel passes through the enzyme that decreases in size from 30A to 15˚ ˚A. Due to this feature, double stranded DNA can only enter the wider end of the channel and single stranded DNA is expelled from the narrow end.28Only
one of the three subunits is bound to the DNA substrate, the other two are present to ensure the enzyme moves in a proc-essive manner along the full length of the DNA sequence and does not move backwards. When digestion occurs, a positively charged pocket within the subunit attracts the negatively charged phosphorylated DNA strand. The phosphodiester linkages are cleaved producing mononucleotides that leave through the narrow end of the central channel.29l-Exonuclease
has previously been used in aptamer research30and has been
subject to many investigations into the kinetics and activity of the enzyme under different experimental conditions.31–34 The
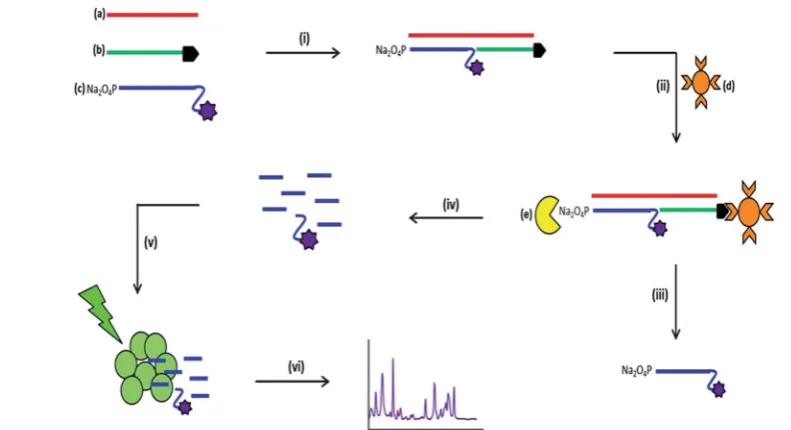
Fig. 1 Schematic of the SERS detection assay illustrating each step involved. Two selectively modified DNA sequences; 30biotinylated probe (b) and 50-phosphate modified probe that also possess a 30fluorophore modification (c) hybridise to a single target DNA sequence (a) in a process known as sandwich hybridisation (i), using 0.3 M phosphate buffered saline (PBS) at 90C for 10 min then 10C for 10 min. Streptavidin coated magnetic beads (d) are then added to the reaction mixture (ii) and the newly formed duplex is retained on the beads due to the biotin modi-fication. Subsequent washing steps (iii) take place to remove any excess/unhybridised DNA from the reaction mixture and the beads are resuspended in 30mL of exonuclease buffer (New England Biolabs, Herts, UK).l-Exonuclease (e) is then added to the reaction mixture for double stranded digestion to occur (iv) for 90 min at 37C. The digestion products are then added to a solution containing silver nanoparticles (150mL) and spermine hydrochloride (20mL, 0.1 M) (v) and SERS analysis is carried out (vi) using an excitation wavelength of 532 nm and a diode laser.
Open Access Article. Published on 20 December 2013. Downloaded on 10/02/2017 14:35:47.
This article is licensed under a
[image:3.595.85.481.425.640.2]use ofl-exonuclease in this assay has the potential to exploit the signal amplication compared to target amplication methods such as PCR.35,36The single strand of DNA that is leintact
post-digestion is capable of undergoing successive post-digestion cycles, releasing theuorescent dye into solution and amplifying the signal obtained.37
Here we report the combination of a new disease specic DNA-based SERS assay that demonstrates the simultaneous detection of three bacterial meningitis pathogens.38Limits of detection that
rival currentuorescent-based methods were obtained, however more importantly, by using chemometric analysis, each pathogen in the multiplex was successfully quantied.
Materials and methods
Colloid synthesis
Silver nanoparticles were synthesised using a modied Lee and Meisel method.39Silver nitrate (90 mg) was dissolved in 500 mL
distilled water. The solution was heated rapidly to boiling with continuous stirring. Once boiling, an aqueous solution of sodium citrate (1%, 10 mL) was added quickly. The heat was reduced and the solution was leto boil gently for 90 min with stirring. The colloid was then analysed by UV-vis spectroscopy and thelmaxwas 411 nm with the full width half-height (FWHH) measured to be 103 nm. The concentration of the colloid was calculated to be 0.3 nM.
Oligonucleotides
The three target pathogen sequences were those used by Guiver
et al.for their simultaneous detection using real-time PCR.38
Bio-tinylated DNA and unmodied target DNA sequences were
purchased on a 0.01mM scale with HPLC purication from
Euro-ns MWG (Ebersberg, Germany). 50-Phosphate/dye modied DNA sequences were ordered on a 100 nM scale with HPLC purication from Integrated DNA Technologies (Leuven, Belgium) (Table 1).
Buffer
Exonuclease buffer was supplied by New England Biolabs
(Cambridge, UK) consisting of; 67 mM glycine–KOH, 2.5 mM MgCl2and 50mg mL1bovine serum albumin (BSA). The pH of the buffer was 9.4. Exonuclease buffer was supplied at 10 concentration and was diluted to 1concentration when used in the assay.
PCR
PCR was carried out using a Stratagene MX3005Puorimeter and the commercially available Qiagen PCR reagents. Each reaction had a total volume of 25mL; 2.5mL of Qiagen reaction buffer (10), 1mL of MgCl2solution (25 mM), 0.4mL of
deoxy-nucleoside triphosphates (10 mM), 1 mL of forward primer
(10 mM), 1 mL of reverse primer (10mM), 0.5 mL of Taq poly-merase (5 U), 1mL of template DNA (approx. 5106copies per
mL) and made up to the total volume (25 mL) with DEPC
(diethylpyrocarbonate) treated water. PCR was then carried out using the following thermal prole: 10 min at 95C, followed by 45 cycles of 95C for 30 s, 58C for 1 min then 72C for 1 min and anal extension for 1 min at 72C.
Detection assay
A biotinylated modied sequence and a 50-phosphate/
uo-rophore modied sequence underwent a sandwich
hybrid-isation event with one complementary (target) sequence using a Minicycler PTC-150 system. An aliquot of each DNA sequence (10mL, 1mM) was added to a PCR tube containing phosphate buffered solution (70mL, 0.3 M). The temperature was held at 90C for 10 min, and then was lowered to 10C for 10 min. For theno targetcontrol, the target DNA sequence was omitted and
replaced with distilled water, and the non-complementary
control used a sequence that was not complementary to either of the modied probes in place of the target sequence. Once the
sequences were hybridised, 15 mL of streptavidin coated
magnetic beads were added to the PCR tubes and leat room temperature for 30 min. Three washing steps were carried out using phosphate buffered solution (70mL, 0.3 M). The beads were then resuspended in exonuclease buffer (30mL, 1) and lambda exonuclease was added (2mL, 1 U) for digestion to occur
for 90 min at 37 C. SERS analysis was performed
post-digestion.
SERS analysis
[image:4.595.45.553.611.732.2]For the limit of detection studies and multiplex assay experi-ments, SERS was carried out using an Avalon Instrument Ramanstation R3 (Belfast, UK), with an excitation wavelength of 532 nm from a diode laser. Disposable 1.5 mL PMMA semi-micro cuvettes were used. To the cuvette, 30mL ofl-exonuclease digestion products was added to spermine hydrochloride
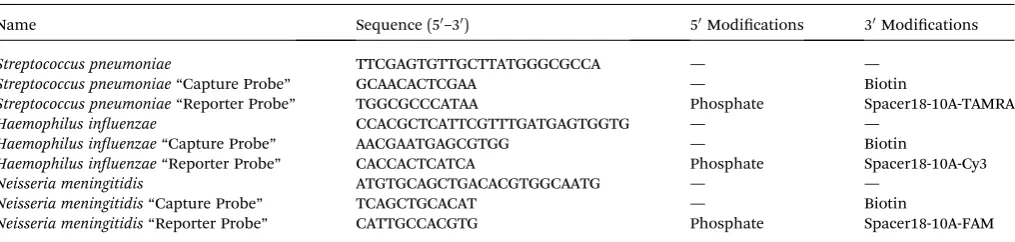
Table 1 Oligonucleotide sequences and modifications used in the SERS detection assay
Name Sequence (50–30) 50Modications 30Modications
Streptococcus pneumoniae TTCGAGTGTTGCTTATGGGCGCCA — —
Streptococcus pneumoniae“Capture Probe” GCAACACTCGAA — Biotin
Streptococcus pneumoniae“Reporter Probe” TGGCGCCCATAA Phosphate Spacer18-10A-TAMRA
Haemophilus inuenzae CCACGCTCATTCGTTTGATGAGTGGTG — —
Haemophilus inuenzae“Capture Probe” AACGAATGAGCGTGG — Biotin
Haemophilus inuenzae“Reporter Probe” CACCACTCATCA Phosphate Spacer18-10A-Cy3
Neisseria meningitidis ATGTGCAGCTGACACGTGGCAATG — —
Neisseria meningitidis“Capture Probe” TCAGCTGCACAT — Biotin
Neisseria meningitidis“Reporter Probe” CATTGCCACGTG Phosphate Spacer18-10A-FAM
Open Access Article. Published on 20 December 2013. Downloaded on 10/02/2017 14:35:47.
This article is licensed under a
(20mL, 0.1 M), 250mL distilled water and 150mL silver citrate colloid. The sample was then mixed thoroughly and immedi-ately analysed by SERS. Spectra were baseline corrected using a multipoint polynomial t and level and zero mode in Grams soware (AI 7.00). When carrying out limit of detection studies, 5 scans of 5 replicate samples at each concentration were ana-lysed. The equation of the line obtained from the dilution studies was used to calculate the limits of detection. The limit of detection was calculated to be 3 times the standard deviation of the blank, divided by the gradient of the straight line. For the chemometric studies, SERS analysis was performed using an Avalon Plate Reader, with an excitation wavelength of 532 nm. A 96 well plate was placed onto a stage and the instrument's soware was used to move the stage automatically so that a spectrum can be recorded from each well. The accumulation time was 0.01 s and each well was scanned 5 times. A single well can hold 300 mL. Each well contained 30 mL of dye-labelled oligonucleotide mixture (or post-assay mixture when testing the model), 20 mL spermine tetrahydrochloride, 100 mL distilled water and 150 mL silver citrate colloid. To train the PLS prediction model a suitable and reduced number of base line experiments (66 in total) were designed to be performed in the lab. The design of such experiments was based on the theory of Design of Experiments as previously described by Mabbott
et al.40Five scans ofve replicates of each of the 66 different dye
ratios were analysed and the spectra were averaged prior to model construction. Following this additional samples were generated to test the model and included: (i) additional dye-labelled oligonucleotide combinations and (ii) samples aer having gone through the complete SERS assay; the latter were included as these are the closest to the clinical scenario.
Chemometrics
Data were baseline corrected using the asymmetrical least
squared smoothing method.41 Principal component analysis
(PCA) was performed to assess the reproducibility of the data set using Matlab soware version R2012a (The MathWorks, Natick, MA, USA). PCA reduces the dimensionality of the SERS data, making it easier to identify any variations in the spectra.42,43PCA
was carried out on four different data sets, three consisting of spectra obtained from single pathogen detection experiments and one data set obtained for the multiplex detection of the three pathogens. For quantication of the three pathogens in tertiary mixtures the supervised learning method of partial least squares (PLS) regression was employed. PLS is a multivariate calibration method that relates a set of independent variablesX
(Raman intensities) to a set of dependent variables Y (dye-labelled oligonucleotide concentrations). PLS projects theXand
Yvariables into sets of orthogonal latent variables, scores ofX
and scores ofY, so that the covariance between these two sets of latent variables is maximized.44The purpose of PLS is to build a
linear model Y¼ XB + E, where Bis a matrix of regression coefficients and E represents the difference (error) between observed and predictedYvalues.45Aer calibration of the PLS
models, validation data (new Raman spectra) not used in model building were used to challenge PLS. These included additional
dye-labelled oligonucleotide combinations as well as samples that had gone through the whole SERS assay. If these predic-tions were correct then this would show that our approach could successfully and simultaneously quantify the three pathogens of bacterial meningitis. The PLS algorithm was run in Matlab version R2012a and the scripts are available from the authors on request.
Results and discussion
The bacterial pathogens Neisseria meningitidis, Streptococcus pneumoniaeandHaemophilus inuenzaeare the most common causes of acute bacterial meningitis, which is an extremely serious and in most cases fatal infection that affects the central nervous system.46,47 Traditional laboratory methods involve
lengthy culture for the identication of bacterial meningitis pathogens, which can take up to 36 hours.48,49It has also been
reported that the administration of antibiotics prior to sample collection has a detrimental effect on the positive identication of the bacterial meningitis pathogens. Moreover, several studies have revealed that there is a marked discrepancy between the number of suspected cases of bacterial meningitis and
conrmed cases of bacterial meningitis using culture
methods.38,50,51A solution to this problem was to use a
non-culture method such as PCR, and this is now being used extensively and involves the amplication of pathogen DNA sequences and provides a universal detection technique for bacteria.52However, this approach has been hindered due to the
presence of residual bacterial DNA that affects any positive results for identication of the pathogens. The most effective course of patient treatment is determined by the results obtained from pathogen identication; therefore an ideal method of identication must be efficient in producing
con-rmative and more importantly reliable objective results. The novel detection assay described herein provides an ideal alter-native to traditional laboratory methods, eliminating the use of DNA amplication and results obtained are not obscured by the administration of antibiotics prior to sample collection. Initial studies involved detecting one pathogen at a time using a SERS-based assay and determining the sensitivity of each pathogen target. Following these experiments, a triplex was designed to detect the three pathogens,N. meningitidis,S. pneumoniaeand
H. inuenzaesimultaneously, all of which are causes of bacterial meningitis. Chemometric analysis was then performed to quantify each pathogen in the multiplex aer the detection assay was performed.
Fig. 1 illustrates the multi-step process used for the detec-tion of the bacterial meningitis pathogens. First, the synthetic pathogen sequence was hybridised to its two respective complementary modied synthetic DNA sequences. Streptavi-din coated magnetic beads were then added, which retained only fully formed duplex DNA. With subsequent washing steps, any unhybridised or excess DNA was removed from the assay.
l-Exonuclease was then added and digestion of the 50 -phos-phate modied probe that also possessed a uorescent dye took place, which therefore liberated the dye from the duplex that was attached to streptavidin coated magnetic bead. The
Open Access Article. Published on 20 December 2013. Downloaded on 10/02/2017 14:35:47.
This article is licensed under a
products of digestion were then added to a mixture of silver nanoparticles (capped with the citrate during reduction) and spermine hydrochloride; this was then followed by SERS analysis, which generated the characteristic SERS spectra of the uorescent dye present on the“Reporter”probe. Citrate reduced silver nanoparticles have an overall negative charge on the metal surface, which repels the negatively charged phos-phate backbone of DNA.53,54The aggregating agent spermine
hydrochloride is positively charged and is used to reduce the negative charge on the nanoparticle surface, allowing the DNA to come into close proximity with the metal surface.55For SERS
enhancement to be obtained the DNA must be either adsorbed or very close to the metal surface and using spermine hydro-chloride facilitates the DNA to come in close proximity to the silver surface.56As well as reducing the negative surface charge,
spermine hydrochloride encourages the formation of
nanoparticle clusters, which create“hotspots”such that when a laser is applied an enhancement in the unique vibrational spectrum is obtained.3 Along with the detection of single
bacterial meningitis pathogens, two control experiments were undertaken each time the assay was performed,no targetand
non-complementary. The non-complementary control was different for each pathogen detection assay. When detecting
S. pneumoniaepathogen, the synthetic sequence forN. menin-gitidis was present and treated as the non-complementary
control. The H. inuenzae sequence was the control when
detectingN. meningitidisand for the detection ofH. inuenzae, the synthetic sequence coding forS. pneumoniaewas the
non-complementary control. No SERS peaks from theuorescent
dye labels should have been observed in either control as the synthetic pathogen target sequence is not present in the assay and therefore the dye labelled probe will be removed during
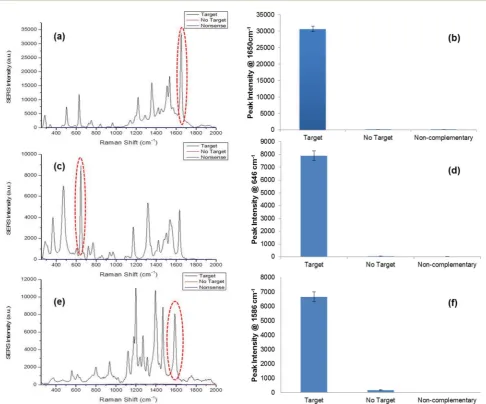
Fig. 2 SERS spectra obtained from single pathogen detection using the SERS assay: (a) SERS spectra of TAMRA observed when detection S. pneumoniae; (b) SERS peak intensities at 1650 cm1for assay and both controls when detectingS. pneumoniae; (c) SERS spectra of FAM observed when detectingN. meningitidis; (d) SERS peak intensities at 646 cm1for assay and both controls when detectingN. meningitidis; (e) SERS spectra of Cy3 observed when detectingH. influenzae; (f) SERS peak intensities at 1586 cm1for assay and both controls when detectingH. influenza. SERS spectra were recorded using an excitation wavelength of 532 nm and a diode laser. Peak intensities were obtained by scanning 5 replicate samples 3 times with an accumulation time of 1 s. Averages are shown and error bars areone standard deviation.
Open Access Article. Published on 20 December 2013. Downloaded on 10/02/2017 14:35:47.
This article is licensed under a
[image:6.595.54.541.257.661.2]the washing steps that were carried out prior to enzyme digestion.
Exact complement synthetic DNA sequences were used for the single pathogen detection experiments. Each synthetic pathogen target sequence had two complementary synthetic probe sequences, each complementary to half of the target sequence. One sequence was modied with a biotin group at the 30end of the strand and this was known as the“Capture”probe. The other sequence, referred to as the“Reporter”probe, was modied at the 50end with a phosphate group that is needed for enzyme digestion to occur; at the 30end there was a spacer-18, which is an 18-atom hexa-ethyleneglycol spacer that was used to stop digestion resulting in a sequence of 10 adenine bases and theuorescent dye being leon the 30end that would then be free for SERS detection. The 10 adenine bases remained attached to the uorescent dye post-digestion and previous studies have shown that this adenine“tail”enhances the SERS signal compared to free dye that does not have a DNA“tail”.11,57
For each of the three pathogens a differentuorescent dye was used to label each of the three target specic probes; when detectingS. pneumoniaetheuorescent dye TAMRA was present on the “Reporter” probe, for the detection of N. meningitidis
FAM was the uorescent dye monitored and nally for the
detection ofH. inuenzaeCy3 was the chosen dye.
The synthetic DNA sequence representative ofS. pneumoniae
was successfully detected using the SERS assay. This was carried
out by monitoring the characteristic TAMRA peaks in the SERS spectrum (Fig. 2a), as this was the dye modication on this
“Reporter”probe. A prominent peak was observed at 1650 cm1 that was present due to the C]C bonds in the dye structure and the peaks observed around 1500–1560 cm1 represented the aromatic ring vibrations.58All peaks observed in the spectrum
were attributed to the structure of TAMRA. As predicted theno targetandnon-complementarycontrols showed no SERS signal since the pathogen sequence had been omitted from the assay, therefore a fully formed duplex was not obtained, i.e. the
“Reporter”probe was not present to facilitate SERS detection (Fig. 2b). N. meningitidis was detected successfully, using the respective synthetic DNA sequence, by monitoring the charac-teristic FAM peaks in the SERS spectrum as this was the dye present on the“Reporter”(Fig. 2c). The peak at 1625 cm1was a result of the C]C vibrations, and similar to the SERS spectrum of TAMRA, peaks within the range 1400–1500 cm1represented CH2and CH3vibrations.58Peaks between 1500 and 1600 cm1 were from the aromatic rings within the structure of FAM. Again
no targetandnon-complementarycontrols did not produce any SERS peaks as expected since the pathogen sequence was not present in the assay and further analysis of peak intensities at
648 cm1 demonstrated that both controls showed no SERS
intensity at this specic characteristic FAM peak (Fig. 2d). Finally, the synthetic DNA sequence of H. inuenzaewas also detected successfully using the novel SERS assay by monitoring
Fig. 3 The assay was performed for each pathogen using the specified concentration range. The calibration curves of normalised SERS peak heights for each pathogen are shown: (a) 1650 cm1peak height used to calculate the limit of detection forS. pneumoniae; (b) 646 cm1peak height used to calculate the limit of detection forN. meningitidis; (c) 1586 cm1peak height used to calculate the limit of detection forH. influenzae. Table (d) summarises calculated limits of detection. SERS spectra were recorded using an Avalon Instrument Ramanstation R3, with an excitation wavelength of 532 nm and a diode laser power of 100 mW. Each point represents the average of 5 replicates of each concentration. Error bars areone standard deviation.
Open Access Article. Published on 20 December 2013. Downloaded on 10/02/2017 14:35:47.
This article is licensed under a
[image:7.595.55.543.378.653.2]the characteristic SERS peaks of the dye Cy3, which was chemically attached to this probe (Fig. 2e). Aromatic vibrations were observed between 1500 cm1and 1600 cm1. The intense peak observed at 1200 cm1was due to the aliphatic chain in the dye structure.58 The non-complementary control gave no
SERS intensity as expected, as the synthetic pathogen sequence was excluded from the assay. This was reaffirmed upon further analysis of the peak at 1586 cm1. However, upon peak analysis for the no target control there was a small amount of SERS intensity observed. This can be attributed by the presence of a larger background in the SERS spectrum for this control compared to the non-complementary control and as it was the absolute intensity values used to calculate the peak heights, negligible SERS intensity could be observed (Fig. 2f). To summarise, when synthetic pathogen DNA was omitted or a non-complementary sequence was present in the assay, no SERS signal was obtained, therefore demonstrating the excel-lent robustness and strength of this assay for diagnostic purposes in clinical use.
Once it was ascertained that a signicant enhancement was observed in the presence of each of the chosen pathogens, a dilution series was carried out to determine the lowest concen-tration of synthetic pathogen DNA that could be detected using the assay. An initial concentration range of 6108M to 1
109 M of synthetic pathogen DNA was used throughout the
SERS assay and for each study the limits of detection were determined using the equation of the line obtained from the dilution studies and calculating the limit of detection to be 3 times the standard deviation of the blank, divided by the gradient of the straight line (Fig. 3). The data were normalised
using the intensity of the standard. This SERS assay has previ-ously been used successfully for the detection ofChlamydia tra-chomatis with a reported detection limit of 77 pM.57 The
calculated limits of detection for the synthetic DNA of each of the three pathogens,N. meningitidis,S. pneumoniaeandH. in
uen-zae, were 45.3 pM, 99.5 pM and 21.7 pM respectively. The
detection limits obtained from this work are within the range of the limit obtained from previous work, which illustrates the robustness of this assay in that it can be applied to various classes of diseases and yield similar and successful results. Furthermore, with low detection limits in the pico-molar range it is a highly desirable detection method in clinical diagnostics where concentrations of disease DNA under analysis are very low and currently very difficult to measure using uorescence. Indeed we have reported several times signicantly lower detec-tion limits of SERS compared touorescence of the same dye.3
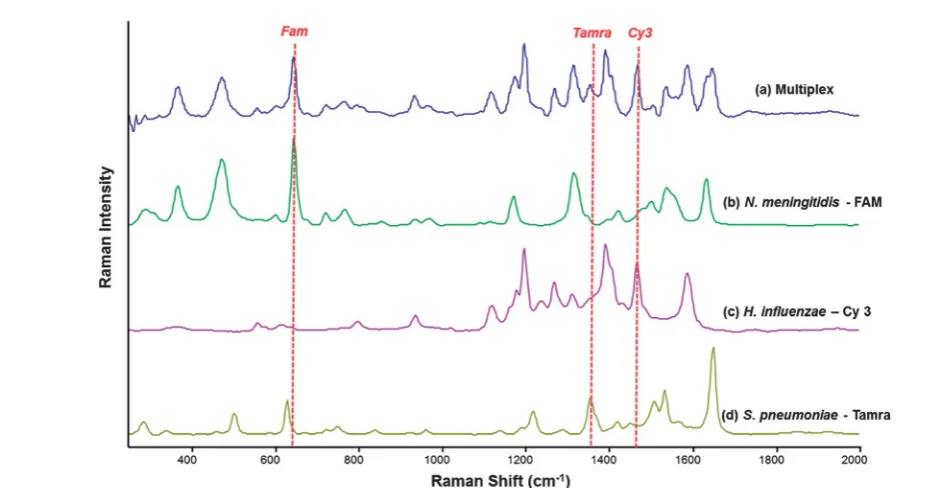
The SERS spectra of FAM and TAMRA are similar which is due to similarities in their chemical structures. By contrast, Cy3 has a markedly different SERS spectrum due to the difference in chemical structure compared to the other two dyes. FAM and TAMRA are xanthene based dyes compared to Cy3, which is an indole based cyanine. Despite the similarity in the SERS spectra of FAM and TAMRA, they can be used successfully in a multiplex system along with Cy3. Multiplex studies were carried out using both synthetic target pathogen DNA and PCR product, gener-ated from the amplication of template sequences of each pathogen. Exact complement of synthetic DNA of each path-ogen was used as initial proof-of-concept that the multiplexed SERS detection assay will work for these specic bacterial meningitis pathogens, this proved to be successful. Therefore,
Fig. 4 Stacked SERS spectra showing the spectra obtained from the simultaneous detection of all three bacterial meningitis pathogens using the detection assay (a) and the SERS spectra obtained from the detection of each pathogen separately; N. meningitidisusing PCR product concentration of 1.13105copies permL (b),H. influenzaeusing PCR product concentration of 7.24105copies permL (c) andS. pneumoniae using PCR product concentration of 2.4104copies permL (d). SERS spectra were recorded using an excitation wavelength of 532 nm and a diode laser with a 10 s accumulation time. The red dotted lines show peaks that are unique to each SERS spectrum and hence each pathogen.
Open Access Article. Published on 20 December 2013. Downloaded on 10/02/2017 14:35:47.
This article is licensed under a
[image:8.595.50.521.425.669.2]PCR product was then used to establish that the multiplexed assay could be used to analyse clinically relevant CSF samples. For this novel assay to be biologically relevant, it must perform well using PCR product of the pathogens. The assay was used in a multiplex scenario where PCR products of each pathogen were to be detected simultaneously. In the reaction mixture there were nine DNA sequences in total; three pathogen PCR product sequences, three complementary“Capture”probes and three
complementary “Reporter” probes. Each step of the SERS
detection assay was carried out in an identical fashion for single pathogen detection. As can be seen in Fig. 4, there is at least one identiable peak of each dye associated with each of the three pathogens readily observed.
The multiplex spectra obtained are multivariate in nature, therefore it is difficult to analyse the spectra by eye alone. To overcome this, multivariate analysis in the form of principal component analysis (PCA) was performed on the multiplex SERS spectrum, as well as the three separate dye-labelled oligonucleotide SERS spectra, associated with the pathogens. PCA is an excellent approach to reduce the dimensionality of the SERS data.42The resulting principal component (PC) scores
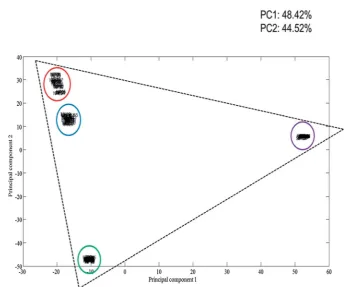
plot (Fig. 5) clearly illustrates how strong the relationship was between the multiplex spectra and the pathogen spectra. As can be seen in Fig. 5, the dye-labelled oligonucleotide SERS spectra form the edges of a triangle. Five scans of the 5 replicate samples are shown in the PCA plot and each group is tightly clustered illustrating the excellent reproducibility of the SERS spectra. The SERS spectra from the multiplex sample are also
clustered tightly together and are clearly separated and found towards the middle of all three dye-labelled oligonucleotide clusters. It is noteworthy that the multiplex cluster which contains a 1 : 1 : 1 mixture of all three probes is positioned close to theN. meningitidiscluster, which suggests that it has stronger FAM signal compared to the other two dye-labelled oligonu-cleotides. This means that more powerful supervised learning method will be needed to effect accurate quantication of the three probes and hence the three bacteria in tertiary mixtures. The crucial aspect of this work was that, based on the knowledge that all three pathogens are present in the multiplex, we wanted to determine the amount of each pathogen present within tertiary mixtures. This was performed by quantifying the three dye-labelled oligonucleotides present which will be expected to be proportional to the amount of target pathogen present in the assay. In order to quantify the dye-labelled oligonucleotides in the multiplex, fractional factorial design was used to determine the lowest number of experiments that test an equal combination of low, median and high levels for all 3 factors (dye-labelled oligonucleotides). This was calculated to be 66 different dye ratios. These were analysed by SERS. For ease of visualisation each set of replicates were averaged to provide 66 SERS spectra prior to PCA. This resulted in the generation of a single PCA scores plot that shows the quantitative relationship of each of the dye-labelled oligonucelotides within the 66 tertiary mixes. In Fig. 6a–c three PCA plots are produced which have identical PC scores locations. The size of the dot is
proportional to the concentration of the dye-labelled
Fig. 5 PCA scores plot showing the relationship between the multiplex spectra and each of the three single pathogen spectra. 5 Scans of each of the 5 replicates were recorded using an excitation wavelength of 532 nm and a diode laser. The blue cluster contains the multiplex spectra, red cluster are theN. meningitisspectra, green cluster is theH. influenzaespectra and the purple cluster are theS. pneumoniaespectra.
Open Access Article. Published on 20 December 2013. Downloaded on 10/02/2017 14:35:47.
This article is licensed under a
[image:9.595.121.475.401.688.2]oligonucleotide present in the mixture. The triangular shapes of the score plots are a very good indication that each dye-labelled oligonucleotide present can be quantied. Using these 66 data points, PLS regression models were constructed (Fig. 6d–f). The data points were spilt into two groups: one used to build the PLS model (black) and one used to test the model (red). The three PLS models all show an expected linear relationship (that is to say they fall on the expectedy¼xline), which further indicates excellent reproducibility and more importantly that the dyes can be quantied in a multiplex.
The model was originally built using only dye-labelled oligonucleotide mixtures; that is to say the detection assay was
not performed in full. A second model was then generated that was scaled to quantify the dye-labelled oligonucleotides in the amounts that would be present in a sample post-assay. The re-scaled model was tested using“blind”samples, where the actual dye-labelled oligonucleotide concentrations were unknown to the analyst but not to the PLS model. The predicted results were compared to the actual values and a selection of these are shown in Table 2. Overall, the predicted results are in very good agreement with the actual concentrations of dyes added. A second batch of testing was performed where the samples used were all post-assay samples; this was the most important testing experiment as it mimicked a real clinical situation. Excitingly, very good agreement was also obtained for post SERS assay testing as can be seen in Table 3. The successful results obtained from the testing of the model shows that each of the three dye-labelled oligonucleotides can be quantied within the multiplex aer the detection assay has been performed and regardless of whether the other two dye-labelled oligonucleotides are present.
Error values were estimated for each dye-labelled
[image:10.595.69.521.50.270.2]Fig. 6 (a–c) PCA score plots for each dye-labelled oligonucleotide using averaged replicates of the 66 data points. (d–f) PLS regression models for each dye-labelled oligonucleotide generated using the same 66 average data points. The black dots were used to build the model and the red dots were used to test the linearity of the model. Results show that quantification of each dye is clearly possible.
Table 2 Comparison of the results obtained from the predictions using the model and the actual dye-labelled oligonucleotide concentrations present
Real dye % Predicted dye %
FAM TAMRA Cy3 FAM TAMRA Cy3
1 0 0 6.67 0 0 5.53
2 0 0 33.3 0 0 24.7
3 0 6.67 0 0 8.13 0
4 0 6.67 33.3 0 6.27 31.1
5 0 20 20 0 20 17.5
6 0 33.3 6.67 0 25.2 5.73
7 0 33.3 33. 3 0 32 30.2
8 6.67 0 0 5.33 0.2 0.07
9 6.67 0 33. 3 5.8 0 31.1
10 6.67 6.67 6.67 6.2 7.07 6.27
11 6.67 6.67 33.3 6.27 5.8 29.7
12 6.67 20 20 4.07 14.9 16.4
13 6.67 33. 3 0 6.27 25.4 0
14 6.67 33.3 20 4.93 28 18.8
15 6.67 33.3 33.3 6.13 29.9 26.7
Table 3 Predicted dye-labelled oligonucleotide percentages using post assay samples used to further test the model
Real dye % Predicted dye %
FAM TAMRA Cy3 FAM TAMRA Cy3
1 6.67 6.67 6.67 7.67 7 6.2
2 6.67 6.67 0 6.4 6.87 0.07
3 6.67 0 6.67 5.87 0 5.93
4 0 6.67 6.67 0 7.27 6.4
5 6.67 0 0 6.47 0 0
6 0 6.67 0 0.8 7.53 2.07
7 0 0 6.67 3.27 0 8.07
8 0 0 0 0.07 0.07 0
Open Access Article. Published on 20 December 2013. Downloaded on 10/02/2017 14:35:47.
This article is licensed under a
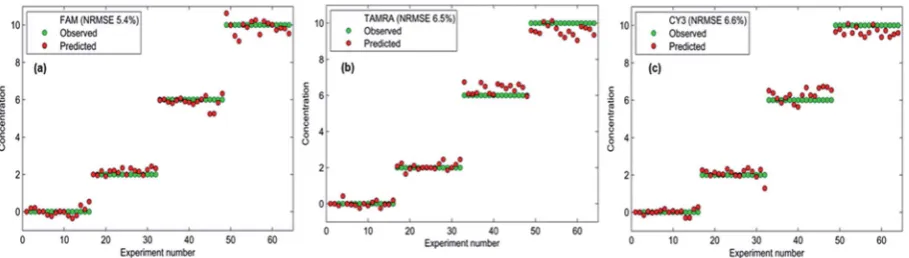
[image:10.595.56.390.535.728.2] [image:10.595.205.547.598.732.2]oligonucleotide (Fig. 7) and the overlap between the actual and predicted values is excellent and indeed reects a small error associated with the predictions obtained from the PLS model. This emphasises the accuracy and reliability of the chemometric model built to quantify the three target pathogens. Not only can the detection assay be used to detect three bacterial meningitis pathogens simultaneously, but each pathogen can be success-fully quantied in the multiplex using chemometrics.
Conclusions
A SERS assay has been successfully applied to the detection of three bacterial meningitis pathogens: Neisseria meningitidis,
Streptococcus pneumoniaeandHaemophilus inuenzae. The assay detected all three pathogens simultaneously producing consis-tent and accurate results. More importantly, using chemo-metrics, each target pathogen could be quantied, post-assay, in the multiplex, which is extremely desirable in clinical diag-nostics. This is therst time that a multiplex SERS assay has been carried out where each component (dye-labelled oligonu-cleotide) was successfully identied and quantied within the multiplex. This method of bacterial meningitis detection produces consistent results faster than conventional culture based methods. We believe this is a promising alternative to current PCR methods of detection and could be applied to the detection of a variety of bacterial, fungal and viral diseases.
Acknowledgements
KF and KG wish to thank the RSC Analytical Trust Fund and EPSRC for funding through the award of DTG funding to KG. We wish to thank the EPSRC for funding; EP/F005407/1 for KF and JAD and P/K502303/1 for KF, DG, and SM. DG thanks the Royal Society for support from a Wolfson Research Merit award.
EC is grateful to EU FP7 for the funding of COSMOS (grant
agreement no. 312941), and RG is also indebted to BBSRC for
nancial funding.
References
1 M. J. Espy, J. R. Uhl, L. M. Sloan, S. P. Buckwalter, M. F. Jones, E. A. Vetter, J. D. C. Yao, N. L. Wengenack, J. E. Rosenblatt,
F. R. Cockerill III and T. F. Smith, Clin. Microbiol. Rev., 2006,19, 165–256.
2 R. T. Ranasinghe and T. Brown,Chem. Commun., 2005, 5487– 5502.
3 K. Faulds, R. P. Barbagallo, J. T. Keer, W. E. Smith and D. Graham,Analyst, 2004,129, 567–568.
4 K. Faulds, F. McKenzie, W. E. Smith and D. Graham,Angew. Chem., Int. Ed., 2007,46, 1829–1831.
5 K. Faulds, R. Jarvis, W. E. Smith, D. Graham and R. Goodacre,Analyst, 2008,133, 1505–1512.
6 D. Graham, B. J. Mallinder, D. Whitcombe, N. D. Watson and W. E. Smith,Anal. Chem., 2002,74, 1069–1074.
7 R. J. YunWei Charles Cao and C. A. Mirkin, Science, 2002, 297, 1536–1540.
8 L. R. Allain and T. Vo-Dinh,Anal. Chim. Acta, 2002,469, 149– 154.
9 E. Papadopoulou and S. E. J. Bell, Angew. Chem., Int. Ed., 2011,50, 9058–9061.
10 D. van Lierop, K. Faulds and D. Graham,Anal. Chem., 2011, 83, 5817–5821.
11 M. M. Harper, J. A. Dougan, N. C. Shand, D. Graham and K. Faulds,Analyst, 2012,137, 2063–2068.
12 L. Kupila, T. Vuorinen, R. Vainionpaa, V. Hukkanen, R. J. Marttila and P. Kotilainen,Neurology, 2006,66, 75–80. 13 R. K. Gupta, J. Best and E. MacMahon,Br. Med. J., 2005,330,
1132–1135.
14 S. A. E. Logan and E. MacMahon,Br. Med. J., 2008,336, 36– 40.
15 Meningitis Research Foundation, http://www.meningitis. org/, 2013.
16 J. McVernon, C. L. Trotter, M. P. E. Slack and M. E. Ramsay,
Br. Med. J., 2004,329, 655–658.
17 R. J. Stokes, A. Macaskill, P. J. Lundahl, W. E. Smith, K. Faulds and D. Graham,Small, 2007,3, 1593–1601. 18 A. MacAskill, D. Crawford, D. Graham and K. Faulds,Anal.
Chem., 2009,81, 8134–8140.
19 K. K. Hering, R. M¨oller, W. Fritzsche and J. Popp,
ChemPhysChem, 2008,9, 867–872.
20 H. N. Wang and T. Vo-Dinh, Nanotechnology, 2009, 20,
065101.
21 D. I. Ellis, D. P. Cowcher, L. Ashton, S. O'Hagan and R. Goodacre,Analyst, 2013,138, 3871–3884.
Fig. 7 Error estimation plots for each dye-labelled oligonucleotide. Overlap between actual values (green) and predicted values (red) shows the closeness of the two values and therefore the normalised root-mean-square error (NRMSE) associated with the predictions.
Open Access Article. Published on 20 December 2013. Downloaded on 10/02/2017 14:35:47.
This article is licensed under a
[image:11.595.72.527.49.178.2]22 D. I. Ellis, V. L. Brewster, W. B. Dunn, J. W. Allwood, A. P. Golovanov and R. Goodacre, Chem. Soc. Rev., 2012, 41, 5706–5727.
23 M. Zhong, M. Girolami, K. Faulds and D. Graham,J. Roy. Stat. Soc. C Appl. Stat., 2011,60, 187–206.
24 K. Subramanian, W. Rutvisuttinunt, W. Scott and
R. S. Myers,Nucleic Acids Res., 2003,31, 1585–1596. 25 K. R. Thomas and B. M. Olivera,J. Biol. Chem., 1978,253,
424–429.
26 N. G. Nossal and M. F. Singer,J. Biol. Chem., 1968,243, 913– 922.
27 K. S. Sriprakash, N. Lundh, M. Mooonhuh and
C. M. Radding,J. Biol. Chem., 1975,250, 5438–5445. 28 R. Kovall and B. W. Matthews, Science, 1997, 277, 1824–
1827.
29 J. Zhang, K. A. McCabe and C. E. Bell,Proc. Natl. Acad. Sci. U. S. A., 2011,108, 11872–11877.
30 M. Citartan, T.-H. Tang, S.-C. Tan and S. C. B. Gopinath,
World J. Microbiol. Biotechnol., 2011,27, 1167–1173. 31 G. Lee, J. Yoo, B. J. Leslie and T. Ha,Nat. Chem. Biol., 2011,7,
367–374.
32 S. H. Kang, S. Lee and E. S. Yeung,Analyst, 2010,135, 1759– 1764.
33 S. Lee, S. H. Kang and E. S. Yeung,Talanta, 2011,85, 2135– 2141.
34 R. S. Conroy, A. P. Koretsky and J. Moreland,Eur. Biophys. J. Biophys. Lett., 2010,39, 337–343.
35 J. J. Li, Y. Chu, B. Yi-Hung Lee and X. S. Xie,Nucleic Acids Res., 2008,36, e36.
36 A. Barhoumi and N. J. Halas,J. Am. Chem. Soc., 2010,132, 12792–12793.
37 H. Xu, L. Wang, H. Ye, L. Yu, X. Zhu, Z. Lin, G. Wu, X. Li,
X. Liu and G. Chen, Chem. Commun., 2012, 48, 6390–
6392.
38 C. E. Corless, M. Guiver, R. Borrow, V. Edward-Jones, A. J. Fox and E. B. Kaczmarski, J. Clin. Microbiol., 2001, 39, 1553– 1558.
39 P. C. Lee and D. Meisel,J. Phys. Chem., 1982,86, 3391–3395. 40 S. Mabbott, E. Correa, D. P. Cowcher, J. W. Allwood and
R. Goodacre,Anal. Chem., 2012,85, 923–931.
41 H. F. M. Boelens, P. H. C. Eilers and T. Hankemeier,Anal. Chem., 2005,77, 7998–8007.
42 D.-H. Kim, R. M. Jarvis, Y. Xu, A. W. Oliver, J. W. Allwood,
L. Hampson, I. N. Hampson and R. Goodacre, Analyst,
2010,135, 1235–1244.
43 S. Mabbott, A. Eckmann, C. Casiraghi and R. Goodacre,
Analyst, 2013,138, 118–122.
44 H. Martens and T. Naes, Multivariate Calibration, Wiley, 1991.
45 V. Esposito Vinzi, W. W. Chin, J. Henseler and H. E. Wang,
Handbook of Partial Least Squares, Springer, 2010.
46 P. B. McIntyre, K. L. O'Brien, B. Greenwood and D. van de Beek,Lancet, 2012,380, 1703–1711.
47 G. Tzanakaki, M. Tsopanomichalou, K. Kesanopoulos,
R. Matzourani, M. Sioumala, A. Tabaki and
J. Kremastinou,Clin. Microbiol. Infect., 2005,11, 386–390. 48 X. Wang, M. J. Theodore, R. Mair, E. Trujillo-Lopez, M. du
Plessis, N. Wolter, A. L. Baughman, C. Hatcher, J. Vuong, L. Lott, A. von Gottberg, C. Sacchi, J. M. McDonald, N. E. Messonnier and L. W. Mayer,J. Clin. Microbiol., 2012, 50, 702–708.
49 H. Sadighian and M. R. Pourmand, Iran. J. Public Health, 2009,38, 60–68.
50 P. Radstrom, A. Backman, N. Qian, P. Kragsbjerg and C. Pahlson,J. Clin. Microbiol., 1994,32, 2738–2744. 51 G. M. K. Abdeldaim, K. Stralin, J. Korsgaard, J. Blomberg,
C. Welinder-Olsson and B. Herrmann, BMC Microbiol.,
2010,10, DOI: 10.1186/1471-2180-10-310.
52 R. Ghotaslou, S. Farajnia, F. Yeganeh, S. Abdoli-Oskouei, M. Ahangarzadeh Rezaee and M. Barzegar,Acta Med. Iran., 2012,50, 192–196.
53 S. M. Heard, F. Grieser, C. G. Barraclough and J. V. Sanders,
J. Colloid Interface Sci., 1983,93, 545–555.
54 C. H. Munro, W. E. Smith, M. Garner, J. Clarkson and P. C. White,Langmuir, 1995,11, 3712–3720.
55 D. Graham, W. E. Smith, A. M. T. Linacre, C. H. Munro, N. D. Watson and P. C. White,Anal. Chem., 1997,69, 4703– 4707.
56 K. Faulds, W. E. Smith and D. Graham,Anal. Chem., 2004, 76, 412–417.
57 J. A. Dougan, D. MacRae, D. Graham and K. Faulds,Chem. Commun., 2011,47, 4649–4651.
58 E. Smith and G. Dent, Modern Raman Spectroscopy: A
Practical Approach, Wiley, 2005.
Open Access Article. Published on 20 December 2013. Downloaded on 10/02/2017 14:35:47.
This article is licensed under a