International Journal of Emerging Technology and Advanced Engineering
Website: www.ijetae.com (ISSN 2250-2459, ISO 9001:2008 Certified Journal, Volume 6, Issue 4, April 2016)
34
Time Lag and Heat Load Analysis of Bhunga Construction.
Karan Judyani
1, Atharva Joshi
2, Saurabh Kapote
31
K.K.W.I.E.E.R, Parmeshwar Sadan, Opp. Holaram Colony, Sadhu Waswani Rd, Nashik, India 2K.K.W.I.E.E.R, 12/15 Smita Apartment, Date Nagar, Gangapur Road, Nashik, India
3K.K.W.I.E.E.R, Flat No 504, Thakkar Treasure, Pandit Colony, Behind Kopa Kabana Hotel, Nashik, India
Abstract— In this study, a phenomenon called time lag
(phase shift) is redefined and is used to evaluate its uses in modern day construction. A unique construction peculiar to Gujarat state of India called Bhunga is discussed. The construction details of Bhunga and the temperature readings taken from the visit to Kutch, Gujarat are used to confirm the presence of time lag phenomenon. Also comparison between a traditional Bhunga and a concrete Bhunga structure is done by calculating heat loads as per the guidelines given in ASHRAE handbook. Finally, hypothetical combinations of materials are used to show substantial reduction in heat load, if used properly in construction.
Keywords—Karan Judyani Bhunga Time Lag
I. INTRODUCTION
25%
32% 43%
co2 emissions
Industry
Transportati on
buildings
[image:1.612.352.527.220.577.2]Fig 1.1: CO2 Emission in different sectors [1]
One of the major consumers of energy in any building is air conditioning. This energy consumption in a building directly impacts the environment and produces harmful greenhouse gases further leading to effects like global warming. Thus, there is an urgent need for a balanced approach in construction and design of a building. The pie chart (fig 1.1) shows the CO2 emission from different
sectors. The CO2 contribution from transportation, building
and industry sector is 32%, 43% and 25% respectively. We can observe that buildings are largest contributor of CO2
emissions. It was therefore thought that a research on passive cooling technique called time lag should be conducted. Also, it was thought to evaluate a traditional construction type using time lag technique.
II. TIME LAG OR PHASE SHIFT
Fig 2.1 Phase shift [2]
Fig2.2 Decrement Factor [3]
[image:1.612.75.278.368.546.2]International Journal of Emerging Technology and Advanced Engineering
Website: www.ijetae.com (ISSN 2250-2459, ISO 9001:2008 Certified Journal, Volume 6, Issue 4, April 2016)
35
The variation of decrement with thickness is as shown in (fig 2.2). This effect is particularly important in the design of buildings in environments with a high diurnal range [3]. In some deserts, for example, the daytime temperature can reach well over 40 degrees. The following night, however, temperatures can fall to below freezing. If materials with a thermal lag of 10-12 hours are carefully used, then the low night-time temperatures will reach the internal surfaces around the middle of the day, cooling the inside air down. Similarly, the high daytime temperatures will reach the internal surfaces late in the evening, heating the inside up .In climates that are constantly hot or constantly cold, the thermal mass effect can actually be detrimental. This is because both surfaces will tend towards the average daily temperature which, if it is above or below the comfortable range, will result in even more occupant discomfort due to unwanted mean radiant gains or losses. Thus, if proper materials are used in proper environment for building design, significant reduction in heat load can be obtained.
III. BHUNGA HOUSE LITERATURE FROM VISIT
Bhungas are construction type found in Kutch area of Gujarat state in India. They are single cylindrical structures placed close to each other to form a house. So each Bhunga is equivalent to a room in a house. The field study of Bhunga was conducted in the village of Bhirandiyara, Kutch, Gujarat on 26th January 2015. The following construction details were observed.
A. Materials
Local wood available are Lai, Pilu, DesiBaval, Kher, Khijdo, Kerad and now GandoBaval. Khip, Shan/Shaniyo (Fibers from reeds), Ikal, Aakdo and various grasses of 15-16 types are found [4].
Materials used in Bhunga House walls are made up of mud and cow dung and the roofs’ under structure made out of bamboo and covered with small twigs tied with rope. Floor is made up of lipan (paste) for interior plaster which is made up of white clay and horse or cow dung, suitable for relief ornamentation and exterior plaster lipan is made out of clayey soil and cow dung. Wood is used for interior furniture.
B. Construction
Generally construction starts in the dry season at the end monsoon. Blocks are made out of clayey soil and rice husk and their size is 20*30*10cm. A trench is dug 30cm deep and 45cm width. The blocks for foundation are laid using a compound of local soil. Walls are built in continuity with foundation using mortar made of cow dung and local soil, mixed with water until compound is workable.
The main advantage of this type of construction is that the Bhunga walls can be finished in one day. This construction is more economical because the joints are absent in construction. Lintels, doors and window opening are inserted wherever necessary. The overhang roof of Bhunga is made out of bamboo, jute, and grass, which comes quite low and casts shadow on the walls to protect them from direct sunlight. This roof is bad conductor of heat hence temperature inside remains lower than the outside temperature. [4]
C. Climate Response
International Journal of Emerging Technology and Advanced Engineering
Website: www.ijetae.com (ISSN 2250-2459, ISO 9001:2008 Certified Journal, Volume 6, Issue 4, April 2016)
[image:3.612.51.287.158.719.2]36
Table 3.1:
Monthly variations of Temperature in Kutch, Gujarat [5]
hour Average Diurnal Temperature for Entire Year
Jan Feb Mar Apr May Jun
0000 16.9 19.5 23.1 25.7 27.8 30.0
0100 16.3 18.9 22.4 25.3 27.5 29.8
0200 15.7 18.5 21.7 24.8 27.3 29.7
0300 15.3 18.0 21.1 24.5 27.2 29.6
0400 14.8 17.6 20.7 24.1 26.8 29.5
0500 14.3 17.3 20.3 23.8 26.7 29.3
0600 14.0 16.8 27.2 23.6 27.3 29.1
0700 14.5 16.3 19.9 24.2 28.1 29.8
0800 15.7 16.6 21.4 28.3 30.1 31.0
0900 20.5 21.2 27.3 32.0 32.2 31.4
1000 25.1 25.5 31.4 34.5 33.9 33.4
1100 18.5 28.9 34.1 36.1 35.0 34.6
1200 30.8 31.1 36.1 37.3 35.8 35.2
1300 31.4 32.4 37.1 37.7 36.4 35.9
1400 32.1 33.2 37.5 37.7 36.6 35.9
1500 32.4 33.2 36.8 37.2 36.4 34.5
1600 31.8 32.7 34.8 36.6 35.8 35.1
1700 30.6 31.8 33.8 35.3 34.6 34.3
1800 28.4 30.2 32.0 33.6 33.1 33.2
1900 28.5 27.9 29.5 31.7 31.5 32.3
2000 22.1 24.7 26.8 29.6 30.1 31.3
2100 19.9 22.8 25.1 28.4 29.2 30.6
2200 18.4 21.4 24.1 27.5 28.6 30.5
2300 17.8 20.3 23.1 26.7 28.2 30.2
Jul Aug Sep Oct Nov Dec
0000 28.7 27.2 25.5 25.9 22.6 18.8
0100 28.6 27.3 25.4 24.8 21.8 18.2
0200 28.5 27.0 25.2 24.4 21.1 17.6
0300 28.4 26.9 24.8 24.0 20.2 17.1
0400 28.3 26.8 24.8 23.5 19.6 16.9
0500 28.2 27.1 24.7 23.2 19.3 16.4
0600 28.2 26.8 25.8 23.3 19.0 16.2
0700 28.3 26.9 24.8 24.4 18.8 16.0
0800 28.6 27.8 26.7 28.2 22.0 16.8
0900 29.3 28.6 28.3 32.0 27.7 21.3
1000 30.3 29.8 29.9 35.5 31.4 25.0
1100 31.3 30.7 31.2 37.4 33.9 28.2
1200 32.0 31.3 32.0 39.0 36.1 30.4
1300 32.3 31.6 32.6 40.1 37.6 31.0
1400 32.1 32.0 32.7 40.0 38.0 32.1
1500 31.7 32.0 31.4 39.2 37.5 31.9
1600 31.2 31.6 31.8 38.1 36.7 30.3
1700 31.9 30.8 31.0 36.7 35.5 28.0
1800 30.5 30.1 29.8 34.5 33.5 25.2
1900 30.0 29.0 28.1 31.5 29.8 23.0
2000 29.7 28.0 26.7 29.6 27.1 21.3
2100 29.3 27.6 26.3 28.3 25.1 20.2
2200 29.2 27.4 26.0 27.1 24.0 19.2
2300 29.1 27.2 25.7 26.2 22.9 19.2
D. Time Lag in Bhunga
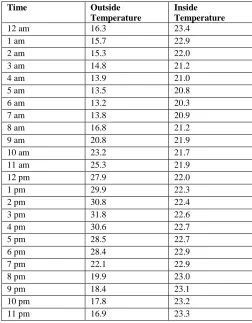
[image:3.612.90.566.370.715.2]The temperature reading on the day of the visit were taken by using instruments called data loggers placed inside and outside of Bhunga house and is shown in table 3.2 and a graphic representation of the same data is shown in fig 3.1 . Readings for 24 hours were taken and temperature varied from 13 to 31 degree Celsius. From the table 3.2 and graph (fig 3.1) we observe that maximum temperature outside is 31.8 degree Celsius at 1500hours and maximum inside temperature is 23.4 degree Celsius at midnight. Thus we get a time lag (i.e. phase shift) of 9 hours (fig3.1). Thus, because of time lag, heat induced inside the structure is delayed and the 24 hour temperature remains in comfort range, making the need of an air conditioning unit unnecessary.
Table 3.2
Temperature readings of the Bhunga house (as on 26th January 2015)
Time Outside Temperature
Inside Temperature
12 am 16.3 23.4
1 am 15.7 22.9
2 am 15.3 22.0
3 am 14.8 21.2
4 am 13.9 21.0
5 am 13.5 20.8
6 am 13.2 20.3
7 am 13.8 20.9
8 am 16.8 21.2
9 am 20.8 21.9
10 am 23.2 21.7
11 am 25.3 21.9
12 pm 27.9 22.0
1 pm 29.9 22.3
2 pm 30.8 22.4
3 pm 31.8 22.6
4 pm 30.6 22.7
5 pm 28.5 22.7
6 pm 28.4 22.9
7 pm 22.1 22.9
8 pm 19.9 23.0
9 pm 18.4 23.1
10 pm 17.8 23.2
[image:3.612.317.569.391.714.2]International Journal of Emerging Technology and Advanced Engineering
Website: www.ijetae.com (ISSN 2250-2459, ISO 9001:2008 Certified Journal, Volume 6, Issue 4, April 2016)
37 0
5 10 15 20 25 30 35
1
2
:0
0
A
M
2
:0
0
A
M
4
:0
0
A
M
6
:0
0
A
M
8
:0
0
A
M
1
0
:0
0
A
M
1
2
:0
0
P
M
2
:0
0
P
M
4
:0
0
P
M
6
:0
0
P
M
8
:0
0
P
M
1
0
:0
0
P
M
[image:4.612.58.280.132.320.2]Outside Inside
Fig 3.1 Graph showing cyclic variation in temperatures
IV. HEAT LOAD CALCULATIONS
In previous section, time lag of 9 hours was observed in Bhunga. But a prove of this can be stated by doing heat load calculations of Bhunga and then comparing it with a concrete Bhunga structure of similar size as per the steps and guidelines stated in the ASHRAE handbook using MS-Excel. (The excel sheet for all heat load calculation is same in the entire paper, only the values regarding the materials used will be changed for easy comparison and understanding the effects of different materials.) The day for heat load calculation is considered as 21st June and time as 1 pm. The temperature reading for the calculation is taken from the table 3.1
Location- Kutch, Gujarat (23°15’N 69°75’E).
No. of Persons - 4
Thermal Conductivity -
For traditional Bhunga House
Mud and Cow dung (wall) Kwall – 0.105 W/mK
Bamboo (roof) Kroof – 0.1959 W/mK
Lipen (floor) Kfloor - 0.105 W/mK
Wood (window,door) Kwin, door – 0.2652 W/Mk
For Concrete Bhunga House
Concrete Block (wall) Kwall– 1.4107 W/mK
Floor Tiles Kfloor- 0.6323 W/mK
Window glass Kwin- 0.78 W/mK
Roof Tiles Kroof– 0.84 W/mK
Day – 21st June, 1 p.m.
The procedure for heat load calculation is explained in the ASHRAE handbook [6] the results calculated from the excel sheets are as following table 4.1 and table 4.2 :-
Table 4.1:
MS-Excel sheet for traditional Bhunga house
HEAT LOAD CALCULATIONS FOR BHUNGA HOUSE
AREA OF STUDY: KUTCH, BHUJ, GUJARAT. DAY: 21st JUNE TIME: 1 p.m.
1.DESIGN CONDITIONS
f (w/m²k) DBT(°C) WBT(°C) w (kg/kg) % R.H. Outside 23 36 28 0.0196 38 Inside 7 28 21 0.01 44
f- Film Co-efficient, w- Humidity Ratio, R.H.- Relative Humidity, WBT- Wet Bulb Tempertaure
2.AREA, OVERALL HEAT TRANSFER COEFFICIENT, HEAT GAIN
WALL ROOF FLOOR WINDOW DOOR
Kwall 0.105 Kroof 0.195 Kfloor 0.105 Kwin 0.265 Kdoor 0.265 Length 5.00 Height 1.50 Diameter 5.00 Length 0.60 Length 2.00 Breadth 2.50 Radius 2.50 Thickness 1.20 Breadth 0.40 Breadth 0.70 Thickness 0.02 Thickness 0.015 Thickness 0.02 Thickness 0.04 Area(m²) 12.5 Area(m²) 42.51 Area(m²) 19.63 Area(m²) 0.24 Area(m²) 1.40 U(w/m²k) 2.65 U(w/m²k) 3.80 U(w/m²k) 0.09 U(w/m²k) 3.82 U(w/m²k) 2.96 Q(KW) 0.265 Q(KW) 1.29 Q(KW) 0.014 Q(KW) 0.007 Q(KW) 0.03 Q- Heat Gain, U-Overall Heat Transfer Coefficient, K-Thermal conductivity
3.HEAT GAIN DUE TO INFILTRATION
Wind Velocity (kmph) 5 cmm/mt of crack 0.35 Length of crack(W) 2 TOTAL(Window) 0.7
Length of crack(D) 5.4 TOTAL(Door) 1.89 NET 2.59 Sensible Heat(KW) 0.000423 Latent Heat(KW) 0.001243
4.HEAT GAIN DUE TO SOLAR RADIATION
Latitude angle 23.25 Solar azimuth angle 85.26 Longitude angle 69.80 Wall solar azimuth angle 49.74 Declination angle 23.45 Angle of Incidence 88.00 Local solar time 13.81 A 1082
Hour angle 27.15 B 0.210
Altitude angle 65.11 C 0.135 Effective Temperature 18.55 Direct Radiation 820.8021 Heat gain(Window) 0.176536 Diffuse Radiation 110.8083 Heat gain (Wall) 0.615361 Total Radiation 931.0959
5.INTERNAL HEAT GAIN
No of person 4 SHL/Person 50 LHL/Person 40 S.H.L. 0.2 L.H.L. 0.16 Appliances 0.025
6.OUTSIDE AIR HEAT
OASH 0.06528 OALH 0.192 cmm 0.4
7.TOTAL HEAT GAIN (KW) 3.047308
[image:4.612.323.563.149.701.2]International Journal of Emerging Technology and Advanced Engineering
Website: www.ijetae.com (ISSN 2250-2459, ISO 9001:2008 Certified Journal, Volume 6, Issue 4, April 2016)
[image:5.612.46.306.151.682.2]38
Table 4.2
MS-Excel Sheet for Concrete Bhunga House
HEAT LOAD CALCULATIONS FOR CONCRETE BHUNGA HOUSE
AREA OF STUDY: KUTCH, BHUJ, GUJARAT. DAY: 21st JUNE TIME: 1 p.m.
1.DESIGN CONDITIONS
f (w/m²k) DBT(°C) WBT(°C) w (kg/kg) % R.H. Outside 23 36 28 0.0196 38
Inside 7 28 21 0.01 44
f- Film Co-efficient, w- Humidity Ratio, R.H.- Relative Humidity, WBT- Wet Bulb Tempertaure
2.AREA, OVERALL HEAT TRANSFER COEFFICIENT, HEAT GAIN
WALL ROOF FLOOR WINDOW DOOR
Kwall 1.4107 Kroof 0.84 Kfloor 0.6323 Kwin 0.78 Kdoor 0.6882 Length 5.00 Height 1.50 Diameter 5.00 Length 0.60 Length 2.00 Breadth 2.50 Radius 2.50 Thickness 1.20 Breadth 0.40 Breadth 0.70 Thickness 0.02 Thickness 0.015 Thickness 0.02 Thickness 0.04 Area(m²) 12.5 Area(m²) 42.51 Area(m²) 19.63 Area(m²) 0.24 Area(m²) 1.40 U(w/m²k) 4.99 U(w/m²k) 4.90 U(w/m²k) 0.52 U(w/m²k) 4.64 U(w/m²k) 4.09 Q(KW) 0.499 Q(KW) 1.67 Q(KW) 0.081 Q(KW) 0.009 Q(KW) 0.05 Q- Heat Gain, U-Overall Heat Transfer Coefficient, K-Thermal conductivity
3.HEAT GAIN DUE TO INFILTRATION
Wind Velocity (kmph) 5 cmm/mt of crack 0.35 Length of crack(W) 2 TOTAL(Window) 0.7
Length of crack(D) 5.4 TOTAL(Door) 1.89 NET 2.59 Sensible Heat(KW) 0.000423 Latent Heat(KW) 0.001243
4.HEAT GAIN DUE TO SOLAR RADIATION
Latitude angle 23.25 Solar azimuth angle 85.26 Longitude angle 69.80 Wall solar azimuth angle 49.74 Declination angle 23.45 Angle of Incidence 88.00
Local solar time 13.81 A 1082
Hour angle 27.15 B 0.210
Altitude angle 65.11 C 0.135
Effective Temperature 18.55 Direct Radiation 820.8021 Heat gain(Window) 0.176536 Diffuse Radiation 110.8083 Heat gain (Wall) 1.15641 Total Radiation 931.0959
5.INTERNAL HEAT GAIN
No of person 4 SHL/Person 50 LHL/Person 40 S.H.L. 0.2 L.H.L. 0.16 Appliances 0.25
6.OUTSIDE AIR HEAT
OASH 0.06528 OALH 0.192 cmm 0.4
7.TOTAL HEAT GAIN (KW) 4.501761
8.CAPACITY (TR) 1.281093
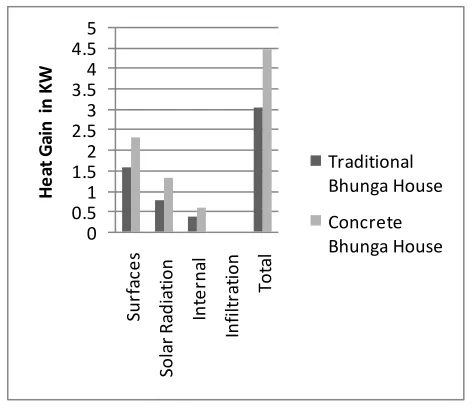
The first heat load sheet (table 4.1) is for traditional Bhunga house and second heat load sheet (table 4.2) is for concrete Bhunga house. The graph (fig 4.1) shows the comparison of heat gain for traditional and concrete Bhunga houses. By changing the construction materials we see a major increase in heat load gain for concrete house. The cooling capacity for traditional Bhunga is 0.867 TR and that of concrete Bhunga house is 1.281 TR. We can see that the required cooling capacity is increased by about 47% for concrete Bhunga house, which shows that traditional Bhunga houses requires less cooling capacity due to materials used in it.
0 0.5 1 1.52 2.53 3.5 4 4.5 5
Su
rfa
ce
s
So
la
r
R
ad
ia
tio
n
In
te
rn
al
In
fi
lt
ra
tio
n
To
ta
l
H
e
at
G
ai
n
in K
W
Traditional Bhunga House
Concrete Bhunga House
Fig 4.1 Comparison of Concrete and Traditional Bhunga
A. Results From Common Construction Materials
[image:5.612.326.562.279.485.2]International Journal of Emerging Technology and Advanced Engineering
Website: www.ijetae.com (ISSN 2250-2459, ISO 9001:2008 Certified Journal, Volume 6, Issue 4, April 2016)
[image:6.612.43.296.160.508.2]39
Table 4.3
Results through combination of materials [7]
Wall/Insulation Materials
Roof Materials
Floor Materials
Capacity (TR)
Aerated concrete + rigid polyurethane
Mangalore
roof +
shingles
Porcelain tile 0.66
Fire brick + ceramic fibre blanket
Clay tiles + shingles
Vitrified tiles 0.74
Fire brick + ceramic fibre blanket
Clay tiles + shingles
Engineered wood floor
0.69
Aerated
concrete +
extruded polystyrene fibre
Clay tiles + single ply thermoset layer
Ceramic blue tile
0.58
Aerated concrete + glass wool
Mangalore tiles + single ply
thermoset layer
Engineered wood floor
0.54
Poretherum bricks + green rockwool
Mangalore tiles
Engineered wood floor
0.92
Foam cement
block +
polyurethane foam
Clay tiles + single ply thermoset layer
Engineered wood floor
0.52
Poretherum bricks + rigid polyurethane
Mangalore tiles + single ply
thermoset layer
Vitrified tiles 0.57
From the above table 4.3 we observe that by using proper construction materials carefully we can bring down load in a building to approximately 0.5 TR as compared to 1.3 TR load obtained from using conventional materials like concrete and bricks.
V. RESULTS AND CONCLUSIONS
Thus, the time lag phenomenon and how it affects the building heat load was studied. A traditional structure called Bhunga found In Gujarat state of India was visited. Necessary readings were taken to prove the presence of time lag of 9 hours and also to calculate the heat load. Heat load of traditional Bhunga structure and a concrete Bhunga was calculated. A significant difference was noticed between the two loads, traditional Bhunga being less. As Traditional Bhunga uses no modern day cooling equipments like air conditioning, it can safely be concluded that the reduction in heat load was due to materials used in
traditional Bhunga. Finally, using some random
combinations of material in excel sheet we were able show theoretical reduction in the heat load. Thus, from this study on time lag and Bhunga houses we conclude that if proper materials are used in building construction, building heat load can significantly be reduced without using energy resources and harming the environment.
REFERENCES
[1] website:- www.pewcentreonglobalclimatechange.com, accessed on 1st March 2015
[2] website:-
http://www.new-learn.info/packages/clear/thermal/buildings/building_fabric/propertie s/time_lag.html , accessed on 22nd March 2015
[3] website:-
http://www.new-learn.info/packages/clear/thermal/buildings/building_fabric/propertie s/time_lag.html , accessed on 22nd March 2015
[4] website:-www.aina.wikidot.com/documentation:traditional-circular-house-form-bhunga-in-kutc, accesses on 2nd March 2015
[5] Girija Sharan, T. Madhavan, 2004, Fourier Representation of Climatic Data of Kothara-Kutch.
[6] ASHRAE handbook
![Fig 2.1 Phase shift [2]](https://thumb-us.123doks.com/thumbv2/123dok_us/8692411.877476/1.612.352.527.220.577/fig-phase-shift.webp)
![Table 4.3 Results through combination of materials [7]](https://thumb-us.123doks.com/thumbv2/123dok_us/8692411.877476/6.612.43.296.160.508/table-results-combination-materials.webp)
