International Journal of Emerging Technology and Advanced Engineering
Website: www.ijetae.com (ISSN 2250-2459,ISO 9001:2008 Certified Journal, Volume 4, Issue 10, October 2014)
465
Cell-Filled Concrete Roads an Alternative to Rural Roads –
A Case Study in Karnataka
Hariprasad. M
1, H. S. Prakash Kumar
2, Purushothama Das Heggade
3, Dr. B. V. Kiran Kumar
41
Post Graduate Student, 2Ph.D Research Scholar, 3M.Sc.(Engg.) Research Scholar, 4Assistant Professor, Department of Civil Engineering, Government Sri Krishnarajendra Silver Jubilee Technological Institute, K.R. Circle, Bengaluru-560 001, India
Abstract—The main role of the present work is to conduct pavement performance evaluation of Cell Filled Concrete road constructed in Sidlaghatta taluk of Chickaballapura District in Karnataka. The study area selected is from Anur Hunasenahalli to T-07 (2.16 km) in Sidlaghatta Taluk. The above selected road is categorized under Village Roads (VR) and is constructed under the Technology Demonstration Project of PMGSY phase IX. The objective of the work was to conduct Pavement Performance Studies on the said road which include the Structural and Functional evaluations. Detailed surveys were carried out on the above said stretch. For Functional evaluation, roughness was measured using MERLIN and Pavement condition survey by longitudinal /transverse cracking, severity of potholes and area of patching has been measured. In the traffic surveys different types of vehicles including commercial vehicles have been recorded for 72 hours (24 hours X 3 days). In the axle load surveys, type of vehicle, number of axles and load on each axle has been recorded to determine the Vehicle damage factor (VDF). In the non-destructive structural evaluation, Deflection studies using Benkelman Beam Deflectometer (BBD) was done. The BBD test was conducted to know the rebound deflection of cell-filled pavement layer of thickness between 40 to 100 mm. The evaluation has been carried out in three cycles at an interval of four months.
The structural evaluation results observed on this road based on BBD test, in which characteristic deflections are under the prescribed limits as per the IRC provisions and results based on VDF and MSA is also within the limits, since a very low traffic is plying on this road. The functional evaluation results observed as per MERLIN test, the IRI values are close to 3.0 m/km which is of less impact to riding quality. And as per the pavement condition survey, the pavement looked good except a little distresses found with few percentages of cracking (cells exposed), patching, potholes and roughness. Evaluation of distresses has been done considering pavement condition index (PCI) and found to be satisfactory as per PCI rating.
Keywords — Structural evaluation, Functional evaluation, BBD, Vehicle Damage Factor, MERLIN, Roughness, PCI.
I. INTRODUCTION
Providing good road network is very essential for the development of any country. In India, there are about more than 6 lakhs villages located in different terrain conditions, e.g. plains, hilly and mountainous region, deserts, swamps, coastal region, backwater area, tribal pockets, etc. The climatic conditions also vary from place-to-place to a great extent. Social, economic and educational development of these villages greatly depends on accessibility. A large number of villages in the rural India are still not connected with the all-weather roads. The employment opportunities and basic necessities, like health, education cannot reach rural masses without a system of good network. It has now been realized that for the development of rural areas, development of proper and communication system must be a priority.
International Journal of Emerging Technology and Advanced Engineering
Website: www.ijetae.com (ISSN 2250-2459,ISO 9001:2008 Certified Journal, Volume 4, Issue 10, October 2014)
466
Moreover, there are plenty of appropriate technologies for rural road construction and maintenance using locally available materials as well as local agricultural implements.
II. OBJECTIVES OF THE STUDY
Evaluation of Functional and Structural parameters for the selected stretches of Village Roads.
Identifying the merits of new technology over the conventional technology.
To quantify the structural and functional parameters to be used for the further study on deterioration modeling in terms of Pavement Condition Index (PCI).
This Pavement Performance is taken up to study the behavior of conventional concrete, flexible pavement, cell filled concrete of 100mm thick with different categories for the same traffic and to find out the economical construction of rural road for the economical and social development of the rural population.
III. SELECTION OF STUDY AREA
In this case study, the rural road was selected in Sidlaghatta Taluk of Chikkaballapur District, Karnataka state, which was constructed under the technology demonstration project of PMGSY phase IX. The details of the test sections of Anur Hunasenahalli to T-07 (2.16 km) of Sidlaghatta Taluk are shown in Table 1.
IV. LITERATURE SURVEY
Visser, A.T (1999) conducted a study on flexible Portland cement concrete pavement for low volume roads. In South Africa Portland cement concrete filled geo-cells, termed Hyson-Cells, have been used successfully in the provision of low volume roads and streets. The main conclusions were that there was no indication of stress sensitivity of the unbound materials, and typical stiffness values used in road pavement design could be used.
B. B. Pandey et. al (2005) conducted a study for evaluating the performance of cast in situ concrete block pavements for low volume roads.
Concrete is filled up into a formwork of cells 150 mm_150 mm_100 mm made up of thin plastic sheets and compacted to form flexible interlocked concrete blocks. It was found that the blocks became interlocked and that the block pavement displayed a very little amount of rutting along the wheel path.
B. B. Pandey et. al (2011) conducted a study of an investigation on cell filled pavements. They carried out studies for investigating the structural behavior of different types of cell-filled pavements. The main objective of this study was to investigate the behavior of pavements constructed by filling the cells with (a) cement concrete (b) soil cement and (c) sand cement laid over two different types of sub-bases (moorum and soil cement). A comparison of costs of different types of cell-filled pavements with those of traditional flexible and rigid pavements designed for low traffic volumes indicates that cell-filled pavements are cost-effective compared with conventional pavements, particularly in locations with scarcity of aggregates.
Y. A. Singh et. al (2011) conducted an experimental study on ―Structural Performance of Plastic Cell-filled Concrete Block Pavement (PCCBP) for Low Volume Roads‖. Experimental investigations into the structural behaviors of different thicknesses of plastic cell-filled concrete block pavement (PCCBP) over 100-mm thick water bound macadam sub-base course were presented. In this study, an attempt has been made to use waste stone dust in place of the traditional river sand as fine aggregates in concrete.
International Journal of Emerging Technology and Advanced Engineering
Website: www.ijetae.com (ISSN 2250-2459,ISO 9001:2008 Certified Journal, Volume 4, Issue 10, October 2014)
467
TABLE I
DETAILS OF THE STRETCHES AND CRUST DETAILS (ANUR ROAD)
Sl.No. Road Length in Km (From & To)
Sub-Total Length in km Technology Adopted Layer details Layer thickness in mm Layer width in M Overall Crust thickness (mm)
1 0.0 0.1 0.10 Conventional
Concrete GSB GSB M30 100 50 200 Full width 4.05 3.75 350
2 0.1 0.5 0.40 Cell Filled Concrete
GSB GSB M30 100 50 100 Full width 4.05 3.75 250
3 0.5 0.7 0.20 Cell Filled Concrete
GSB WBM-G3 M30 100 75 100 Full width 3.75 3.75 275
4 0.7 1.1 0.40 Cell Filled Concrete
GSB WBM-G3 M10 M30 100 75 60 40 Full width 3.75 3.75 3.75 275
5 1.1 1.2 0.10 ICBP – Interlocking Concrete Blocks GSB GSB Sand bed ICBP 100 50 30 80 Full width 4.05 3.75 3.75 260
6 1.2 1.7 0.50 Conventional
Flexible Pavement GSB WBM G-2 WBM G-3 PMC 125 75 75 20 Full width 3.90 3.75 3.75 295
7 1.7 1.825 0.125 Conventional
Concrete Pavement GSB WBM G-3 M30 100 75 200 Full width 3.75 3.75 375
8 1.825 2.16 0.34 Conventional
International Journal of Emerging Technology and Advanced Engineering
Website: www.ijetae.com (ISSN 2250-2459,ISO 9001:2008 Certified Journal, Volume 4, Issue 10, October 2014)
468
V. ENGINEERING SURVEY AND INVESTIGATIONS
A. Road Inventory Data
The data collected during road Inventory survey is summarized below.
The formation width is 7.50 m wide with a single lane carriage way of 3.75 m width and an average shoulder width of 1.875 m on each side. The type of adjoining land along the test stretch are built up and agricultural land. The road inventory data consists of general details like rainfall, temperature, binder properties and other pavement details. The data is summarized in Table 2.
TABLE II ROAD INVENTORY DATA
Name of the Road Anur Hunasenahalli to T-07
Description 0.0 km to 1.1 km 1.1 km to 2.16 km
General Details
Type of adjoining land AL+BU AL+BU
New construction or Up gradation UG
Annual avg. rainfall (mm) 768
Avg. min and max temp (∘C) 20- 32
Avg. min and max depth of GWT (m) 25-30
Month and year of opening to traffic March 2013 Binder properties
Grade of concrete/bitumen
Cell-filled Concrete M30
60/70
Penetration in (mm) 63
Softening point (℃) 53
Pavement details
Avg. Embankment ht. (m) 0.20 0.15
Carriageway width (m) 3.75 3.75
Shoulder width (m) 1.875 1.875
Type of surface Concrete BS
Condition of shoulder (Good, Fair ,Poor)
Good Good
Effectiveness of surface Drainage (Good, Fair, Poor)
Good Good
AL- Agricultural Land; BU- Built Up; UG- Up gradation; NC- New Construction;
NA-Not Applicable; BS- Bituminous Surface
VI. STRUCTURAL EVALUATION
A. Benkelman Beam Deflection Studies
The rebound deflection value obtained at each point was calculated making use of the initial, intermediate and final rebound deflection values, after applying correction where ever necessary. The average of the rebound deflection values, at every 50/100 m interval over the entire stretch given for BBD studies was calculated.
International Journal of Emerging Technology and Advanced Engineering
Website: www.ijetae.com (ISSN 2250-2459,ISO 9001:2008 Certified Journal, Volume 4, Issue 10, October 2014)
469
TABLE III
AVERAGE CHARACTERISTIC DEFLECTION VALUE
Anur Hunasenahalli to T-07
Sl. No
Chainage
Cycle 1 Cycle 2 Cycle 3
Average Characteristic Deflection (mm)
Total Average Characteristic Deflection (mm) From To
1 0.00 0.10 0.08 0.16 0.25 0.16
0.32
2 0.10 0.50 0.07 0.21 0.38 0.22
3 0.50 0.70 0.08 0.16 0.06 0.10
4 0.70 1.10 0.12 0.23 0.28 0.21
5 1.10 1.20 0.74 0.41 0.40 0.52
6 1.20 1.70 0.22 0.13 0.31 0.22
7 1.70 1.825 0.68 0.59 0.50 0.59
8 1.825 2.16 0.61 0.51 0.53 0.55
B. Classified Traffic Volume Counts
Classified traffic volume counts were carried out for the test stretches. A 24 hour traffic volume count was conducted on hourly basis for three days and the details were recorded.
The vehicles are classified as representative vehicles such as two wheelers, three wheelers, buses, 2 and 3 axle trucks, jeeps, cars, vans mini bus, mini trucks, tractors, bicycles, animal drawn carts (pneumatic tyred and iron tyred). The averages of all class of vehicles were multiplied with their respective PCU factor and PCU and average CVPD were calculated. The abstract of PCU, CVPD and MSA calculated are shown in Table 4.
TABLE IV
AVERAGE PCU, CVPD AND MSA
Anur Hunasenahalli to T-07
Sl. No PCU CVPD MSA Avg. MSA
1 Cycle 1 382 46 0.37
0.45
2 Cycle 2 388 60 0.49
3 Cycle 3 384 59 0.48
C. Axle Load Surveys
Axle Load Survey was conducted on the test stretches for the determination of Vehicle Damage Factor (VDF). The survey was conducted along with the traffic volume count for 24 hours X 3 days. The axle load survey was conducted in accordance with IRC: SP: 19-2001.
Only the axles with weight of 3 tonnes and above are considered to have effect on the pavement performance, hence axles with weight of 3 tonnes and above were considered in the study. The average of vehicle Equivalent Factors and their total avg. VDF are shown in the Table 5.
TABLE V
AVERAGE EQUIVALENT FACTOR / VDF
Anur Hunasenahalli to T-07
Sl. No Average Equivalent Factor (E.F) of all Vehicles Total average VDF
1 Cycle 1 0.0327
0.034
2 Cycle 2 0.0358
International Journal of Emerging Technology and Advanced Engineering
Website: www.ijetae.com (ISSN 2250-2459,ISO 9001:2008 Certified Journal, Volume 4, Issue 10, October 2014)
470
VII. FUNCTIONAL EVALUATION
A. MERLIN Roughness Survey
MERLIN Roughness survey was conducted on the stretches to estimate the roughness of the pavement surface. To determine the roughness of a section of road, 200 measurements should be made at regular intervals at a distance of 0.6 m from the edge of the road.
In this case study MERLIN measurements were made w.r.t the technologies adopted viz., the MERLIN sheets were changed as the technology changed. The recording of roughness survey is done on a typical recording chart. The abstract of the MERLIN roughness value is summarized in the Table 6. Analysis is as per TRL report (Cundill).
TABLE VI
AVERAGE MERLIN ROUGHNESS VALUES
Anur Hunasenahalli to T-07
Sl. No
Chainage
Cycle 1 Cycle 2 Cycle 3
Average IRI
value (m/km) Total Average IRI value From To
1 0.00 0.10 3.18 2.71 2.94 2.94
2.95 m/km or 2950 mm/km
2 0.10 0.50 3.18 3.53 3.30 3.34
3 0.50 0.70 3.53 2.71 2.94 3.06
4 0.70 1.10 3.30 3.30 3.18 3.26
5 1.10 1.20 2.47 2.47 2.71 2.55
6 1.20 1.70 2.59 3.06 3.30 2.98
7 1.70 1.825 3.18 2.59 2.71 2.83
8 1.825 2.16 2.59 2.59 2.83 2.67
B. Pavement Condition Survey
Pavement condition index (PCI) is a numerical indicator of present condition that is directly to the pavement surface operational condition. The PCI is a function of the type of distress. The pavement may also become inadequate due to general deterioration with age.
Considering the serviceability criteria as per ASTM D6433-11 for each distress attributes the following factors was obtained. The pavement condition index values along the stretch of road is calculated using the pavement condition survey data and as tabulated in the below Table 7. The PCI rating is done as per ASTM D6433-11.
TABLE VII PCI VALUE AND RATING
Anur Hunasenahalli to T-07
Sl. No
Chainage
Pavement Condition Index Pavement Condition Rating
From To
1 0.0 1.10 94 Good
2 1.10 2.16 81 Satisfactory
VIII. GEOTECHNICAL INVESTIGATIONS
Soil investigations such as the soil classification, Atterberg limits, OMC and MDD, CBR, and natural moisture content were conducted in the laboratory in order to determine the soil properties and other engineering properties of soil.
International Journal of Emerging Technology and Advanced Engineering
Website: www.ijetae.com (ISSN 2250-2459,ISO 9001:2008 Certified Journal, Volume 4, Issue 10, October 2014)
471
TABLE VIII
GEOTECHNICAL INVESTIGATIONS ON SOIL
Sl.no
Chainage (km)
IS Soil classification
Atterberg limits (IS-2720 part 5, 1985)
Compaction parameters (IS
2720, part 8 1983)
CBR (IS-2720
part 12, 1983)
Natural Moisture content (IS-2720 part 2,
1983) Betwee
n At
LL (%)
PL (%)
PI (%)
MDD (g/cc)
OMC
(%) 56 blows (%) Anur Hunasenahalli to T-07
1
0.0 to 1.0 km
0.10 SC 32 20 12 1.875 10.5 6.25 5.0
2 1.00 SC 32 22 10 1.875 11.5 6.00 5.0
3 1.0 to
2.16 km 1.35 SC 31 22 11 1.91 10.0 7.50 5.0
4 2.10 SC 28 20 8 1.88 11.5 7.80 5.0
Note: SC- Silty Sand with Gravel Clay:
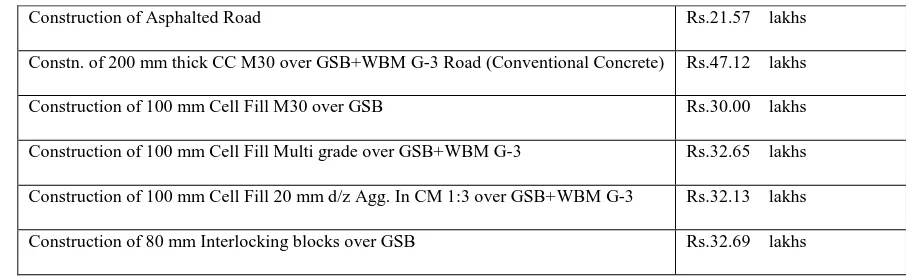
[image:7.612.75.539.157.343.2]IX. CONSTRUCTION COST STATEMENT:(COST PER KM)
TABLE IX
CONSTRUCTION COST STATEMENT OF DIFFERENT TECHNOLOGIES
Construction of Asphalted Road Rs.21.57 lakhs
Constn. of 200 mm thick CC M30 over GSB+WBM G-3 Road (Conventional Concrete) Rs.47.12 lakhs
Construction of 100 mm Cell Fill M30 over GSB Rs.30.00 lakhs
Construction of 100 mm Cell Fill Multi grade over GSB+WBM G-3 Rs.32.65 lakhs
Construction of 100 mm Cell Fill 20 mm d/z Agg. In CM 1:3 over GSB+WBM G-3 Rs.32.13 lakhs
Construction of 80 mm Interlocking blocks over GSB Rs.32.69 lakhs
X. RESULTS
A. Structural Evaluation
From BBD studies, the deflection results shown in table-3. The average characteristic deflection is found to be 0.32 mm. Therefore overlay is not required at present stage. As per result obtained from BBD test in Anur Hunasenahalli road, cell-filled concrete pavement showed minimum deflection than the interlocked block pavement & flexible pavement.
From the traffic data collected, cumulative standard axles were calculated for the present traffic data and values of PCU, and CVPD were obtained and the MSA was found to be 0.45 MSA. Therefore the present traffic movement has no effect on the performance of the pavement and normal traffic is plying on the stretch.
[image:7.612.75.528.414.554.2]International Journal of Emerging Technology and Advanced Engineering
Website: www.ijetae.com (ISSN 2250-2459,ISO 9001:2008 Certified Journal, Volume 4, Issue 10, October 2014)
472
B. Functional Evaluation
The MERLIN roughness value obtained from the average of three cycles in terms of International Roughness Index (IRI) is 2.95 m/km or 2950 mm/km from table-6. Therefore the IRI value obtained is below 3 and has a good riding quality or riding comfort (as per TRL report (Cundill)). The cell-fill concrete section has showed a little higher roughness value than other technologies due to its exposed cells on the pavement surface.
The results obtained from pavement distress survey, the PCI values are 94 and 81 for sub stretches of Anur Hunasenahalli road, which are as shown in table 7. And as per the ASTM D6433-11, pavement condition rating, the PCI values ranging from 86-100 are Good and requires no maintenance and the PCI values ranging from 71-85 are Satisfactory and requires less or no maintenance. The PCI value of cell-filled concrete section is 94, which is much better than other technologies.XI. CONCLUSIONS
Cell filled concrete pavement can be recommended for weak base and sub-base layers instead of flexible pavement, since it showed resistance to structural durability
.
Cell filled concrete pavements has very little effect to the riding comfort in terms of roughness.
Construction of Cell Fill Concrete Pavement is advantageous compared to Conventional Concrete and Asphalt Pavement. Since cell filled roads are economical (cost per km) to conventional concrete roads and they need very less annual maintenance (as per good PCI rate) compared to flexible roads. Conventional and cell filled Concrete roads could be a
solution for the rural roads because of the life of concrete roads. It‘s beneficial to use cell filled in low volume traffic condition.
Cell Fill Concrete roads is a challenge in the rural road construction with the effective diversion of traffic.
REFERENCES
[1] Indian Roads Congress, Guidelines for Strengthening of Flexible road pavements using Benkelman Beam Deflection Technique, IRC: 81 (First Revision) 1997
[2] Ministry of Road Transport and Highways, Specifications for Road and Bridge Works, Fourth Revision, Indian Roads Congress, New Delhi, 2001.
[3] Indian Roads Congress, Rural Roads Manual, IRC :SP: 20 (First revision) 2002
[4] Indian Roads Congress, Guidelines for Surface Evenness of Highway Pavements, IRC: SP:16 (First Revision) 2004
[5] Indian Roads Congress, Tentative Guidelines for the Design of Flexible pavements, IRC: 37-2012
[6] American Standards for Testing Materials, Standard practice for roads and Parking Lots Pavement Condition Index Survey, ASTM D 6433-11
[7] ―Low Cost Concrete Road for Villages‖ by Dr B.B. Pandey, Emeritus Professor of Civil Engineering, IIT Kharagpur. (Published in Grameen Sampark under NRRDA for PMGSY roads)
[8] T.F. Fwa, The HandBook of Highway Engineering, Taylor and Francis group, CRC press, 2006
[9] Teiborlang L. Ryntathiang, M. Mazumdar, and B. B. Pandey (2005) conducted a study for evaluating the performance of cast in situ concrete block pavements for low volume roads.
[10] M.A Cundill, The MERLIN Road Roughness Machine: User Guide, Transportation Research laboratory, TRL Report 229, 1996 [11] SaranyaUllas, T. Sreelatha& B. G Sreedevi, Pavement Distresses
and Roughness Modelling- A case study, Proceedings of ICEE-2013, International Journal of Innovative Research in Science Engineering and Technology, Vol-2, Special issue December 2013.
[12] Stephen Sunday Kolo, Yinusa Alaro Jimoh, Peter Ndoke Ndoke, Olayemi James, Andrew Yisa Adama and Alhaji Bala, Analysis of Axle Loadings on a Rural Road in Nigeria, Published in International Journal of Engineering Science Invention , Volume 3, Issue 2, February 2014.