International Journal of Emerging Technology and Advanced Engineering
Website: www.ijetae.com (ISSN 2250-2459,ISO 9001:2008 Certified Journal, Volume 3, Issue 9, September 2013)
296
A Comparative Analysis of Experimental And Simulation Based
Network To Enhance The Performance And Reliably of
Wireless Network
Rajiv MahajanPh.D Scholar Singania University Rajasthan
Abstract-- In wireless networking performance is one of the most important factor but it is very difficult to estimate the performance of the system because it require a lot of time cost and equipment specially in case of the large network, So in order to estimate the more accurate figure or data before implementation simulation results play a vital role. In this paper we compare the result of the experimental and simulation setup for packet size, throughput, packet loss and round trip delay with different communication protocol and it is find that result variation between experimental and simulators lies between 10-20%. Further we find that UDP perform well as compared to TCP which is a guidelines to setup a wireless network to improve the performance of the Academic network with slight modification of the existing parameters
I. INTRODUCTION
For significant information results, it is important that the model on which the simulator is based matches as much as possible the physical experimental design. For most researchers it is extremely expensive and impractical to build a large complex network. There are not enough resources and time available. One of the most important advantages of network simulators is scalability, which allows the simulation of a large number of networking devices without going to the expense of purchasing the real equipment. Simulation provides an economic and effective way for developing and validating new theories. Simulation results will not always be in favor of the original theory.
It is very important to validate the results in order to collect the more accurate information and it is difficult to setup the large network to perform the experiment physically so it is better to use some simulator to perform the same scale experiment before the implementation at the physical level. OPNET is the best tools to perform the experiment based upon the simulation. So in this section Opnet is used to perform the experiment and then it is compared with the physical results then it is used to scale the experiment to large extend to find the result for large networks.
II. METHODOLOGY
International Journal of Emerging Technology and Advanced Engineering
Website: www.ijetae.com (ISSN 2250-2459,ISO 9001:2008 Certified Journal, Volume 3, Issue 9, September 2013)
297
III. RESULTS ANALYSIS
3.1Packet Size
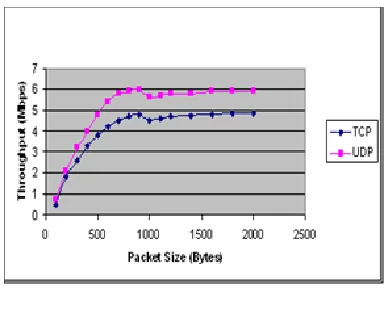
In this experiment only two nodes are involved in the communication. Node2 generates TCP traffic and sends it to node4. The same experiment is repeated while node2 sends UDP traffic. This is done to check the effect of changing the transport layer protocol on the performance of Ad-hoc networks. The packet size ranges from just 100 bytes up to 2000 bytes. Each test is repeated 30 times due to variations in obtained results. The results of this experiment are summarized in Figure 3
Figure 3 (a)
[image:2.612.361.530.158.350.2]The graphs in this figure show that the throughput first attains a maximum at around 1300 to 1500 after that it get decreased so in order to find the more accurate size of the packet. The packet size is further investigate with small interval that in the range of 1300 to 1500 bytes which corresponds to MTU of 1500 bytes, IP header of 20 bytes, and UDP header of 8 bytes. Similarly in case of physical experiments, it was notice that there is a sharp decrease in throughput once packet size reaches 1460 bytes.
Table 3.1
Average throughput variation with respect to change in packet size.
Packet
Size
UDP
Traffic
TCP
Traffic
1410 5.65 4.12
1420 5.71 4.26
1430 5.73 4.32
1440 5.82 4.51
1450 6.02 4.68
1460 6.09 4.75
1470 6.25 4.8
1480 6.1 4.52
1490 5.89 4.4
1500 5.69 4.23
Table clearly shows that around about at packet size 1470 we find the maximum figure of throughput and after that it slowly goes down that mean it the optimize value where both TCP and UDP traffic having the maximum value so it can be used for the investigation in future.
IV. PERFORMANCE MEASUREMENT
4.1 Packet Loss Rate
[image:2.612.71.266.273.428.2]International Journal of Emerging Technology and Advanced Engineering
Website: www.ijetae.com (ISSN 2250-2459,ISO 9001:2008 Certified Journal, Volume 3, Issue 9, September 2013)
298
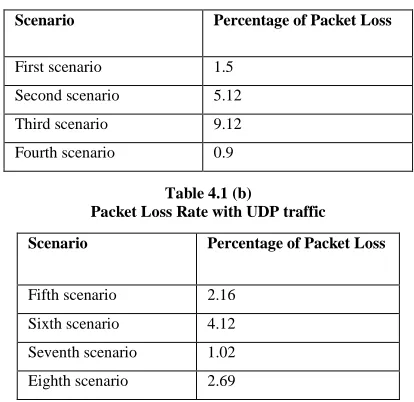
Table shows clearly that the more nodes communicating with a single node the higher the packet loss. node2, node3, and node5. This can be explained by noting that a bottleneck situation at the receiving node is formed. When the number of simultaneous nodes trying to communicate with the same destination node increases, the transmission delay at the wireless interface increases. Consequently, packets may experience increasing queuing delays, forming a bottleneck situation at the wireless interface.
Table 4.1 (a) packet loss rate with TCP traffic
Scenario Percentage of Packet Loss
First scenario 1.5
Second scenario 5.12
Third scenario 9.12
Fourth scenario 0.9
Table 4.1 (b)
Packet Loss Rate with UDP traffic
Scenario Percentage of Packet Loss
Fifth scenario 2.16
Sixth scenario 4.12
Seventh scenario 1.02
Eighth scenario 2.69
4.2Throughput
In this section, only the throughput of the sending node is collected so it can be compared with the physical experimental results. We find almost the same result as that of the physical experiment the table shown below the summery of average throughput during the simulation.
Table 4.2 (a)
Average throughput with TCP traffic
Scenario Average Throughput
First scenario
5.8424 Second scenario 3.4335
Third scenario
2.0274 Fourth scenario
1.1118
Table 4.2 (b)
Average throughput with UDP traffic
Scenario Average Throughput
Fifth scenario 7.6035
Sixth scenario 5.0505 Seventh scenario 4.0959
Eighth scenario 3.2856
The throughput usually decreases with the hop count for three reasons:
• Stations in communication range need to share the common channel.
• Stations in interference range may transmit at the same time resulting in a collision and requiring a retransmission.
• The transmission delay increases with the hop count. It is also clear from these values that the throughput decreases with the number of nodes trying to communicate simultaneously with node4. This can be justified by noting that the cause may again be related to the formation of a bottleneck situation at node4.
It is also noticeable from this table that, as expected, the throughput values, when nodes are communicating using UDP traffic, are higher compared to when nodes send TCP traffic. This can be explained by noting that UDP does not require acknowledgments that compete for transmission time over the shared channel.
4.3 Round Trip Delay
As discussed before, the round trip delay indicates how long it takes to send a packet of data from its source to destination and back. It is usually described in seconds or milliseconds. Simulation base results are as shown below in table
Table 4.3 (a)
Average Round trip Delay in ms with TCP Traffic
Scenario Round Trip Delay
(ms)
[image:3.612.64.271.264.465.2] [image:3.612.77.261.570.653.2]International Journal of Emerging Technology and Advanced Engineering
Website: www.ijetae.com (ISSN 2250-2459,ISO 9001:2008 Certified Journal, Volume 3, Issue 9, September 2013)
299
Table 4.3 (b)
Average Round trip Delay in ms with UDP Traffic
Scenario Round Trip Delay
(ms)
Fifth scenario 1.09 Sixth scenario 2.01 Seventh scenario 2.69 Eighth scenario 4.02
It is clear from the values in this table that the round trip delay increases as a function of the nodes that communicate concurrently with the same node. This can be described by noting that when more nodes communicate with node4, there is a relatively larger queue forming at node4’s interface. Therefore, an average packet experiences a higher amount of queuing delay until it is actually transmitted by the interface.
As expected, it is also apparent from the values in Table 4-3 that the round trip delay, when nodes send UDP traffic, is lower compared to when they send TCP traffic. This is due to the flow and congestion control of TCP that scarifies the transmission time to achieve more reliable data transport.
V. COMPARISON OF EXPERIMENTAL AND SIMULATION RESULTS
Validation is an essential process to check the accuracy of the simulation outcome. This can be achieved by comparing the results collected from the physical experiments with those collected from the simulation.
5.1 Throughput Comparison
TCP Based Traffic Throughput Comparison
Scenario Physical Average
Throughput
Simulated Average Throughput
First scenario 5.36 5.8424 Second scenario 3.15 3.4335
Third scenario 1.86 2.0274
Fourth scenario 1.02 1.1118
1. UDP Based Traffic Throughput Comparison
Scenario Physical Average
Throughput
Average Throughput
Fifth scenario 6.85 7.6035 Sixth scenario 4.55 5.0505
Seventh scenario
3.69
4.0959 Eighth
scenario
2.96 3.2856
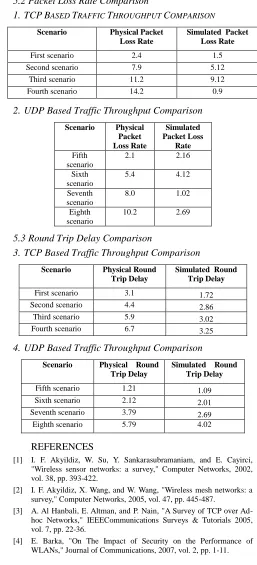
5.2 Packet Loss Rate Comparison
1.TCPBASED TRAFFIC THROUGHPUT COMPARISON
Scenario Physical Packet
Loss Rate
Simulated Packet Loss Rate
First scenario 2.4 1.5
Second scenario 7.9 5.12
Third scenario 11.2 9.12
Fourth scenario 14.2 0.9
2.UDP Based Traffic Throughput Comparison
Scenario Physical
Packet Loss Rate
Simulated Packet Loss
Rate Fifth
scenario
2.1 2.16
Sixth scenario
5.4 4.12
Seventh scenario
8.0 1.02
Eighth scenario
10.2 2.69
5.3 Round Trip Delay Comparison
3.TCP Based Traffic Throughput Comparison
Scenario Physical Round
Trip Delay
Simulated Round Trip Delay
First scenario 3.1 1.72 Second scenario 4.4 2.86 Third scenario 5.9 3.02 Fourth scenario 6.7 3.25
4.UDP Based Traffic Throughput Comparison
Scenario Physical Round
Trip Delay
Simulated Round Trip Delay
Fifth scenario 1.21 1.09 Sixth scenario 2.12 2.01 Seventh scenario 3.79 2.69 Eighth scenario 5.79 4.02
REFERENCES
[1] I. F. Akyildiz, W. Su, Y. Sankarasubramaniam, and E. Cayirci, "Wireless sensor networks: a survey," Computer Networks, 2002, vol. 38, pp. 393-422.
[2] I. F. Akyildiz, X. Wang, and W. Wang, "Wireless mesh networks: a survey," Computer Networks, 2005, vol. 47, pp. 445-487.
[3] A. Al Hanbali, E. Altman, and P. Nain, "A Survey of TCP over Ad-hoc Networks," IEEECommunications Surveys & Tutorials 2005, vol. 7, pp. 22-36.
[image:4.612.311.568.140.705.2]International Journal of Emerging Technology and Advanced Engineering
Website: www.ijetae.com (ISSN 2250-2459,ISO 9001:2008 Certified Journal, Volume 3, Issue 9, September 2013)
300
[5] P. Barron, J. Dowling, and S. Weber, "WinAODV," University of Dublin,
[6] N. Ben Salem, L. Buttyan, J. P. Hubaux, and M. Jakobsson, "Node Cooperation in Hybrid Ad-hoc Networks," IEEE Transactions on Mobile Computing 2006, vol. 5, pp. 365-376.
[7] T. Bheemarjuna Reddy, I. Karthigeyan, B. S. Manoj, and C. Siva Ram Murthy, "Quality of Service Provisioning in Ad-hoc Wireless Networks: a Survey of Issues and Solutions," Ad-hoc Networks, 2006, vol. 4, pp. 83-124.
[8] B. Bing, "Measured performance of the IEEE 802.11 wireless LAN," In Proc. Of the Local Computer Networks (LCN '99), 1999, pp. 34-42.
[9] S. Chakrabarti and A. Mishra, "QoS issues in Ad-hoc wireless networks," Communications Magazine, IEEE, 2001, vol. 39, pp. 142-148.
[10] C. Cheng, R. Riley, S. P. R. Kumar, and J. J. Garcia-Luna-Aceves, "A loop-free extended Bellman-Ford routing protocol without bouncing effect," In Proc. of the Symposium on Communications architectures & protocols (SIGCOMM '89), 1989, pp. 224-236. [11] I. Chlamtac, M. Conti, and J. J.-N. Liu, "Mobile Ad-hoc networking:
imperatives and challenges," Ad-hoc Networks, 2003, vol. 1, pp. 13-64.
[12] S. Ci and H. Sharif, "A link adaptation scheme for improving throughput in the IEEE 802.11 wireless LAN," In Proc. of the 27th Annual IEEE Conf. on Local Computer Networks (LCN 2002). 2002, pp. 205-208.
[13] M. S. Corson and J. Macker, Mobile Ad-hoc Networking (MANET):Routing protocol Performance Issues and Evaluation Considerations, Request For Comments 2501, Internet Engineering Task Force (IETF), 1999.
[14] D. De Couto, D. Aguayo, J. Bicket, and R. Morris, "A High Throughput Path Metric for Multi-hop Wireless Routing," In Proc. of the 9th ACM Int. Conf. Mobile Computing and Networking, 2003, pp. 134-146.
[15] H. Deng, W. Li, and D. P. Agrawal, "Routing security in wireless Ad-hoc networks," Communications Magazine, IEEE, 2002, vol. 40, pp. 70-75.
[16] T. Fowler, "Mesh Networks for Broadband Access," IEE Review, 2001, vol. 47, pp. 17-22.
[17] J. Freebersyser and B. Leiner, "A DoD perspective on mobile Ad-hoc networks," Addison-Wesley Longman Publishing Co., Inc, 2001, pp. 29-51.
[18] S. Garg and M. Kappes, "An experimental study of throughput for UDP and VoIP traffic in IEEE 802.11b networks," In Proc. of the IEEE Wireless Communications and Networking, WCNC, 2003, pp. 1748-1753.
[19] S. R. Gatta, J.-P. Duplessis, S. Guven, and S. Manchester, "Simplified Creation and Termination of an Ad-hoc Wireless Network with Internet Connection Sharing," in United States: Microsoft Corporation, 2006.
[20] J. Gomez, A. T. Campbell, M. Naghshineh, and C. Bisdikian, "Conserving transmission power in wireless Ad-hoc networks," In Proc. of the 9th Int. Conf. on Network Protocols, 2001, pp. 24-34. [21] V. Gupta, S. Krishnamurthy, and M. Faloutsos, "Denial of Service
Attacks at the MAC Layer in Wireless Ad Hoc Networks," MILCOM, 2002, pp. 1118-1123.
[22] Z. J. Haas and M. R. Pearlman, The Zone Routing Protocol (ZRP) for Ad-hoc Networks, Internet Engineering Task Force (IETF) Draft, 1997.
[23] G. C. Hadjichristofi, W. J. Adams, and N. J. Davis IV, "A framework for key management in mobile Ad-hoc networks," In Proc. of the Int. Conf. on Information Technology: Coding and Computing, (ITCC 2005), 2005, pp. 568-573.
[24] S. A. Jafar, "Too Much Mobility Limits the Capacity of Wireless Ad-hoc Networks," IEEE Transactions on Information Theory 2005, vol. 51, pp. 3954- 3964.
[25] H. Ju-Lan and I. Rubin, "Performance Analysis of Directional CSMA/CA MAC Protocol in Mobile Ad-hoc Networks," In Proc. of the IEEE Int. Conf. on Communications (ICC '06), 2006, pp. 3657-3662.
[26] J. Korhonen and Y. Wang, "Effect of Packet Size on Loss Rate and Delay in Wireless Links," In Proc. of the IEEE Wireless Communications and Networking Conference, 2005, pp. 1608-1613. [27] J. Lee, G. Kim, and S. Park, "Optimum UDP packet sizes in Ad-hoc
networks," In Proc. of the Workshop Merging Optical and IP Technologies on High Performance Switching and Routing, 2002, pp. 214-218.
[28] N. Meghanathan, "A Simulation Study on the Stability-oriented Routing Protocols for Mobile Ad-hoc Networks," In Proc. of the Int. Conf. on Wireless and Optical Communications Networks, 2006, pp. 1-5.