m a c hi n e l e a r n i n g fo r s af e t y a t
r a il w a y s t a ti o n s
Ala w a d , H , K a e w u n r u e n , S a n d An, M
h t t p :// dx. d oi.o r g / 1 0 . 1 1 0 9 /ACC E S S. 2 0 1 9 . 2 9 6 2 0 7 2
T i t l e
L e a r n i n g f r o m a c ci d e n t s : m a c h i n e l e a r n i n g fo r s af e t y a t
r a il w ay s t a tio n s
A u t h o r s
Ala w a d , H , Ka e w u n r u e n , S a n d An, M
Typ e
Ar ticl e
U RL
T hi s v e r si o n is a v ail a bl e a t :
h t t p :// u sir. s alfo r d . a c . u k /i d/ e p ri n t/ 5 6 1 7 4 /
P u b l i s h e d D a t e
2 0 2 0
U S IR is a d i gi t al c oll e c ti o n of t h e r e s e a r c h o u t p u t of t h e U n iv e r si ty of S alfo r d .
W h e r e c o p y ri g h t p e r m i t s , f ull t e x t m a t e r i al h el d i n t h e r e p o si t o r y is m a d e
f r e ely a v ail a bl e o nli n e a n d c a n b e r e a d , d o w nl o a d e d a n d c o pi e d fo r n o
n-c o m m e r n-ci al p r iv a t e s t u d y o r r e s e a r n-c h p u r p o s e s . Pl e a s e n-c h e n-c k t h e m a n u s n-c ri p t
fo r a n y f u r t h e r c o p y ri g h t r e s t r i c ti o n s .
Learning From Accidents: Machine Learning
for Safety at Railway Stations
HAMAD ALAWAD 1, SAKDIRAT KAEWUNRUEN 1, AND MIN AN 2
1Birmingham Centre for Railway Research and Education, University of Birmingham, Birmingham B15 2TT, U.K. 2School of Built Environment, University of Salford, Manchester M5 4WT, U.K.
Corresponding author: Sakdirat Kaewunruen (s.kaewunruen@bham.ac.uk)
This work was supported in part by the European Union’s Horizon 2020 Research and Innovation Programme through Marie
Skłodowska-Curie under Grant 691135, and in part by the APC through the University of Birmingham Library’s Open Access Fund. The work of S. Kaewunruen was supported in part by the Australian Academy of Science, in part by the Japan Society for the Promotion of Science for his Invitation Research Fellowship (Long-Term), under Grant JSPS-L15701, in part by the Railway Technical Research Institute, in part by The University of Tokyo, Japan, and in part by the European Commission through the H2020-RISE Project under Grant 691135 Rail Infrastructure Systems Engineering Network (RISEN), which enables a global research network that addresses the grand challenge of railway infrastructure resilience and advanced sensing in extreme environments (www.risen2rail.eu) [70].
ABSTRACT In railway systems, station safety is a critical aspect of the overall structure, and yet, accidents at stations still occur. It is time to learn from these errors and improve conventional methods by utilising the latest technology, such as machine learning (ML), to analyse accidents and enhance safety systems. ML has been employed in many fields, including engineering systems, and it interacts with us throughout our daily lives. Thus, we must consider the available technology in general and ML in particular in the context of safety in the railway industry. This paper explores the employment of the decision tree (DT) method in safety classification and the analysis of accidents at railway stations to predict the traits of passengers affected by accidents. The critical contribution of this study is the presentation of ML and an explanation of how this technique is applied for ensuring safety, utilizing automated processes, and gaining benefits from this powerful technology. To apply and explore this method, a case study has been selected that focuses on the fatalities caused by accidents at railway stations. An analysis of some of these fatal accidents as reported by the Rail Safety and Standards Board (RSSB) is performed and presented in this paper to provide a broader summary of the application of supervised ML for improving safety at railway stations. Finally, this research shows the vast potential of the innovative application of ML in safety analysis for the railway industry.
INDEX TERMS Decision tree, machine learning, railway accidents, railway safety, railway station.
I. INTRODUCTION
The growth in technology has expanded into a vast variety of systems, methodologies, and tools for developing policies in society. There is now a demand to implement artificial intelligence (AI) to interpret the 21stcentury’s ever-growing difficulties in nearly every industry and to focus on promoting intelligent systems interactively. Many of these aspects call for a move towards greater intelligence and a greater sharing of data [1]. Industrial organisations are racing into the AI domain, which is being used to improve safety, analytics and accessibility, and real-time intelligent scheduling, thereby increasing productivity. Applications of AI can reduce safety incidents through reductions in downtime, defects and waste. In self-driving vehicles, for instance, passive safety systems
The associate editor coordinating the review of this manuscript and approving it for publication was Omid Kavehei .
have moved beyond traditional systems towards active ones that are able to monitor their surroundings and can act to pre-vent collisions and mitigate human failure [2]. The main con-cern for condition monitoring is the translation of data into information and subsequent employment of that information to improve processes. Machine learning (ML) is a technique for discovering information with self-learning techniques [3], and it has been used in every field due to its ability to obtain useful information from large sets of data [4]. The sector responsible for the railways in the UK, for example, has strategies for digitalising the industry.
There is an opportunity for digital technologies to grant improved levels of safety, in addition to reducing the risk of possible harm to passengers and rail operators. Increasing demand and the capacity of rail networks are important chal-lenges, meaning that potential overcrowding and sometimes delays at peak times are familiar scenes at railway stations.
Incidents are often responsible for delays, and the impact of such events continues to increase. Some older rail stations were designed for closed environments, narrow scopes, and high personnel and facility densities; if an emergency or hazard occurs, there is an expectation of considerable indi-vidual harm and loss of assets. Thus, the safety of stations and technology can be used to recognise any deficiency of those stations [5]. New technologies, such as ML, present an opportunity to address these concerns [6]. Moreover, this modernisation may have many direct and indirect impacts, such as national economic growth, and other benefits such as improved safety for passengers and workers, reduced costs, greater sustainability for assets increased service quality and reliability, and improved operation and maintenance [7]. In this study, we apply a decision tree method to examine how accident information or safety records (i.e., age, day, time, gender, and accident category) assist in decisions, enhance the development of loss prevention strategies in the industry and improve safety in railway stations. This paper is divided into seven parts: I. The introduction, II. The contribution, III. The related work on decision trees, IV. Railway station safety and ML, V. The case study, VI. The discussion, and finally, VII. The conclusion.
II. THE CONTRIBUTION
Diekmann [8] indicated that modern methods were emerging and would be able to analyse complex risks. Some of this progress has become evident in AI and the cognitive sci-ences. Nevertheless, implementation has not yet been fully realised since Diekmann’s [8] prophecy. On the other hand, the application of AI has become more attractive due to the progressive refinement of its models, its reduced cost, and improvement of employees’ skills and lifestyle (digitalisa-tion) as well as increases in computing power [9], [10]. This paper utilizes an ML method, the decision tree (DT) method, to show how this technique can enhance both safety and the analysis of accidents and address risk methodology gaps in railway stations. Our main contribution is a method for automatic railway safety classification and analysis through safety records. The history of accidents in UK stations has been investigated. For this process, we designed a different DT using ML classification software. Two labelled datasets with varying types of accidents were constructed from the calibration run accident reports. Furthermore, we propose a framework for railway station safety benefits based on both internal and external safety data and real-time data to enable the construction of smart stations in the future. The principal objective of this study on safety predictions lies in how to apply ML to establish a prediction model and analyse accidents given a more comprehensive understanding of the risks with an acceptable level of accuracy.
III. RELATED WORK
A. RAILWAY APPLICATIONS AND MACHINE LEARNING
This paper reviews an extensive collection of literature exam-ining the use of ML in the railway industry. The findings from
the relevant research are provided in the next section. It has been found that railway maintenance is essential and decisive for ensuring safety and quality; however, it is costly from an economic perspective. Thus, the maintenance operations in the railway industry and monitoring have drawn attention by many scholars [11]. We present in this section previous studies that have employed ML in the field of infrastructure, operations and trains or the components of systems, including maintenance and monitoring. The Swedish Transport Admin-istration (Trafikverket) first suggested applying ML analysis in big data technology to maintenance activities, therein aim-ing for safe and robust railway assets [12]. To predict the con-ditions that might lead to failures of railway tracks/trains and to improve rail network speeds and railway predictive main-tenance, an ML approach has been proposed [13]. Moreover, comparisons of a specialized support vector machine (SVM) with the DT technique have shown a significantly better performance under the customised SVM [13]. Additionally, the classification of image data by a multi-layer percep-tron and SVM has been performed to automate the process of visual condition monitoring of wooden railway sleepers, therein achieving high classification accuracy [14]. For rail-way track beds, an ML classifier method has been proposed for recognising woody plants [15]. For detecting obstacles on the track, utilising ML technology in comparing input and reference data to train frontal view camera pictures was proposed, therein yielding accurate and successful results in experiments [16]. Moreover, to improve the detection of defects in railway fasteners for improving accuracy and over-all safety, ML has been applied to image recognition on rail-way tracks [3], [17]. Furthermore, to classify wheel failures, a logistic regression model has been developed to predict the possibility of events of high wheel effect train stops, where the results also showed high accuracy [18]. During normal operating speeds and for defect detection in railway train wheels, a sensor system on a railway network has been developed for vertical force wheel measurements. Two ML methods have performed classification with SVM and arti-ficial neural networks for image classification. The modes analyse multiple time series of the vertical force of a wheel to determine whether a wheel has a defect [19]. For high-speed train tracks, the data from maintenance records have been utilised to predict faults, where the results reveal that the support vector regression outperforms other employed tech-niques [11]. Track geometry conditions have been selected for maintenance; thus, supervised and unsupervised ML methods are applied to big data to predict the effects of geocell installation on the track geometry quality. For Dutch railway tracks, operators have been using big data methods to facilitate maintenance decision making, which has shown great potential for railway track condition monitoring [20].
decision makers of railway freight [22]. A survey covering operations, maintenance and safety was conducted to provide a comprehensive review of the applications of big data for the railway [23]. Supervised ML techniques achieve the lowest prediction error and can learn and classify defective tracks from non-defective sections [24]. For railway passenger vol-ume forecasting, SVM optimised by a genetic algorithm (GA-SVM) has been applied to prediction approaches for passenger volumes for railways in China. This method has achieved greater forecasting accuracy compared with artifi-cial neural networks [25]. For timetable improvement and real-time delay monitoring in a range of real train networks of the Deutsche Bahn, a delay prediction system has been developed utilising a neural network [26]. For studying and analysing large volumes of data, ML methods are growing increasingly powerful for track condition prediction, therein achieving improvements in future railway safety and service quality [27]–[29]. A vision-based object detection algorithm for passenger safety on a railway platform that detects risks in stations in real time has been proposed [30], [31]. Some additional related work is presented in Table 1. In conclu-sion, the related work discussed above presents a range of approaches taken for researching ML in the railway indus-try and how such advanced technology is being utilised to advance the big data revolution in the context of the railway industry.
B. ML AND DTS BACKGROUND
This section introduces ML and supervised learning, which are related to our paper. ML is particularly important in DT, and a brief description is given below. ML models propose to ‘‘learn’’ the association between a set of input and output data. Scholars engaged in AI desire to explore whether machines can learn from historical data to produce reliable decisions and conclusions, and the field of ML has obtained substantial momentum. Improvements in computing and communica-tions technologies have led to a strengthening of the argu-ment for applying complicated numerical predictions to big data, as it would become increasingly fast over time. Some examples of sectors applying ML are the following:
• Financial (assessing risk and fraud detection)
• Healthcare (diagnostic care and health monitoring)
• Retail (Online recommendations and marketing)
[image:4.576.303.534.95.543.2]There are three main types of ML. One type is supervised learning, which requires labelled data to train models and make predictions. The second type is unsupervised learn-ing, which determines patterns from unlabelled data. The third type is reinforcement learning, which enhances learn-ing from feedback obtained from interactions with external environments. Numerous classifier models have been used in several fields, and each model has benefits and limitations in performing experiments based on research needs. Linear discriminant analysis (LDA) and naive Bayes provide proba-bilities, and samples belonging to classes of SVM and neural networks perform better on multidimensional and continuous
TABLE 1.Examples of studies utilising advanced methods in railway applications.
FIGURE 1. Examples of DT for the incident type training set.
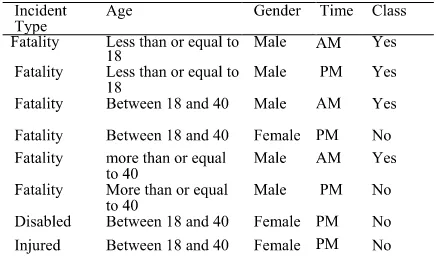
TABLE 2. Training set of incident type.
describes a value that the node can find. Fig. 1 is an instance of a DT for the training set of Table 2. There are several variants of DTs such as classification and regression trees (CART), chi-squared automatic interaction detection (CHAID), and iterative dichotomiser ID3, C4.5, and C5.0 [42]–[44].
Using the DT described in Fig. 1 as an example, the instance (incident type, age, gender, and time) will be used to classify the nodes as incident type, age, and gender, which would categorise the instance as being positive (classified as Yes).
DT algorithms use a set of supervised learned decision rules for predictions based on inputs of selected predictor fac-tors and learning from overlapping attributes; moreover, it has been shown that the DTs have satisfactory computational performance and easier logical explanations. The model is based on the DT model based on CART. The algorithm in the software that was utilised in the model was inspired by Breiman’s [45] CART DT models 1984. CART is a DT algorithm that produces binary classification or regression trees, depending on whether the target variable is categorical
or numeric, and extracts the existing patterns or rules found in the dataset. The model with CART is substantially more scalable and able to address multiple data types simultane-ously. The model stops growing when they have exhausted their ability to better fit the training data. Each tree node attempts to split the data in the most optimal manner so that the classification splits maximize the information gain.
IV. RAILWAY STATION SAFETY AND ML
[image:5.576.48.266.335.465.2]can be used for analysing accidents and assessing the risks facing safety-critical infrastructure such as railways. This would allow for the processing of big data in the form of indicators from daily operations and from historical data accidents, which would be used for training and testing the model and then implementing a reliable, robust model for facilitating real-time safety monitoring in railway stations.
A. SAFETY AND ML (APPROXIMATION MODEL)
The objective is to minimise the risk, which is an important aspect of ML. In this section, we present the functional esti-mation of the model, which makes it implicit that risk is a functional R(m). It is suggested that the learning steps can be divided into three stages:
1- A random vectorxthat is captured independently from
a fixed but unknown distributionP(x) must be gener-ated.
2- The output vector is assumed as y,which is returned
by the supervisor for every input vector according to a conditional distribution functionP(y|x), which is also fixed but unknown.
3- The learning machine is able to execute a set of
func-tions f(x,w) ,w ∈ W. The best scenario of the
response or the supervisor’s response is selected as a step in the ML process from the given set of functions based on a training set oftindependent observations:
(x1, y1), (x2, y2)(xt,yt) (1)
This shows that learning corresponds to the problem of function estimation. To find the risk functional, R(m), we need to consider the loss or discrepancy L(y, z), where y is the response of the supervisor to a given input x and z is the response functional provided by the learning machine,
where z=f (x, w) (see part three of the learning steps) and
the loss will be L(y, f (x, w)). Thus, the expected value of the discrepancy, given by the risk functional, is
R(m)= Z
L(y,f (x,w))dP(x|y) (2)
Over the set of functions f (x,w) ,w ∈ W, the target is to minimise the risk functional R (m). However, the joint probability distributionP(x|y)=P(y|x)P(x) is unknown, and the only available information is contained in the training set (1) [55]. The risk minimisation approach to ML has shown strengths in practical applications and has the ability to capture the safety risk component.
However, it does not capture issues related to uncertainty and loss functions that are relevant for safety. To enhance safety with ML, four groups of principles have been classi-fied:
• Safety reserves (safety factors and margins)
• Inherently safe design (replace dangerous material by
less dangerous materials)
• Safe failure (system remains safe when it fails)
• Procedure safeguards (training, quality, standards, etc.)
To extend the ML model beyond risk reduction for improv-ing safety, it has been suggested that each of these principles should be sought [56].
B. FLOWCHART OF ML IN THE SAFETY PROCESS
Given that railway stations are crowded areas and pose a challenge to safety and security, efforts do not fall exclusively to the state or the stockholders but rather relate to society as a whole. The stations have certain characteristics, such as being crowded and complicated, and may have weak management systems. Many systems located in the stations, with their open structure, characterize the complexity of the railway stations. The control and prevention of unexpected events in the stations are critical, and thus, new technology needs to be used more frequently to make them secure and safe. Therefore, railway station system features will be analysed, with the aim of providing suggestions for the improvement and employment of technology and for designing a safety and security framework. There are variants of applications utilis-ing AI technologies such as ML and big-data in many indus-tries, such as medical, banking, and marketing; however, few technologies are being used in railways and transportation. Information on safety, security monitoring and emergency rescue by supervision in the rail system has not yet been entirely generated due to a lack of integrated systems for rail transportation safety and security, as well as delayed implementations of technology. Therefore, there is a lack of ability to utilize significant amounts of data in the railway industry to explain the relationships between operational fac-tors, safety and security, especially in railway stations. Thus, more research is required to validate this relationship, which is the goal of this research, and to design benchmarks for the expected level of safety and security performance in railway stations. In addition, in future work, the obtained data will allow for its validity to be evaluated in a case study of the proposed framework. Massive dataset resources are captured for analysis, including the history of accidents locally and internationally. The concept of a smart city and smart stations represents an advanced level of this technology. Intelligently gathered information, weather conditions and crime can be associated in real time with the railway data centre and used to predict scenarios and consequences. This knowledge dis-covery from the predictive model will actively aid decision makers, save time and enhance safety and security at stations, therein expecting to obtain high-performance predictions (see Fig. 2).
FIGURE 2. Flowchart of proposed ML used in the safety process.
directly or indirectly affect the station’s safety and security can be discovered. These factors work as indicators to ensure more effective safety systems in the stations. Moreover, the model aims at advancing measures and supplying an essential basis of absolute safety and security systems, as well as devel-oping safety management and a foundation for a comprehen-sive design framework including new technologies [57], [58].
V. CASE STUDY
This paper selects a representative sample of accidents that occurred in the stations and lead to fatalities. The aim of this case study is to expound upon the potential for applying supervised ML to the railway industry. The importance of this study is in its explanation of the potential of ML to be used in improving services, management and, in partic-ular, safety in station environments. This designed model for predicting safety and supporting decision makers is based on data collected from rail reports (RSSB) since 2002. The collected data on accidents that have been reported and pub-lished represent a selection of 80 incidents at stations in the UK that have been or are subject to an investigation by the UK’s national investigation body: the Rail Accident Inves-tigation Branch (RAIB) [59], [60]. The process of applying supervised ML is a process of learning a set of rules from instances (examples in a training set). Generally, the first step in the supervised learning method is collecting the dataset and
finding the attributes that are the most informative. The next step is preparing the data; in most cases, the data contain noise and missing feature values and consequently require mean-ingful pre-processing [17], [61]. Next, the classifier model is selected, and to calculate a classifier’s accuracy, we split the dataset for training the model and evaluations.
A. DATA PREPARATION
FIGURE 3. Example of an alluvial diagram of raw accident data: accident details, outcome, day, time, and passenger age.
Some operations have been conducted to modify the data structure to fit the modelling process, including the following:
• Generalization: For example, the date of the accident
field in the accident documents, which consists of the year, month, and the day, is amended to contain the spe-cific day of the week (Saturday (D-1) etc.) and particular time such as AM or PM.
• Designing highlights: From the cause of each accident,
for example, falling from the platform and being struck by the train (T1-F), electrical shock (T2-E), or being struck by a moving train (T3-S), a distinct feature is created.
• Transforming data: The set of values is consistent with
a new set of feature values. For example, the day of the accident, age and gender (Female (G-F) and Male (G-M)) of the person are converted into discrete values.
• Reducing or removing redundant features: Features that
are inappropriate for this study, such as accident occur-ring out of the stations, the accidents not leading to death or the accidents not having details of the person who was involved, are removed or reduced.
The data selection from the published reports provides factors that might characterise the scenarios of events, such as passenger age and gender, as well as the day of the event and the exact time. Details of the accidents have also
been considered. Moreover, depending on the RSSB reports, the data that have been used in this report are cut-off from the industry’s safety management information system (SMIS). By preparing and cleaning the data during data explo-ration, the number of accidents is reduced to 71 accidents (instances), with five variables, resulting in fatalities at the train station boundaries (see Fig. 4). Each accident related to stations and the information from railway industries generally do not have many details except for certain reports on the web. Considering existing data and their value, we work with a small database, and we attempt to make these data more useful; thus, non-relevant information is removed [62], [63].
B. THE ANALYSIS AND CLUSTERING
FIGURE 4. Example of an alluvial diagram of accident data after processing, showing the accident type, time, day, passenger age and passenger gender.
FIGURE 5. Scatterplot showing a correlation between the details of the accidents and time with the passenger age.
method and for proving the power of ML in analysing safety data. The ML tool (MLT) enables us to review and visualise descriptive statistics of the dataset (see Figs. 5 and 6 below). This also shows the distribution of the passengers’ age, time and details for each accident [40]. The DTs in the selected MLT are dynamic methods used to analyse the datasets. Thus, we set the attributes of the accidents as our target; thus, any predictor from the dataset can be used. The
FIGURE 6. Scatterplot showing the correlation between the details of the accidents and day of the week with the passenger age.
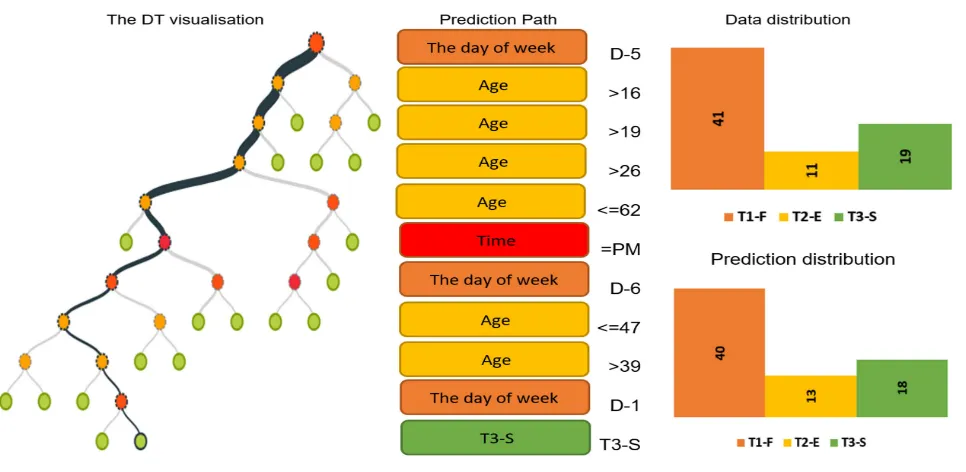
[image:9.576.300.537.423.593.2]FIGURE 7. DT diagram and graphs showing the prediction and data distribution from the training dataset.
TABLE 3. The analysis of the dataset.
For further exposition of ML techniques in such cases, a clustering method is applied because intelligent methods used to present and extract data patterns of interest are searched, and it is shown that ML is a powerful analysis method for safety and risk management in railway stations. To analyse the unsupervised dataset, ML is chosen with the K-means algorithm (canonical clustering), where the number of clusters is eight. However, the remainder of the work is supervised ML. Utilising cluster analysis involves separating datasets into subsets of instances (clusters) and finding simi-larities (see Fig. 8 and Table 4). The clusters are placed closer to one another if they are more similar and farther away if they are very dissimilar, where, for example, cluster number 5 is a long distance from the other clusters. The size of a cluster, presented as a circle, is proportional to the number of
FIGURE 8. The 8-cluster diagram nodes and histograms.
instances in that group; thus, the largest cluster has 14 cases, and the smallest cluster has only 3 cases. Cluster analysis is often an iterative process that requires some trial and error until the most useful grouping of data instances is achieved. However, we utilise the 8 clusters as the default. To process the learning data, the K-means algorithm from data mining starts with the first group of randomly selected centroids, which are used as the initial points for every cluster, and then performs iterative (repetitive) calculations to optimise the positions of the centroids. The MLT utilises optimised versions of the K-means algorithm; the user needs to specify the number of clusters in advance, here specified as 8.
C. DECISION TREE CLASSIFICATION
[image:10.576.38.276.362.539.2]TABLE 4. The details of the clusters.
many possible ML approaches to safety analysis. In this case, we train a DT to classify the accidents and the patterns that occurred in these accidents in the stations [66]. This model is applied to a wide variety of data, and it is preferable because its structured rules are simple to follow and understand. This technique is used to classify instances by classifying them based on feature values [67]. The two general types of DTs are classification (where the class variable is discrete) and regression (where the class variable is continuous) [67], [68]. After the datasets are uploaded, a DT model is designed and visualised. The DT for the predictive model provides a visualisation of the prediction case. The DTs have useful information, and branches are used to make a branching deci-sion. This shows the decisions that led to a given prediction. The tool presents the model prediction path on the side of the tree, which gives this tool an advantage. The tree has colours that denote the different lists that the branch possesses, which are presented with strengths to classify the predictive path.
D. PREDICTION AND ANALYSIS
The DT model has been applied for predicting the future values of passenger attributes based on previously observed values. In this case study, the target passenger characteris-tics can be changed from one characteristic to another. This results in a unified framework that can perform analyses of variable data using the ML algorithms. This DT shows the prediction path, where the strength of the path in the tree is indicated by bolded branch paths. The time attribute has been selected as a predictor (see Fig. 9).
Obtaining more details of the prediction path and input data changes of the input fields has been an interesting process. After midday, the prediction shows more accidents for an older passenger at the end of the week. The time represents a critical point as an input field affecting the prediction. There is a slight influence of the day in the forecast, which may refer to other factors not involved in this case study (see Figs. 10 and 11).
Some factors are clear, such as the time, where PM experi-enced more accidents than AM. The large ratio of accidents occurring for males is seen in two important age groups: the young and the old. Many factors, such as intoxication, must be considered; however, in this research, we attempted to apply ML rather than a deep analysis of the causes of the accident. The DT has been applied, and it shows how the pre-diction path predicts the target instances. The results present acceptable values that will be further justified with more available data in future research. Depending on the selected data type and the prediction targets, certain algorithms will be chosen. For instance, the accident type T1-F has been targeted to present the numerical data of the prediction path from the DT (see Table 5).
E. LEARNING AND VALIDATION
[image:12.576.307.528.63.276.2]Evaluating the model to ensure that it produces reliable pre-dictions is significant. In this section, we aim to obtain an overview of the model’s predictive performance and create
[image:12.576.303.529.327.531.2]FIGURE 10. Comparisons of the input field on the prediction path with different factors (time and the details of the accidents). The result is shown for the example accident type T3-S during PM.
FIGURE 11. Comparisons of input fields on the prediction path with different factors (time and the day of week) for example day 7.
FIGURE 12. The process of splitting the dataset.
[image:12.576.304.531.574.657.2]TABLE 5. The DT prediction path example, where the target in this example is the accident type T1-F.
predict new data that are not part of this training subset. This useful model has been shown to be well balanced in terms of avoiding both overfitting and underfitting. The MLT extends a training/testing data split by choosing subsets for generating
FIGURE 13. The evaluation results of the performance per class in the confusion matrix.
the 80%/20% split of the dataset. The former can be applied to train the model and the latter to test it; thus, 15 accidents are randomly selected for testing, and the remaining 56 are used for training the model (Fig. 12). The accident scenarios in the dataset’s matrix include the attributes of the age and sex of the passenger, the day and time, and the cause that led to death.
The MLT provides a way to measure and compare the performance of the models. Moreover, the tool allows for the creation of a new DT model with a modified confidence value. We can now compare and evaluate the DT models. The prediction model is a classifier of the instances between the passenger traits in our prediction model, which depend on the accident parameter history. A two-class prediction was selected (binary classification) in the case of fatal accidents in the stations (to determine whether the accident occurred during PM (0) or AM (1)). The outcomes of the prediction are labelled as either positive or negative. If the prediction is positive and the actual value is also positive, then it is called a true positive (TP); with the same concepts, false positives (FP), true negatives (TN), and false negatives (FN) are realised. The four outcomes can be formulated as a 2 x 2 contingency table or confusion matrix, as shown below (see Fig. 13).
[image:13.576.66.249.105.662.2]FIGURE 14. 2D parallel coordinates plot.
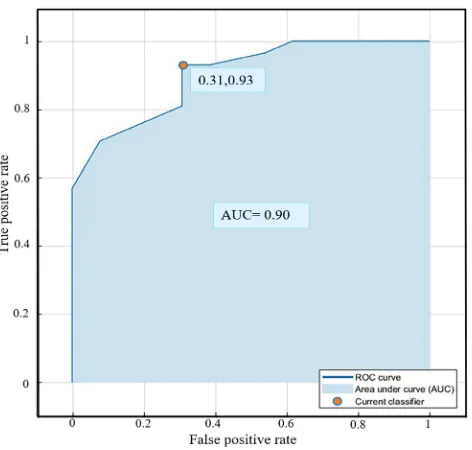
FIGURE 15. The ROC curve, which shows that the area under the curve (AUC) is 0.90. This evaluation model with positive class PM and a threshold of between 50% and 80% of the data (training data) vs. 20% of the data (testing dataset).
variables, are calculated utilising the MLT. The accuracy is the product of correct predictions over the total number of instances that have been evaluated. For a further investiga-tion of features and visualisainvestiga-tion of the predicinvestiga-tion traits or correlation features of the results connecting to the accident patterns and safety predictors, see the parallel coordinate plot (Fig. 14).
In the model, the precision percentage and the recall rate indicate that the model had few false positives and neg-atives; hence, the model was more correct than incorrect when deciding whether the passengers involved in the acci-dents were there during the AM vs. PM. The area under the curve (AUC) was measured under the ROC curve. The decision tree achieves higher AUC values of 0.90, which indicates an improved classifier performance (Fig. 15).
VI. DISCUSSION
[image:14.576.40.276.371.596.2]validate other such user behaviours or ticketing systems to determine any correlation and thus design predictors. It has been noted that the platform is a significant area of the station where many accidents occur, and the train interfacing with the passengers is a key aspect of the selected accidents. Some factors, such as time, where PM saw more accidents than AM, are clear. A high ratio of accidents occurring for males has been seen in two important age groups: the young and the old. Many factors, such as intoxication, must be considered; how-ever, in the research, we attempt to apply ML rather than any deep analysis of the causes of the accidents. Several factors need to be involved in understanding the entire image of the accidents that have not been available in many open-source datasets. The DT method has been applied, and it shows how the prediction path predicts the target instances. The results present acceptable values that will be further justified with more available data as a part of future research. Depending on the selected data type and the prediction targets, the proper algorithms can be chosen. The classification of supervised ML has been applied and presented, therein showing high performance; some of the objectives of the model are as follows:
1 - Providing information that may demand that future rail-way stations perform in-depth analysis and classification and consider how they can obtain automated safety, therein being integrated with other developments or advanced techniques.
2 - Determining any possible shorting in current safety systems or frameworks and then improving the comprehen-siveness of any sophisticated technology.
3 - Prediction of risk or consequences based on official recorded safety data.
The methodology of Ml is a promising technique that can learn from historical data and overcome uncertainty. In addition, the method affords real-time output to the deci-sion maker and opens new windows to the cloud, IoT, smart stations and smart cities. This method can be used in real time to present the situation in the station in a timely manner. The technique leads to automation of the field and allows the process to be smarter. The ML technique can be fed with data by integrating many systems, such as automated fare collection (AFC) systems, fire and alarm systems, and any external systems such as police and other agencies, as well as safety record systems from other stations [30], [69]. Finally, the intelligent analytical approach used in this research yields more beneficial knowledge of rail station safety and will be useful in the future for designing risk management plans for rail stations worldwide.
VII. CONCLUSION
Various ML methods can be applied to safety tasks in the railway industry. In this study, an innovative proposal to utilise the true potentials of ML by the railway industry for improving the safety of stations is presented. Based on the study in this paper, the supervised algorithm performs accurately, and state-of-the-art applications can be effectively addressed using ML. Additionally, employing a variety of
algorithms using ML provides robust and beneficial analysis of the history of the safety records. We have demonstrated the applicability of DTs to this safety task for railway stations. Although there are other classifiers with conceivably bene-ficial classifications and prediction performances, DTs yield easily interpretable accident details. The MLT demonstrated the validity of the model and the distributed analysis of the data. Additionally, it was employed to determine the rele-vance and importance of the chosen accident conditions. This method achieves good prediction accuracy, in this case, and we used a rather small dataset to prove the application of ML in railway station safety, where there is no doubt that larger datasets and more attributes would play a significant role in the analysis and results. The classification of supervised ML has been applied and presented in this study, therein showing high and acceptable performance. Indeed, a practical applica-tion requires a huge amount of test data and accident details for teaching the model and thus producing more patterns and predictions. From the model and case study, applying ML modelling for improving safety in railway stations is a chal-lenge, and deeper technical and analytical work is needed. Therefore, more in-depth research is required. To be able to process safety data in real time, we have to integrate some of the systems in the railway stations and possibly use automated gathering of the data to extract the most useful data from many indicators. The railway industry can choose any safety data sets that have been recorded to teach an ML application with a range of analytical methods. Additionally, they can select safety datasets for analysis and validate other aspects, such as user behaviours and ticket systems, to determine any correlation and to design predictors. It has been noted that the platform is a significant area of the station where many acci-dents occur, and the train interfacing with the passengers is the key to the selected accidents. Finally, predicting people’s behaviours and accident conditions is strategically of great value in safety and security. In general, but also specifically in the railway industry, this topic may be addressed by ML in the near future. However, the shortage of data available to apply ML remains a challenge for researchers. Moreover, in this work, accidents were not only analysed, but also a method was recommended to enhance ML applications for railway safety, risk management and accident investigation concep-tualization, implementation, and big data. We hope that such proposals will greatly benefit future research concerning ML in railway safety research.
REFERENCES
[1] H. J. Parkinson, G. Bamford, and B. Kandola, ‘‘The development of an enhanced bowtie railway safety assessment tool using a big data analytics approach,’’ inProc. Int. Conf. Railway Eng. (ICRE), Brussels, Belgium, May 2016, pp. 1–9, doi:10.1049/cp.2016.0510.
[2] C. Martin and H. Leurent,Technology and Innovation for the Future of Production: Accelerating Value Creation. Geneva, Switzerland: World Economic Forum, 2017.
[4] L. Dai, ‘‘A machine learning approach for optimisation in railway plan-ning,’’ Ph.D. dissertation, Dept. Math. Comput. Sci., Delft Univ. Technol., Delft, The Netherlands, 2018.
[5] C. Zuo, Y. Zhang, Z. Xing, and Y. Qin, ‘‘Study on safety evaluation of urban rail transit station,’’ inProc. 33rd Chin. Control Conf., Nanjing, China, Jul. 2014, pp. 3187–3190, doi:10.1109/ChiCC.2014.6895462.
[6] (Apr. 2018).Network Rail, Digital Railway Strategy, report. Accessed: Nov. 18, 2019. [Online]. Available: https://cdn.networkrail.co.uk/wp-content/uploads/2018/05/Digital-Railway-Strategy.pdf
[7] (2018). Network Rail, The Digital Railway Programme. Accessed: Nov. 18, 2019. [Online]. Available: https://cdn.networkrail.co.uk/wp-content/uploads/2018/05/Digital-Railway-Programme.pdf
[8] J. E. Diekmann, ‘‘Risk analysis: Lessons from artificial intelligence,’’Int. J. Project Manage., vol. 10, pp. 75–80, May 1992, doi: 10.1016/0263-7863(92)90059-I.
[9] I. J. Goodfellow, Y. Bengio, and A. Courville,Deep Learning. Cambridge, MA, USA: MIT Press, 2016.
[10] N. Paltrinieri, L. Comfort, and G. Reniers, ‘‘Learning about risk: Machine learning for risk assessment,’’Saf. Sci., vol. 118, pp. 475–486, Oct. 2019, doi:10.1016/j.ssci.2019.06.001.
[11] C. Bergmeir, G. Sáinz, C. M. Bertrand, and J. M. Benítez, ‘‘A study on the use of machine learning methods for incidence prediction in high-speed train tracks,’’ inRecent Trends in Applied Artificial Intelligence (Lec-ture Notes in Computer Science). Berlin, Germany: Springer, Jun. 2013, pp. 674–683, doi:10.1007/978-3-642-38577-3_70.
[12] A. Thaduri, D. Galar, and U. Kumar, ‘‘Railway assets: A potential domain for big data analytics,’’Procedia Comput. Sci., vol. 53, pp. 457–467, Jan. 2015, doi:10.1016/j.procs.2015.07.323.
[13] H. Li, ‘‘Improving rail network velocity: A machine learning approach to predictive maintenance,’’Transp. Res. C, Emerg. Technol., vol. 45, pp. 17–26, Aug. 2014, doi:10.1016/j.trc.2014.04.013.
[14] S. Yella, S. Ghiamati, and M. Dougherty, ‘‘Condition monitoring of wooden railway sleepers using time-frequency techniques and pattern classification,’’ inProc. IEEE Int. Conf. Syst. Man Cybern., San Antonio, TX, USA, Oct. 2009, pp. 4164–4169, doi:10.1109/ICSMC.2009.5346713.
[15] R. G. Nyberg, ‘‘A machine learning approach for recognising woody plants on railway trackbeds,’’ inProc. Int. Conf. Railway Eng. (ICRE), Brussels, Belgium, 2016, pp. 1–5, doi:10.1049/cp.2016.0513.
[16] H. Mukojima, ‘‘Moving camera background-subtraction for obstacle detection on railway tracks,’’ inProc. IEEE Int. Conf. Image Process. (ICIP), Phoenix, AZ, USA, Sep. 2016, pp. 3967–3971, doi: 10.1109 /ICIP.2016.7533104.
[17] X. Gibert, V. M. Patel, and R. Chellappa, ‘‘Deep multitask learning for railway track inspection,’’IEEE Trans. Intell. Transp. Syst., vol. 18, no. 1, pp. 153–164, Jan. 2017, doi:10.1109/TITS.2016.2568758.
[18] L. Hajibabai, ‘‘Wayside defect detector data mining to predict poten-tial WILD train stops,’’ in Proc. Annu. Conf. Expo. Amer. Railway Eng. Maintenance-Way Assoc. (AREMA), Chicago, IL, USA, Sep. 2012, pp. 1–39.
[19] G. Krummenacher, C. S. Ong, S. Koller, S. Kobayashi, and J. M. Buhmann, ‘‘Wheel defect detection with machine learning,’’IEEE Trans. Intell. Transp. Syst., vol. 19, no. 4, pp. 1176–1187, Apr. 2018, doi: 10. 1109/TITS.2017.2720721.
[20] A. Núñez, J. Hendriks, Z. Li, B. D. Schutter, and R. Dollevoet, ‘‘Facilitating maintenance decisions on the Dutch railways using big data: The ABA case study,’’ inProc. IEEE Int. Conf. Big Data (Big Data), Washington, DC, USA, Oct. 2014, pp. 48–53, doi:10.1109/BigData.2014.7004431.
[21] A. Jamshidi, S. Faghih-Roohi, S. Hajizadeh, A. Núñez, R. Babuska, R. Dollevoet, Z. Li, and B. De Schutter, ‘‘A big data analysis approach for rail failure risk assessment,’’Risk Anal., vol. 37, no. 8, pp. 1495–1507, Aug. 2017, doi:10.1111/risa.12836.
[22] X. Zhang and D. Gong, ‘‘Application of big data technology in mar-keting decisions for railway freight,’’ in Proc. Int. Conf. Logistics Eng. Manage. (ICLEM), Shanghai, China, Sep. 2014, pp. 1136–1141, doi:10.1061/9780784413753.172.
[23] F. Ghofrani, Q. He, R. M. P. Goverde, and X. Liu, ‘‘Recent applica-tions of big data analytics in railway transportation systems: A sur-vey,’’Transp. Res. C, Emerg. Technol., vol. 90, pp. 226–246, May 2018, doi:10.1016/j.trc.2018.03.010.
[24] E. N. Martey, L. Ahmed, and N. Attoh-Okine, ‘‘Track geometry big data analysis: A machine learning approach,’’ inProc. IEEE Int. Conf. Big Data (Big Data), Boston, MA, USA, Dec. 2017, pp. 3800–3809, doi:10.1109/BigData.2017.8258381.
[25] X. Chen, ‘‘Railway passenger volume forecasting based on support vector machine and genetic algorithm,’’ in Proc. ETP Int. Conf. Future Comput. Commun., Wuhan, China, Jun. 2009, pp. 282–284, doi:10.1109/FCC.2009.81.
[26] J. Peters, B. Emig, M. Jung, and S. Schmidt, ‘‘Prediction of delays in public transportation using neural networks,’’ inProc. Int. Conf. Comput. Intell. Model. Control Automat. Int. Conf. Intell. Agents Web Technol. Internet Commerce (CIMCA-IAWTIC), Vienna, Austria, Nov. 2005, pp. 92–97, doi:10.1109/CIMCA.2005.1631451.
[27] L. Bai, R. Liu, Q. Sun, F. Wang, and F. Wang, ‘‘Classification-learning-based framework for predicting railway track irregularities,’’Proc. Inst. Mech. Eng. F, J. Rail Rapid Transit, vol. 230, no. 2, pp. 598–610, Oct. 2014, doi:10.1177/0954409714552818.
[28] J. M. Hart, L. F. Molina, E. Resendiz, J. R. Edwards, N. Ahuja, and C. P. L. Barkan, ‘‘Development of a machine vision system for the inspec-tion of heavy-haul railway turnout and track components,’’ inProc. Int. Heavy Haul Assoc. Conf., Calgary, AB, Canada, Jul. 2011, pp. 1–8. [29] C. Hu and X. Liu, ‘‘Modeling track geometry degradation using support
vector machine technique,’’ inProc. Joint Rail Conf. Amer. Soc. Mech. Eng. Digit. Collection, Columbia, SC, USA, Apr. 2016, doi: 10.1115/JRC2016-5739.
[30] H. Alawad and S. Kaewunruen, ‘‘Wireless sensor networks: Toward smarter railway stations,’’Infrastructures, vol. 3, no. 3, p. 24, Jul. 2018, doi:10.3390/infrastructures3030024.
[31] S.-C. Oh, G.-D. Kim, W.-T. Jeong, and Y.-T. Park, ‘‘Vision-based object detection for passenger’s safety in railway platform,’’ inProc. Int. Conf. Control Automat. Syst., Seoul, South Korea, Oct. 2008, pp. 2134–2137, doi:10.1109/ICCAS.2008.4694449.
[32] E. Bikov, P. Boyko, E. Sokolov, and D. Yarotsky, ‘‘Railway inci-dent ranking with machine learning,’’ in Proc. 16th IEEE Int. Conf. Mach. Learn. Appl. (ICMLA), Cancun, Mexico, Dec. 2017, pp. 601–606, doi:10.1109/ICMLA.2017.00-95.
[33] A. Jamshidi, ‘‘A decision support approach for condition-based mainte-nance of rails based on big data analysis,’’Transp. Res. C, Emerg. Technol., vol. 95, pp. 185–206, Oct. 2018, doi:10.1016/j.trc.2018.07.007.
[34] Y. Han, Z. Liu, Y. Lyu, K. Liu, C. Li, and W. Zhang, ‘‘Deep learning-based visual ensemble method for high-speed railway catenary cle-vis fracture detection,’’ Neurocomputing, Apr. 2019, doi: 10.1016/j. neucom.2018.10.107.
[35] H. Tam, K. Lee, S. Liu, L. Cho, and K. Cheng, ‘‘Intelligent optical fibre sensing networks facilitate shift to predictive maintenance in railway systems,’’ in Proc. Int. Conf. Intell. Rail Transp. (ICIRT), Singapore, Dec. 2018, pp. 1–4, doi:10.1109/ICIRT.2018.8641602.
[36] M. Heidarysafa, K. Kowsari, L. Barnes, and D. Brown, ‘‘Analysis of railway accidents’ narratives using deep learning,’’ inProc. 17th IEEE Int. Conf. Mach. Learn. Appl. (ICMLA), Orlando, FL, USA, Dec. 2018, pp. 1446–1453, doi:10.1109/ICMLA.2018.00235.
[37] H. Rowshandel, G. L. Nicholson, J. L. Shen, and C. L. Davis, ‘‘Charac-terisation of clustered cracks using an ACFM sensor and application of an artificial neural network,’’NDT E Int., vol. 98, pp. 80–88, Sep. 2018, doi:10.1016/j.ndteint.2018.04.007.
[38] Y. Jiang, H. Wang, G. Tian, Q. Yi, J. Zhao, and K. Zhen, ‘‘Fast classification for rail defect depths using a hybrid intelligent method,’’Optik, vol. 180, pp. 455–468, Feb. 2019, doi:10.1016/j.ijleo.2018.11.053.
[39] H. Wang, A. Núñez, Z. Liu, D. Zhang, and R. Dollevoet, ‘‘A Bayesian network approach for condition monitoring of high-speed railway catenaries,’’IEEE Trans. Intell. Transp. Syst., to be published, doi:10.1109/TITS.2019.2934346.
[40] The BigML Team. Corvallis, OR, USA. (2019).Classification and Regres-sion With The BigML Dashboard. Accessed: Nov. 18, 2019. [Online]. Available: http://bigml.com
[41] S. B. Kotsiantis, I. Zaharakis, and P. Pintelas, ‘‘Supervised machine learn-ing: A review of classification techniques,’’ inProc. Conf. Emerg. Artif. Intell. Appl. Comput. Eng. Real Word AI Syst. Appl. eHealth HCI Inf. Retr. Pervasive Technol., vol. 160, 2007, pp. 3–24, doi: 10.1007/s10462-007-9052-3.
[42] S. K. Chandrinos, G. Sakkas, and N. D. Lagaros, ‘‘AIRMS: A risk manage-ment tool using machine learning,’’Expert Syst. Appl., vol. 105, pp. 34–48, Sep. 2018, doi:10.1016/j.eswa.2018.03.044.
[43] J. R. Quinlan, ‘‘Induction of decision trees,’’Mach. Learn., vol. 1, no. 1, pp. 81–106, Mar. 1986, doi:10.1007/BF00116251.
[45] L. Breiman,Classification and Regression Trees. Belmont, CA, USA: Wadsworth International Group, 1984.
[46] L. Schnieder, E. Schnieder, and T. Ständer, ‘‘Railway safety and security— Two sides of the same coin?!’’ in Proc. Int. Railway Saf. Conf., Braunschweig, Germany, 2009, pp. 1–16.
[47] V. Villa, N. Paltrinieri, and V. Cozzani, ‘‘Overview on dynamic approaches to risk management in process facilities,’’Chem. Eng. Trans., vol. 43, pp. 2497–2502, Jan. 2015.
[48] A. Meel and W. D. Seider, ‘‘Plant-specific dynamic failure assessment using Bayesian theory,’’Chem. Eng. Sci., vol. 61, no. 21, pp. 7036–7056, Nov. 2006, doi:10.1016/j.ces.2006.07.007.
[49] G. D. Creedy, ‘‘Quantitative risk assessment: How realistic are those frequency assumptions?’’J. Loss Prevention Process Ind., vol. 24, no. 3, pp. 203–207, May 2011, doi:10.1016/j.jlp.2010.08.013.
[50] S. Andersen and B. A. Mostue, ‘‘Risk analysis and risk management approaches applied to the petroleum industry and their applicability to IO concepts,’’ Saf. Sci., vol. 50, no. 10, pp. 2010–2019, Dec. 2012, doi:10.1016/j.ssci.2011.07.016.
[51] M. Kalantarnia, F. Khan, and K. Hawboldt, ‘‘Dynamic risk assessment using failure assessment and Bayesian theory,’’J. Loss Prevention Process Ind., vol. 22, no. 5, pp. 600–606, Sep. 2009, doi:10.1016/j.jlp.2009.04.006.
[52] X. Yang, S. Haugen, and N. Paltrinieri, ‘‘Clarifying the concept of oper-ational risk assessment in the oil and gas industry,’’Saf. Sci., vol. 108, pp. 259–268, Oct. 2018, doi:10.1016/j.ssci.2017.12.019.
[53] C. Q. X. Poh, C. U. Ubeynarayana, and Y. M. Goh, ‘‘Safety lead-ing indicators for construction sites: A machine learnlead-ing approach,’’
Automat. Construct., vol. 93, pp. 375–386, Sep. 2018, doi:10.1016/j. autcon.2018.03.022.
[54] (Feb. 2, 2017). How Big Data, Modelling and Machine Learning are Shaping Safety in BC. Accessed: Nov. 18, 2019. [Online]. Avail-able: https://www.technicalsafetybc.ca/blog/how-big-data-modeling-and-machine-learning-are-shaping-safety-bc
[55] V. Vapnik, ‘‘Principles of risk minimization for learning theory,’’ inProc. 4th Int. Conf. Neural Inf. Process. Syst., Denver, CO, USA, Dec. 1991, pp. 831–838.
[56] K. R. Varshney, ‘‘Engineering safety in machine learning,’’ inProc. Inf. Theory Appl. Workshop (ITA), La Jolla, CA, USA, Jan. 2016, pp. 1–5, doi:10.1109/ITA.2016.7888195.
[57] G. Cai, L. Jia, L. Zhou, Y. Liang, and X. Li, ‘‘Research on rail safety security system,’’Int. J. Econ. Manage. Eng., vol. 4, no. 8, pp. 1938–1943, 2010. Accessed: Nov. 18, 2019. [Online]. Available: https://publications .waset.org
[58] An Agency of the European Union, Big Data In Railways, docu-ment ERA-PRG-004-TD-003 V 1.0/, European Union Agency Railways, Valenciennes, France, 2016. Accessed: Nov. 18, 2019. [Online]. Avail-able:https://www.era.europa.eu/
[59] Government Agency. Derby, Farnborough, U.K. Rail Accident Investigation Brach (RAIB). Accessed: Nov. 18, 2019. [Online]. Available: https://www.gov.uk/government/organisations/rail-accident-investigation-branch
[60] S. Carpenter,Passenger Risk at the Platform-Train Interface. London, U.K.: Rail Safety and Standards Board, 2011.
[61] S. Zhang, C. Zhang, and Q. Yang, ‘‘Data preparation for data min-ing,’’ Appl. Artif. Intell., vol. 17, nos. 5–6, pp. 375–381, May 2003, doi:10.1080/713827180.
[62] R. Houari, A. Bounceur, M. T. Kechadi, A. K. Tari, and R. Euler, ‘‘Dimen-sionality reduction in data mining: A copula approach,’’Expert Syst. Appl., vol. 64, pp. 247–260, Dec. 2016, doi:10.1016/j.eswa.2016.07.041.
[63] M. S. Hajakbari and B. Minaei-Bidgoli, ‘‘A new scoring system for assess-ing the risk of occupational accidents: A case study usassess-ing data minassess-ing techniques with Iran’s Ministry of Labor data,’’J. Loss Prevention Process Ind., vol. 32, pp. 443–453, Nov. 2014, doi:10.1016/j.jlp.2014.10.013.
[64] N. Leavitt, ‘‘Bringing big analytics to the masses,’’ Computer, vol. 46, no. 1, pp. 20–23, Jan. 2013. [Online]. Available: https://doi. ieeecomputersociety.org/10.1109/MC.2013.9, doi:10.1109/mc.2013.9.
[65] H. Liu, Z. Liu, and D. Liu, ‘‘Application of machine learning methods in maritime safety information classification,’’ inProc. 10th Int. Conf. Adv. Comput. Intell. (ICACI), Xiamen, China, Mar. 2018, pp. 735–740, doi:10.1109/ICACI.2018.8377552.
[66] M. Chen, A. X. Zheng, J. Lloyd, M. I. Jordan, and E. Brewer, ‘‘Failure diagnosis using decision trees,’’ inProc. Int. Conf. Autonomic Comput., New York, NY, USA, May 2004, pp. 36–43, doi: 10.1109 /ICAC.2004.1301345.
[67] Y. Yuan and M. J. Shaw, ‘‘Induction of fuzzy decision trees,’’Fuzzy Sets Syst., vol. 69, no. 2, pp. 125–139, Jan. 1995, doi: 10.1016/0165-0114(94)00229-Z.
[68] M. Fredrikson, S. Jha, and T. Ristenpart, ‘‘Model inversion attacks that exploit confidence information and basic countermeasures,’’ in Proc. 22nd ACM SIGSAC Conf. Comput. Commun. Secur., Denver, CO, USA, Oct. 2015, pp. 1322–1333, doi:10.1145/2810103.2813677.
[69] H. Alawad, S. Kaewunruen, and A. Min, ‘‘Utilizing big data for enhancing passenger safety in railway stations,’’IOP Conf. Ser. Mater. Sci. Eng., vol. 603, Sep. 2019, Art. no. 052031, doi: 10.1088/1757-899X/603/5/052031.
[70] S. Kaewunruen, J. M. Sussman, and A. Matsumoto, ‘‘Grand challenges in transportation and transit systems,’’Frontiers Built Environ., vol. 2, p. 4, Feb. 2016, doi:10.3389/fbuil.2016.00004.
HAMAD ALAWAD received the bachelor’s degree in industrial engineering from King Saud University and the master’s degree in fire and safety engineering, U.K. He is currently pursuing the Ph.D. degree with the Birmingham Centre for Railway Research and Education, Univer-sity of Birmingham, U.K. His research interests include safety, machine learning, and artificial intelligence.
SAKDIRAT KAEWUNRUENreceived the Ph.D. degree in structural engineering from the Univer-sity of Wollongong, Australia. He has expertise in transport infrastructure engineering and man-agement, and successfully dealing with all stages of infrastructure life cycle and assuring safety, reliability, resilience, and sustainability of rail infrastructure systems. He is a chartered engineer. He has over 400 technical publications.