THE COLLABORATIVE RISK ASSESSMENT
ENVIRONMENT IN DISASTER MANAGEMENT
Matar Helal Alzahmi
ii
THE COLLABORATIVE RISK ASSESSMENT
ENVIRONMENT IN DISASTER MANAGEMENT
Matar Helal Alzahmi
School of the Built Environment
College of Science and Technology
University of Salford, Salford, UK
i
TABLE OF CONTENTS
List of Tables ... vi
List of Figures ... viii
Glossary of Terms and Abbreviations ... xi
Acknowledgments ... xiii
Declaration ... xiv
Abstract ... xv
Chapter 1 – Introduction ... 1
1.1 Motivation... 1
1.2 Aim and Objectives ... 5
1.3 Research Scope ... 5
1.4 The Research’s Contribution to Knowledge ... 6
1.5 Structure of the Thesis ... 7
1.6 Summary ... 8
Chapter 2 – Analysis of guideline processes & the organizational structure in disaster management ... 9
2.1 Introduction ... 9
2.2 Definition of a Disaster ... 9
2.2.1 Disaster Type ... 11
2.2.2 Hazards, Vulnerabilities and Resilience ... 13
2.2.2.1 Hazard ... 13
2.2.2.2 Vulnerability ... 14
2.2.2.3 Resilience ... 14
2.2.3 Disaster Management Definition and Cycle... 15
2.2.4 Summary ... 16
2.3 Holistic Approach to Disaster Management ... 17
2.3.1 USA Comprehensive Preparedness Guide (CPG) ... 18
2.3.1.1 Summary ... 23
2.3.2 UK Risk assessment process ... 24
2.3.2.1 Summary ... 29
2.3.3 Summary ... 30
2.4 Organizational Structures for Disaster Management ... 30
2.4.1 USA Incident Command System (ICS) ... 31
2.4.2 The Australian Inter-service Incident Management System (AIIMS) ... 34
ii
2.4.3.1 Joint Emergency Services Interoperability Programme (JESIP) ... 37
2.4.3.2 Department for Communities and Local Government (DCLG) ... 38
2.4.3.3 Local Resilience Forums’ (LRFs) Composition ... 40
2.4.3.4 Local Resilience Forums’ (LRFs) Role ... 41
2.4.4 Stakeholders ... 49
2.4.5 Summary ... 51
2.5 Analysis of a Disaster Response Exercise ... 52
2.6 Challenges to Multi-agency Collaboration ... 56
2.7 Summary ... 58
Chapter 3: Current Technology Approaches used for Supporting Disaster Management 59 3.1 Introduction ... 59
3.2 Disaster Management Systems ... 59
3.2.1 Various Technology Solutions ... 59
3.2.2 The Potential of Technology in Assessment and Preparing for Disaster ... 64
3.2.3 Current Systems ... 65
3.2.3.1 HYDRA-MINERVA System ... 65
3.2.3.2 Incident Command Administrator and Gaist Emergency ... 66
3.2.3.3 MOSAIC Software ... 66
3.2.3.4 Atlas Incident Management System (AIMS) ... 66
3.2.3.5 CLIO ... 67
3.2.3.6 Depiction Mapping Software ... 68
3.2.3.7 Geographical Information System (GIS) ... 69
3.2.4 A Comparative Summary ... 73
3.3 Limitations ... 75
3.4 Importance of Interactive Maps... 75
3.4.1 Visualisation ... 78
3.4.2 The Importance of Visualisation in Risk Assessment ... 79
3.4.3 Interactive Map Data Analysis ... 82
3.4.4 Summary ... 83
Chapter 4 - Related Theoretical Frameworks ... 84
4.1 Introduction ... 84
4.2 Description and Justification of the Activity Theory ... 84
4.2.1 The First Generation: Vygotsky’s Foundation ... 87
4.2.2 The Second Generation: Leont’ev’s General Structure of Activity ... 88
iii
4.2.5 Adaptation of the Activity Theory for Multi-agency Collaboration ... 94
4.3 Critical Thinking in Disaster Management ... 98
4.3.1 Literature Review on Critical Thinking ... 99
4.4 Team Collaboration Model ... 106
4.5 A Theoretical Framework for Facilitating Multi-agency Collaboration in Risk Assessment Activity ... 112
4.5.1 Influence of Theories & Model on Prototype Design ... 114
4.6 Summary ... 116
Chapter 5 – Research Design ... 117
5.1 Introduction ... 117
5.1.1 Definition and Discussion on Research Methodology ... 117
5.2 Research Philosophy ... 118
5.2.1 Ontology ... 121
5.2.2 Epistemology ... 121
5.2.3 Axiology ... 122
5.3 Research process ... 124
5.3.1 Theoretical Justification for Interpretivism ... 126
5.4 Research Approach, Strategy and Choice ... 127
5.5 Research Horizons and Procedures ... 130
5.6 Research Techniques ... 130
5.6.1 Research Techniques for Data Collection ... 131
5.6.1.1 Interviews as a Research Technique for Data Collection... 133
5.6.1.2 Sampling ... 135
5.6.1.2.1 Semi-structured Interviews with Senior Managers ... 137
5.6.1.3 The Questionnaire Survey as a Research Technique for Evaluation ... 139
5.6.2 Research Techniques for Data Analysis ... 139
5.6.3 Validity and Reliability ... 140
5.7 Research Ethical Considerations ... 142
5.8 Summary ... 142
Chapter 6 – User and system requirements ... 144
6.1 Introduction ... 144
6.2 Method Used to Collect Data ... 144
6.3 Process of Data Collection ... 144
6.4 Questionnaire Design ... 145
6.5 Analysis of the Data ... 146
6.6 User requirements ... 176
iv
Chapter 7 – Design and implementation of the collaborative risk assessment environment
... 180
7.1 Introduction ... 180
7.2 System Architecture Frameworks ... 180
7.2.1 TOGAF & COA ... 181
7.3 Conceptual Framework Design ... 182
7.3.1 Team Member View ... 182
7.3.2 Information View ... 184
7.3.3 Process/activity view ... 185
7.3.4 Data visualisation view ... 187
7.3.4.1 Mapping Space (Interface) ... 187
7.3.4.2 Contextual Menu ... 194
7.3.5 Use of Views in Supporting Risk Assessment ... 200
7.4 Implementation of the Risk Assessment Environment ... 213
7.4.1 Design of the Platform ... 213
7.5 Summary ... 221
Chapter 8 – System Evaluation Methodology ... 222
8.1 Introduction ... 222
8.2 Evaluation Methodology ... 222
8.2.1 What to Assess ... 223
8.2.2 Assessment Criteria ... 227
8.2.3 Assessment Setting ... 227
8.2.3.1 Experimental Platform ... 227
8.2.3.2 Pilot Study ... 228
8.2.3.3 Think Lab Setting ... 228
8.2.3.4 Subjects ... 229
8.2.4 Data Collection Methods ... 229
8.3 Procedure of the Experiment ... 230
8.3.1 Subject Briefing ... 230
8.3.2 Demonstration of the Capability of the System ... 231
8.3.3 Appointment of a Chairperson and Description of the Flood Scenario ... 236
8.3.4 Discussion on the perceived effectiveness of the Interaction Map Prototype .. 238
8.4 Summary ... 239
Chapter 9 – Analysis of the Evaluation Results ... 240
9.1 Introduction ... 240
v
9.2.1 Contextualization Average Result ... 248
9.3 Perceived effectiveness of the potential of the Interactive Map for strengthening the collaboration between multi-agenciess. ... 258
9.4 Summary ... 260
Chapter 10 – Discussion ... 262
10.1 Introduction ... 262
10.2 Contextualization of Social Information ... 263
10.3 Contextualization of Local Infrastructure... 264
10.4 Contextualization of the Natural Environment ... 265
10.5 Contextualization of Hazardous Sites ... 265
10.6 Hazard Review ... 266
10.7 Risk Analysis ... 266
10.8 Risk Evaluation ... 267
10.9 Risk Treatment ... 267
10.10 Monitoring and Reviewing ... 268
10.11 Interactive Map for Successful Interactive and Collaborative Multi-agency Decision Making ... 269
10.12 Importance of Interactive Maps for Risk Assessment ... 270
10.13 Importance of Data: Choices, Visualisation, Security and Updating ... 271
10.14 Use of an Interactive Map Before and After Disaster ... 273
10.15 Evaluation of the Research Approach and the Validity of Data Collection in Relation to the Aim of the Research ... 274
10.16 Evaluation in Relation to the Use and Relevance of the theories and Models Used 275 10.17 Limitations ... 277
10.18 Summary ... 278
Chapter 11 – Conclusion ... 281
11.1 Introduction ... 281
11.2 Thesis’ Summary ... 281
11.3 Research Assessment... 281
11.4 Research Contributions ... 285
11.5 Future Research ... 286
11.6 Summary ... 287
References ... 288
Appendix A ... 314
vi
List of Tables
Table 2. 1: Disaster types (Shaluf and Ahmadun, 2006; Shaluf, 2007) 12 Table 2. 2: A brief explanation of the various departments within ICS system (FEMA,
2008). 32
Table 2. 3: A brief explanation of the various departments within AIIMS (Council,
2005). 35
Table 3. 1: Brief summary of relevant technologies available for disaster
management ... 60
Table 3. 2: The functional requirements needed for handling various disaster types ... 64
Table 4. 1: Summary of levels of contradiction in activity systems (Engeström, 1997) ... 92
Table 4. 2: Description of the nodes within an activity system ... 94
Table 4. 3: Scientific thinking (Paul and Elder, 2005) ... 101
Table 5. 1: The differences between the positivist and interpretive research approaches (Saunders et al., 2012) ... 120
Table 5. 2: Six major sources of data collection techniques (Source: Yin, 2009) ... 131
Table 5. 3: profile of senior managers who undertook the semi-structured interviews ... 137
Table 6. 1: Defining the characteristics of the collaborative environment for risk assessment in disaster management that are required within an interactive map 177 Table 7. 1: A summary of the team members’ profiles including roles and responsibilities ... 183
Table 7. 3: The type of information identified and the visualisation metaphors used ... 191
Table 7. 4: The design of the contextual menu for the main themes, categories and subcategories ... 197
Table 7. 5: Social contextualisation: objectives and visualisation medium ... 200
Table 7. 6: Natural environment contextualization: objectives and visualisation medium ... 204
Table 7. 7: Local infrastructure contextualization: objectives and visualisation medium ... 205
Table 7. 8: Hazards sites’ contextualization: objectives and visualisation medium 207 Table 7. 9: Combination of contextualization (social, environmental, infrastructure, hazardous sites): objectives and visualisation medium ... 208
Table 7. 10: Hazard review: objectives and visualisation medium ... 210
Table 7. 11: Risk analysis: objectives and visualisation medium ... 211
vii
Table 7. 13: Risk treatment: objectives and visualisation medium ... 212 Table 7. 14: Monitoring and reviewing: objectives and visualisation medium ... 213
Table 8. 1: A summary of the type of information demonstrated ... 232
viii
List of Figures
Figure1. 1: Likely engagement of Central Government in emergencies occurring in
England (Cabinet Office, 2013)... 6
Figure 2. 1: The elements that constitute disasters. Source: CBSE (2006). ... 10
Figure 2. 2: The disaster management cycle (Alexander, 2002) ... 16
Figure 2. 3: The planning process (Fugate, 2010) ... 18
Figure 2. 4: The six-step risk assessment process (Cabinet Office 2012, Local responder risk assessment duty of Emergency Preparedness). ... 24
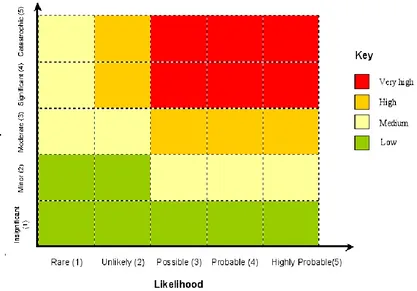
Figure 2. 5: Risk rating matrix (Cabinet Office 2012, Local responder risk assessment duty of Emergency Preparedness). ... 27
Figure 2. 6: ICS organizational structure (Source: FEMA, 2013) ... 32
Figure 2. 7: Functional structure of AIIMS (Source: The Australasian Inter-Service Management System, 2004) ... 35
Figure 2. 8: England’s 38 Local Resilience Forums (LRFs) ... 41
Figure 2. 9: Flow chart of the system used in England & Wales for emergency planning and response ... 48
Figure 3. 1: Components of a disaster management system ... 63
Figure 3. 2: Stillaguamish River flooded in January 2009 in US as shown by the Depiction Mapping Software (Source: Seattle, WA (PRWEB), 2009) ... 69
Figure 3. 3: Different GIS information layers, gathered together. (Source: National Coastal Data Development Centre (NCDDC), National Oceanic and Atmospheric Administration (NOAA), USA) ... 70
Figure 3. 4: An example of a flooding map of Nagapattinam, India (as shown by WAPMERR) (Marchuk et al., 2012). ... 71
Figure 3. 5: Baseline configuration of the ArcGIS platform that works with a common emergency management organization structure and mission (Esri, 2012). ... 72
Figure 3. 6: 3D Flood Simulation of Brisbane 2011.(Source: GISCafe, 2011, AAM Modelling Aids Brisbane Flood Crisis). ... 77
Figure 4. 1: The Activity Theory (Engeström, 2001). ... 89
Figure 4. 2: The three levels of activity (Leont’ev, 1981). ... 89
Figure 4. 3: The third generation of activity theory (Engeström, 2001) ... 91
Figure 4. 4: Activity tension and contradiction (Engeström, 1987) ... 93
Figure 4. 5: Activity model for the senior commanders of agencies looking at risk assessment ... 95
Figure 4. 6: Example of multiple activity models for the senior commanders of agencies looking at risk assessment. ... 96
Figure 4. 7: Process model of critical thinking (Fischer et al., 2009) ... 103
Figure 4. 8: Collaboration model of software development (Kusumasari et al., 2011) ... 107
ix
Figure 4. 10: A framework to illustrate the communication and the integration of
risk assessment activities in co-located multi-agency meetings. ... 111
Figure 4. 11: A theoretical framework for facilitating multi-agency collaboration in risk assessment activity ... 113
Figure 5. 1: Research Onion (Source: Saunders et al., 2009) ... 118
Figure 5. 2: Research’s positioning within philosophy i.e., within the ontology, epistemology and axiology stances... 123
Figure 6. 1: The Six-step risk assessment process (Cabinet Office 2012, Local responder risk assessment duty of Emergency Preparedness). ... 145
Figure 6. 2: Respondents’ rating on the contextualisation of the social information ... 147
Figure 6. 3: Respondents’ rating on the contextualisation of the local environment ... 151
Figure 6. 4: Respondents’ rating on the contextualisation of the local infrastructure ... 154
Figure 6. 5: Respondents’ rating on the contextualisation of the hazardous sites ... 158
Figure 6. 6: Respondents’ rating on the contextualisation of the combination of risks (social, environmental, infrastructure, hazardous sites) ... 161
Figure 6. 7: Respondents’ rating, utilizing past experience, on the usefulness of an interactive map in the Hazard Review step ... 164
Figure 6. 8: Respondents’ rating on the use of research data in the interactive map in the Hazard Review step ... 165
Figure 6. 9: Respondents’ rating on the use of an interactive map, integrated with hazard information in the Hazard Review step ... 167
Figure 6. 10: Respondents’ rating on the use of an interactive map to present the local risks’ context in risk analysis step ... 168
Figure 6. 11: Respondents’ rating on the use of an interactive map to present cascading effects in the risk analysis step ... 170
Figure 6. 12: Respondents’ rating on the use of risks’ ratings on an interactive map in the Risk Evaluation step ... 172
Figure 6. 13: Respondents’ rating on the use of the visualisation of the capabilities required and the capabilities in place on an interactive map in the risk treatment step ... 173
Figure 6. 14: Respondents’ rating on the importance of intelligence collected from Step 1 to Step 5 within an interactive map in an integrated form in the Monitoring and Reviewing step ... 175
Figure 7. 1: The conceptual framework views ... 182
Figure 7. 2: The six-step risk assessment process ... 185
Figure 7. 3: Mapping space & contextual menu ... 187
x
Figure 7. 5: Flood area layer ... 215
Figure 7. 6: Social information: demographics layer ... 215
Figure 7. 7: Social information: community layer ... 216
Figure 7. 8: Social information: mobility needs’ layer ... 216
Figure 7. 9: Infrastructure information: utility services’ layer ... 217
Figure 7. 10: Infrastructure information: transport layer ... 218
Figure 7. 11: Infrastructure information: building layer ... 218
Figure 7. 12: Hazardous sites’ layer ... 219
Figure 7. 13: Resources’ location layer ... 220
Figure 7. 14: User defined data layer ... 220
Figure 8. 1: Overview of the evaluation methodology ... 223
Figure 8. 2: The Think pod ... 229
Figure 8. 3: A screen shot of the flood scenario within the interactive map ... 237
Figure 9. 1: Clustered columns showing the distribution from the evaluation for the Visualisation of Social Information on the interactive map ... 242
Figure 9. 2: Clustered columns showing the distribution from the evaluation for the Visualisation of Local Infrastructure on an interactive map ... 244
Figure 9. 3: Clustered columns showing the distribution from the evaluation for the Visualisation of the Natural Environment on an interactive map ... 246
Figure 9. 4: Clustered columns showing the distribution from the evaluation for the Visualisation of Hazardous Sites on an interactive map... 248
Figure 9. 5: Clustered columns showing the distribution from the evaluation for the Contextualization of local risk evaluation ... 249
Figure 9. 6: Clustered columns showing the distribution from the evaluation of the usefulness for a Hazard Review of an interactive map ... 251
Figure 9. 7: Clustered columns showing the distribution from the evaluation of the effectiveness for Risk Analysis of an interactive map ... 252
Figure 9. 8: Clustered columns showing the distribution from the evaluation on the effectiveness for Risk Evaluation of an interactive map ... 254
Figure 9. 9: Clustered columns showing the distribution from the evaluation on the effectiveness for Risk Treatmentof an interactive map ... 256
Figure 9. 10: Clustered columns showing the distribution from the evaluation on the effectiveness for Monitoring and Reviewing of an interactive map ... 257
xi
Glossary of Terms and Abbreviations
AIC Ambulance Incident Commander
AIMS Atlas Incident Management System
AIIMS The Australian Inter-service Incident Management System
AS/NZS ISO Standards Australia /Standards New Zealand Standard Committee, ISO 31000:2009
CAD Computer-Aided Design
CBSE Central Board of Secondary Education
CCA The Civil Contingency Act
CCS Civil Contingencies’ Secretariat
CCWM Co-spaces Collaborative Working Model
CHT Cultural Historical Theory
COA Collaboration Oriented Architectures
COMAH Control of Major Accident Hazards
CPG Comprehensive Preparedness Guide
CPSAT Civil Protection Self-Assessment Tool
CRED Centre for Research on the Epidemiology of Disasters
CRIP Commonly Recognized Information Picture
CRR Community Risk Register
CSCW Computer-Supported Collaborative Work
CT Critical thinking
DCLG Department of Communities and Local Government
EA Environment Agency
EA Enterprise Architecture
EM Emergency Management
FEAF Federal Enterprise Architecture Framework
FEMA The Federal Emergency Management Agency
GeoVEs Geospatial Virtual Environments
GIS Geographical Information System
HCI Human-Computer Interaction
HITS High Integrity Telecommunications System
HMDs Head-Mounted Displays
HPA Health Protection Agency
xii
IAP Incident Action Plan
ICS Incident Command System
ICT Information Communication Technologies
IEM Integrated Emergency Management
IFRC International Federation of Red Cross and Red Crescent Societies
IT Information Technology
JESIP Joint Emergency Services Interoperability Programme
LAs Local Authorities
LRFs Local Resilience Forums
MCA Maritime and Coastguard Agency
NHS National Health Service
NIMS National Incident Management System
NFPA National Fire Protection Association
NRE National Resilience Extranet
PCTs Primary Care Trusts
RCG Recovery Co-ordinating Group
RED Resilience and Emergencies Division
SCG Strategic Co-ordinating Group
SHAs Strategic Health Authorities
TCG Tactical Co-ordination Group
TOGAF The Open Group Architecture Framework
UN-ISDR United Nations - International Strategy for Disaster Reduction
VR Virtual Reality
WAPMERR World Agency of Planetary Monitoring and Earthquake Risk Reduction
3D Three Dimensional
xiii
Acknowledgments
First of all praise and thanks be to Almighty Allah. Then I would like to express my
sincere gratitude and appreciation to my supervisor, Professor Terrence Fernando for his
constant support, great cooperation, guidance and continued encouragement during all the
period of this research. I would like to thank my co-supervisor Dr Bingunath Ingirige for
his encouragement and valuable comments. I would like to extend my gratitude to Kathy
Oldham, Head of Civil Contingencies and Resilience Unit Association of Greater
Manchester Authorities (AGMA), and the experts in the Greater Manchester Local
Resilience Forum (GMLRF).
I am greatly indebted to the Excellency Juma Ahmed Al Bawardi Al Falasi and
Excellency Obaid Juma Al Shamsi who set me on this path of knowledge acquisition and
self-development in the United Kingdom (UK). Thank you very much for giving me the
opportunity to contribute to the advancement of our country, United Arab Emirates
(UAE).
A great “Thank You” to my colleagues in the Thinklab: the help of Hanneke van Dijk in
proof reading my thesis and her disposition; project manager Simon Campion for the
discussions and comments during this study; Dr. May Bassanino, Dr. Shamaila Iram for
their help and support; Carla Kocsis, Dulcidio Coelho, Dr. Georgios Kapogiannis,
Abdulaziz Alkandari for their good personalities and friendly natures; Dr. Kuo-Cheng
Wu and Zihao Tan for their technical support.
A special tribute and appreciation must go to my wife for her understanding, tolerance,
and moral support throughout my study. Thanks to my daughters and my sons for their
support and patience during the period of this research. My sincere gratitude is expressed
to my brothers Mohamed, Salem and Rashid for their support and encouragement during
my study. Also special thanks to my sisters for their support and their prayers for me to
succeed. Finally, my special gratitude and thanks to my mother for everything she has
xiv
Declaration
I declare that the research contained in this thesis was solely carried out by me. It has not
been previously submitted to this or any other institute for the award of a degree or any
xv
Abstract
In the past century the occurrence of natural disasters and man-made disasters have
steadily increased with a significant loss of life, damage caused to infrastructure and
property, and destruction of the environment. There is much evidence that natural
disasters are growing on a global level. Dealing with disasters demand the involvement of
a range of agencies collaborating and making collaborative decision. This research has
identified the need for a collaborative platform to bring together a variety of information
to enable multi-agencies to prepare for disasters and to enhance the resilience of cities.
Risk assessment is a crucial aspect within the activities of multi-agencies. Risk
assessment enhances emergency planning which can then be tested by detailed appraisals
and exercises. Whenever risk assessment is updated, plans are revised and additional tests
are carried out. Risk assessment helps multi-agency planners decide what resource
requirements they need and what multi-agency activities need to be planned
collaboratively in order to prepare for disaster. The aim of this research is to investigate
the nature of an interactive map that can enhance multi-agency team collaboration in the
risk assessment process in disaster management.
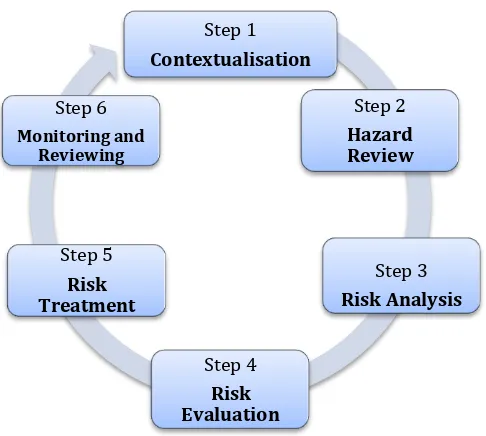
This research uses the six-step risk assessment process used in Australia and New
Zealand which is widely recognized as being good practice. These steps are
Contextualization, Hazard Review, Risk Analysis, Risk Evaluation, Risk Treatment and
Monitoring and Reviewing (Standards Australia/Standards New Zealand Standard
Committee, AS/NZS ISO 31000:2009).
In this research, the characteristics of a suitable interactive map for risk assessment was
defined in collaboration with the senior practitioners within a multi-agency team in the
UK. Semi-structured interviews were conducted with the senior managers of Category 1
responders in The Greater Manchester Local Resilience Forum (GMLRF) to capture the
requirements for a multi-agency collaboration platform. The outcome of these interviews
were used to capture the characteristics and develop the a prototype of the interactive
map that can support risk assessment. Once implemented, the validation of the interactive
map prototype was conducted involving senior practitioners of stakeholders in the
GMLRF development group. The experiment was held in the THINKpod in ThinkLab, at
the University of Salford. A total of 23 senior practitioners took part in the evaluation
experiment. After a demonstration of a scenario and using the interactive map, the
xvi
featured range of open, closed and rating scale questions. These questionnaires were
designed to evaluate the perceived effectiveness and impact of the interactive map on
strengthening collaboration among the multi-agency teams during risk assessment. The
outcome of the evaluation shows a good level of satisfaction among the practitioners. The
overall result suggests that the professionals view the interactive map as a good platform
1
Chapter 1 – Introduction
1.1Motivation
Over the past century the occurrence of natural disasters and man-made disasters has
steadily increased with a significant loss of life, and destruction of the environment and
infrastructure. Disasters appear to be increasing in both the rate of occurrence and in
intensity (Sahani and Ariyabandu, 2003; Moe et al., 2007). As indicated by Warren
(2010), there is much evidence that natural disasters are growing on a global level. In
contrast to the 73 disasters reported during 1900 to 1909, 2,788 disasters occurred during
2000 to 2005 (Kusumasari et al., 2010).
Natural disasters can impact on regions’ or countries’ economies (e.g. destruction of
buildings, roads, infrastructure, farms, loss of income, loss of jobs, weakening markets).
As indicated by Van Westen (2013), there is a need to understand the problems that are
triggered by disasters and the consequences of them, to study risk assessment and to
prepare for disasters before they occur in order to mitigate and reduce the impact of
disasters on people, property and the economy and to improve the response to each type
of disaster. Such a need has given the impetus to collate and understand local risk levels
and the vulnerability of cities through a technology platform that can integrate disaster
related intelligence to support interactive risk assessment involving multi-agencies
(Kolbe, 2005; Marincioni, 2007).
As described in the UK Emergency Preparedness Report (Guidance on Part 1 of the Civil
Contingency Act 2004) from the Cabinet Office (2013c) Integrated Emergency
Management (IEM) is a comprehensive approach to the prevention and management of
emergencies which views these activities as a whole. IEM is made up of six steps.
Emergency Preparedness relates to the first four steps which are anticipation, assessment,
prevention and preparation, while Emergency Response and Recovery covers the final
two steps which are response and recovery. The purpose of IEM is to increase and
maintain resilience in order to meet a variety of potential challenges. A vital aspect of
IEM is the need for multi-agency collaboration so that there is a common understanding
across all agencies. In order to meet this need, this research focuses on a collaborative
2
support other phases such as anticipation, prevention, preparation, response and recovery
management in the future.
The Emergency Preparedness Report from the Cabinet Office (2013c) also suggests that
risk assessment should form the foundation for emergency planning and business
continuity plans which can then be tested by detailed appraisals and exercises. When risk
assessment is updated, plans are revised and additional tests are carried out. Risk
assessment, therefore, has a clear knock-on effect on the subsequent steps in the IEM
process: preparation and prevention. Risk assessment helps multi-agency planners decide
what resource requirements they need and what multi-agency activities need to be
planned collaboratively in order to prepare for disaster. In order to make sure that plans
are appropriate for the risks in an area, such plans must be created by a risk assessment
process which considers, evaluates and then prioritizes local hazards and threats and the
risks that come with them. Technology plays an important role here as computer software
modelling of this information can provide significant assistance in assessing risk (Gordon,
2002; Federal Emergency Management Agency, 2008).
Overall, the U.S. Department of Health and Human Services (2002) suggests that risk
assessment is a vital component in the preparedness step because it increases the
awareness of risks and thus enables superior mitigation and preparation. Moreover, it is
argued that if a risk assessment is to be successful, then it must be understood and
communicated properly. With this point established, the importance of risk assessment is
clear. In short, preparedness is only as good as the risk assessment that produces the
preparedness.
Risk assessment consists of multiple steps. This research uses the six-step risk assessment
process based on the standard used in Australia and New Zealand which is widely
recognized as being good practice. These steps are Contextualization, Hazard Review,
Risk Analysis, Risk Evaluation, Risk Treatment and Monitoring and Reviewing
(Standards Australia/Standards New Zealand Standard Committee, AS/NZS ISO
31000:2009).
The first step in this process, contextualization, is vital. It is important to give the many
agencies involved a full picture of the characteristics of the local area and the local risk
environment, such as an overview contextualization of social intelligence (such as the
3
distributions; the identification of vulnerable groups; the level of community resilience;
an overview of the local environment and an understanding of local vulnerabilities; the
characteristics of space (urban, rural, mixed); an overview of scientific sites; an overview
of the local infrastructure (transport, utilities, business); an overview of the critical supply
network and critical services (telecommunication hubs, health, finance, etc.) and an
overview of potential hazardous sites (and their relationships with communities) or
sensitive environmental sites (FEMA, 2010). This type of information can help the
various agencies establish a collective understanding of the local risk level and make
better decisions.
As noted, risk assessment supports multi-agency teams in achieving preparedness. As a
result, collaboration in risk assessment is crucial. It has been argued by many scholars
that the requirement for collaboration between agencies in disaster management is clearly
an essential element in creating a more accessible and transparent service delivery system
in any future disasters (GAO, 2002; McEntire, 2008; Kapucu, & Garayev, 2011).
Williams (2002) identified collaboration as a process of give and take that provides space
for the construction of solutions that no individual actor could achieve alone.
Collaboration is the only practical method for dealing with the complex and interrelated
problems that cross administrative and jurisdictional boundaries. Where collaboration
does not occur, the result can be delays or inefficiencies, inconsistencies, or even
ineffective decisions made at a crucial time. Indeed the reason for developing
collaboration in the risk assessment process is to allow agencies to move towards a
common understanding of the local risks and develop a common risk mitigation plan.
Many researchers have identified the need for a collaborative platform for multi-agencies
to prepare for disasters. The need for a platform that can enhance collaboration and
collaborative decision-making concerning risk assessment has been argued for in the
literature (Van Westen, 2013). However, little research is evident on the exploration of
the nature of such a collaborative platform (Van Westen, 2013). Fleischauer et al. (2006)
noted that spatial mapping is often not implemented to its full potential. There are many
possible reasons for this lack of technological support. Little research has been done on
how best to incorporate cascading effects into risk assessment mapping and this suggests
that more work needs to be done on how multiple hazards can be mapped in risk
assessment. It is also argued that, in the main, advances in technology are not translated
4
complicated nature of the interactions between a user and the platform they are using
(Van Westen, 2013).
Past research has concluded that a map system has benefits in the risk assessment process
because it encourages proactive rather than just reactive thinking. Alexander et al. (2011)
found that such a map needs to be interactive and allow the user to manipulate scenarios.
The system needs to enable communication, the sharing of professional knowledge and
be user-friendly. However, they suggested that more research is required into the kind of
information and the level of information that can be included in such a platform (Van
Westen, 2013; MacEachren, 2005). The main purpose of this research is to investigate the
system characteristics of a collaborative risk assessment environment where agencies can
work collaboratively in order to enable participants to visualise and analyse various risks
through an interactive map environment.
According to UN-Habitat (2007), risk assessment can support decision-making and
increase risk awareness among various agencies. Furthermore, the visualisation of
existing and potential hazards, vulnerabilities, capacities and risks has a vital impact on
the work of agencies, more so than traditional methods (Martin et al., 1997; Husdal,
2001). Therefore, there is an assumption that, by adopting a visualisation approach,
agencies can perceive facts and evaluate various risks through visualisation techniques.
Interactive visualisation in the risk assessment process can help agencies explore
high-risk areas, assess the location of vulnerable people and vulnerable areas, and view the
capacities and resources available for those at risk in order to lessen their vulnerability
(Whiteman, 1998; Rashed and Weeks, 2002; Lagorio, 2001; Kraak, 2006; UN-Habitat,
2007). Furthermore, the creation of different visual scenarios can improve agencies’
collective understanding of risk levels and of their capacities. Visualisation can also be
used as a common language to facilitate communication amongst the various agencies in
the risk assessment environment. Interactive visualisation is widely considered as an
effective and preferable medium for communication compared to other established
methods, such as paper drawings or static images. Three-dimensional visualisation
increases perception and enhances the effectiveness of multi-agency decisions (Christie,
1994; Kolbe et al., 2005; Zlatanova, 2008).
The above discussion indicates that a collaborative environment is necessary to allow
agencies to communicate and consult in order to have a common understanding of risks.
5
so that the agencies coming from different backgrounds can easily understand the subject
under view. An interactive map could be used as the basis for risk exploration during the
risk assessment process (Slocum et al., 2005). However, the nature of an interactive map
that can support collaborative risks’ assessment by agencies is still not well understood.
Therefore, the purpose of this research is to address the following research question:
What are the keys functional characteristics of an interactive map that can enhance
multi-agency team collaboration in the risk assessment process in disaster management? The
research plans to identify the characteristics of an interactive map that can allow agencies
to communicate their ideas, exchange information and engage in visual thinking.
1.2Aim and Objectives
Aim
The aim of this research is to investigate the nature of an interactive map that can
enhance multi-agency team collaboration in the risk assessment process in disaster
management.
Objectives:
1. To analyse the risk assessment process and capture key stakeholders’ views in
risk assessment processes.
2. To identify the key functional characteristics of an interactive map that can
enhance multi-agency teams’ collaboration in the risk assessment process in
disaster management.
3. To design the look and feel of an interactive map that can enhance multi-agency
team collaboration in risk assessment processes in disaster management. This
design specification will be used to implement a prototype of the interactive map,
with the support of a skilled IT person.
4. To evaluate whether the enhanced features of an interactive map has the potential
to strengthen collaboration between multi-agency teams in risk assessment
processes.
1.3Research Scope
Collaboration is a crucial central part of IEM in the UK. Many policies and frameworks
have been adopted to support multi-agency collaboration, risk assessment and
preparedness in response to disasters and the guidance followed in the UK demands
6
the focus of this research is on the local level and on the work of the local resilience
forums (LRFs), taking the Greater Manchester Local Resilience Forum as an example.
LRFs are groups made up of various response agencies and, as such, are the mechanism
for multi-agency collaboration in the UK. The Greater Manchester Local Resilience
Forum is ideal for the study of the effectiveness of implementing the interactive map
prototype because of the effective collaborative working undertaken in the Forum; this
can be further enhanced through the interactive map.
Figure1.1: Likely engagement of Central Government in emergencies occurring in England (Cabinet Office, 2013)
As shown in Figure 1.1, there are overlaps of interaction in the response for single scene
local incidents up until incidents that require national coverage and which are
catastrophic in nature. The researcher is investigating interaction, engagement and
response arrangement between incidents, scene, impact, communication and different
organisations at a local level and this further justifies the rationale for selecting Greater
Manchester Local Resilience Forum.
1.4The Research’s Contribution to Knowledge
This research contributes to the new knowledge on collaborative working within disaster
management. It specifically focuses on enhancing knowledge by the application of
interactive maps in supporting the six-step risk assessment process and multi-agency
collaboration. This research has conducted an in-depth analysis to identify the key
stakeholders involved in the risk assessment process as well as the information required This is the focus of
7
to and analyse in order to create a common understanding of the local risks by conducting
a thorough risk analysis. This knowledge has been extracted from secondary data as well
as primary data through interview of the Category 1 responders. This in-depth knowledge
has been used to establish a viable interactive map that can visually present the risks that
is required in the six-step risk assessment process. The overall construction of the
interactive map is also a contribution to knowledge due to its design using different
system views such as Team Member view, Information view, Process/Activity view and
Data Visualisation view.
Finally this research collected and analysed feedback from the Greater Manchester Local Resilience Forum development group to capture “perceived effectiveness” of such an interactive map in supporting the risk assessment process as well as its potential for strengthening the collaboration between multi-agencies. Specifically, this research has contributed to knowledge as follows.
The identification of functional characteristics on interactive map this knowledge
could be used by the researcher community to develop different type of
interactive maps using other technology such as virtual reality (VR) to support
collaborative risk assessment involving key agencies in a city.
The research conducted in this research has lead to the implementation and
demonstration of an interactive map. The implemented interactive map illustration
has the data required for the risk assessment could be combined, visualized and
manipulated to build up a holistic view of local risk and help multi-agency to
engage in decision during various stage of the risk assessment process.
Data an “perceived effectiveness” of an interactive map from category 1
responder in supporting the six-step risk assessment process as well as
multi-agency collaboration. This contribution gives confidence to the research
community that the outcome is not just hypothetical but has been valid by the
practitioners who are engaged in risk assessment in a major city.
1.5Structure of the Thesis
This thesis is structured into the following chapters. Chapter 1 generally introduces the
research’s motivation and aim and objectives. It also presents the contribution to
knowledge made by this research. The literature review is presented in Chapter 2 and
8
organisational structure while Chapter 3 reviews various technological solutions for
disaster management and the importance of an interactive map for risk assessment. The
technologies that can provide multi-agency teams with an environment for the exchange
of information, scenarios’ presentation and a natural interface to present their ideas for
risk assessment are also discussed in this chapter. Chapter 4 provides a theoretical
foundation for this research, with investigations into the Activity Theory, Critical
Thinking, models of team collaboration and a theoretical framework for this study.
Chapter 5 provides detailed information on the research design used in this thesis. The
chapter is structured under the following major headings: research philosophy, research
approach and research techniques. Chapter 6 presents the outcome of the interviews
conducted to identify the user requirements for the interactive map. Chapter 7 describes
the possibilities for the design of the system and the conceptual framework of the design
and the implementation of the system. Chapter 8 describes the evaluation of the
interactive map prototype in order to test its ability to support collaboration and to
enhancing multi-agency teams’ risk assessment process. After this prototype was defined,
it was necessary to provide a methodology for the evaluation of the system, which is
described in Chapter 8. Chapter 9 presents the evaluation results collected during the
evaluation experiment of the interactive map prototype, while Chapter 10 discusses the
findings and their implications in reference to the literature. It also presents the
limitations of this research. Finally, Chapter 11 presents an overall conclusion to this
research and the extent to which it has achieved its aims and objectives and gives
recommendations for future research in this field.
1.6Summary
This chapter has described the scope of this research. It introduces the motivations for
this research and the aim and objectives. Also, the structure of the thesis is outlined. The
next chapter presents the background to disaster management cycles, the good practices
undertaken by holistic approaches and the organizational structure of those organisations
9
Chapter 2 – Analysis of guideline processes & the organizational
structure in disaster management
2.1Introduction
Throughout the past century the occurrences of natural and man-made disasters have
steadily increased. With significant loss of life, damage to infrastructure and property and
destruction of the environment, they appear to be increasing in both the rate of occurrence
and intensity (Sahani and Ariyabandu, 2003). Indeed, there is significant evidence of the
growth of natural disasters on a global level: for instance, in the years 1900 to 1909
natural disasters occurred 73 times, whereas from 2000 to 2005 this number increased to
2,788 (Kusumasari et al., 2010). As stated by Guha-Sapir et al. (2011) the number of
victims increased to 232 million in the period 2001–2010, with most of the incidents
caused by hydrological disasters.
2.2 Definition of a Disaster
According to Shaluf et al. (2003), there are many different definitions for a disaster but
none of them are universally accepted yet. The reason that disasters are defined
differently is because of the system by which they are explained. As indicated by
Siriwardena et al. (2007), definitions of a disaster are based on technical, sociological,
political and medical systems. Moreover, Eshgi and Larson (2008) stated that the
definition of a disaster could vary based on the geographic, economic and political
situations of disaster-prone countries. Disasters occur as the result of a combination of
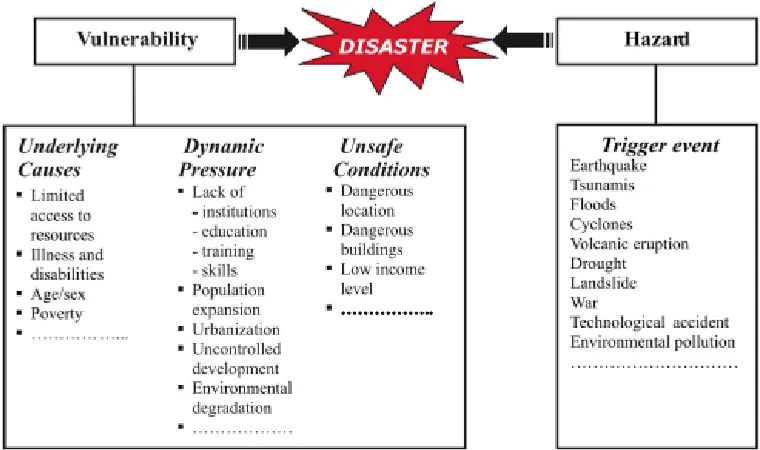
hazards, vulnerabilities and a lack of measures. Figure 2. 1 shows the elements that
10
Figure 2. 1: The elements that constitute disasters. Source: CBSE (2006).
As seen in Figure 2.1, hazards constitute events that trigger disaster when vulnerability
exists. According to authors such as Coppola (2007), “hazard is an action, event or object
that maintains a positive likelihood of affecting man, or possibly has a consequence that
may adversely affect man’s existence”. This indicate that the trigger events listed in
Figure 2.1 (such as earthquakes, volcanic eruptions, landslides) will remain hazards with
the potential to cause harm, until they interact with underlying causes, dynamic pressure
and unsafe conditions (such as vulnerability) and then disaster will occur. This is perhaps
why one of the most utilised definitions used in the area of disaster management is
derived from the United Nations - International Strategy for Disaster Reduction
(UN-ISDR). UN-ISDR (2009) states that a disaster is “a serious disruption of the function of
society, causing widespread human or environmental losses which exceed the ability of
the affected society to cope using only its own resources”. Parker (1992) also reviewed
the subject area of disasters and described a disaster as “an unusual natural or man-made
event, including an event caused by failure of technological systems, which temporarily
overwhelms the response capacity of human communities, groups of individuals or
natural environments and which causes massive damage, economic loss, disruption,
injury, and/or loss of life”.
In addition, Haigh and Amaratunga (2010) stated that a disaster is an exceptional event
with overwhelming loss of life and property. While all these definitions on disaster focus
11
dynamic or manner of occurrence. According to Kelman and Pooley (2004) and Shaluf
and Ahmadun (2006), disasters are sudden events which bring serious disruption to
society with massive human, material and environmental losses which go beyond the
capacity of the affected society to cope with using its own resources. Although the
definition by Kelman and Pooley (2004) also emphasised the impact of disaster, the
emphasis on the “sudden” occurrence of events that lead to serious disruption within
society indicate the unexpected nature of what a disaster is. Therefore, the disaster
context connotes an unanticipated event and occurrence wherein people are unaware of
the time it will occur. While the sudden nature, impacts and causes of disaster will
continue to be debated, the United Nations Environmental Programme (UNEP-APELL,
2003) has created the Centre for Research on the Epidemiology of Disasters (CRED) and
associated websites to define disasters and record them within databases. CRED requires
that, for any event to be recorded as a disaster in their databases, at least one of the
following standards have to be achieved:
Ten or more people reported killed.
One hundred people reported affected.
A call for international assistance.
A declaration of a state of emergency.
These criteria help to clarify which data is recorded by CRED. They, however, fail in
ensuring that disaster or any event that causes serious disruption within a society are well
managed and their impacts prevented. This gap between the various definitions of
disaster and the criteria for what constitutes a disaster emphasises the importance of this
research which aims to investigate the nature of an interactive map that can enhance
multi-agency team collaboration in the risk assessment process in disaster management.
However, in order to do this, it is important to understand the types of disaster and their
classifications so that assessing their risks can be better managed.
2.2.1 Disaster Type
As with the differences in defining a disaster, scholars classify disasters differently.
According to Shaluf et al. (2003) and the International Federation of Red Cross and Red
Crescent Societies (IFRC, 2012), the classification of a disaster depends on the cause of
12
Shaluf (2007) have added a third type of disaster, namely a hybrid disaster that is caused
by a combination of natural and man-made disasters. More detail is given in Table 2. 1.
The first column indicates disaster type, the second column the sub-disaster name and the
[image:30.595.85.519.175.762.2]third column the name of the disaster.
Table 2. 1: Disaster types (Shaluf and Ahmadun, 2006; Shaluf, 2007)
Disaster type
Sub-disaster name Name of disaster
Natural Natural phenomena beneath the earth’s surface
Earthquakes.
Tsunamis.
Volcanic eruptions.
Topographical phenomena Landslides.
Avalanches.
Meteorological/hydrological phenomena
Windstorms (cyclones, typhoons, hurricanes) tornadoes, hailstorms and snowstorms, sea surges, floods, droughts, heat waves/cold waves.
Biological phenomena infestations Infestations: such as locust swarms, mealy bug. Epidemics: such as cholera, dengue, ebola, malaria, measles, meningitis, yellow fever, HIV/AIDS, tuberculosis.
Man-made Socio-technical technological disasters
Fire explosions: such as munitions’ explosions, chemical explosions, nuclear explosions, mine explosions.
Leakage.
Release of toxic pollutions (pollution, acid rain, chemical pollution, atmospheric pollution).
Structural collapse of physical assets.
Transportation disasters Air disasters.
Land disasters.
Sea disasters.
Stadia or other public places’ failures
Fire, structural collapse, crowd stampede.
13
into: civil disorder, bomb threats/terrorist
attacks.
2.
International
Conventional war: war between two armies from different countries, sieges, blockades.
Non-conventional war: nuclear, chemical, biological.
Hybrid Natural and man-made events Flood causing explosion(s) (fire, chemical explosion, etc.)
Earthquake causing nuclear radiation, chemical explosion, etc.
Table 2.1 shows the relationship between the causes of disasters and the trigger points
that translate a hazard into a major disaster (when there are severe consequences at a
given location). Thus a better understanding is required of the relationship between a
hazard (which has been explained as a potential event which has the likelihood of
affecting man (Coppola, 2007)), vulnerability (which increases the impact of a hazard on
man’s existence) and resilience (Lofstedt and Boholm, 2005) (which is the inherent
coping capacities for recovering from, and dealing with, disasters (Perrow, 2011).
2.2.2 Hazards, Vulnerabilities and Resilience
Regardless of a specific definition or classification, disasters occur when vulnerability
and a hazard meet (Blaikie et al., 1994; Guha-Sapir et al., 2004). These terms are critical
in the understanding of disaster management. In addition, UN-ISDR (2009) suggests that
resilience is a third important concept.
2.2.2.1Hazard
Hazard is explained by UN-ISDR (2009) as a “dangerous phenomenon, substance, human
activity or condition that may cause loss of life, injury or other health impacts, property
damage, loss of livelihoods and services, social and economic disruption, or
environmental damage”. According to the International Federation of Red Cross and Red
Crescent Societies (IFRC, 2012) hazards can be classified into two main types which are
natural and man-made.
Natural hazards are naturally occurring physical phenomena which can be geophysical
14
climatological (extreme temperatures, drought and wildfires), meteorological (cyclones,
storms/wave surges) or biological (disease epidemics, insect/animal plagues).
Technological or man-made hazards (complex emergencies/conflicts, famine,
industrial/transport accidents) are events that are caused by humans and occur in, or close
to, human settlements. These hazards can include environmental degradation and
pollution (IFRC, 2012).
2.2.2.2Vulnerability
Vulnerability is defined by the Central Board of Secondary Education (CBSE) (2006), as
“the extent to which a community, structure, services or geographic area is likely to be
damaged or disrupted by the impact of particular hazard, on account of their nature,
construction and proximity to hazardous terrains or a disaster prone area”. McEntire
(2001) classified vulnerability into the following categories: physical (inappropriate and
weak construction of buildings), social (restricted education, including insufficient
knowledge about disasters), cultural (public indifference about disaster), political (limited
number of institutions that have knowledge of disasters), economic (few resources that
are important in preventing disasters like planning and management) and technological
(the lack of using appropriate technology to mitigate the impact of disasters).
2.2.2.3Resilience
The term “resilience” is largely attributed to ecological systems and originated from
within the body of ecological literature (Adger, 2000a; Gallopín, 2006; Holling, 1973).
The term has been subsequently applied to a range of subject localities such as
psychology, materials’ sciences, economics, environmental studies and social sciences
(Adger, 2000a; McDaniels et al., 2008). The discussion here is limited to the concept of
resilience from a social sciences’ perspective, addressing hazards, climate change and
related disciplines.
Adger (2000) discussed ecological resilience from two perspectives: (a) the amount of
disturbance a system can absorb before it changes its structure by changing the variables
and processes that control its behaviour, and (b) the speed of recovery following a
disturbance. Consequently, social resilience has been defined as “the ability of communities to withstand external shocks to their social infrastructure” (Adger, 2000).
On a similar note, Carpenter et al. (2001) defined resilience as “the magnitude of
15
region of state space controlled by a different set of processes”. Both these definitions
infer resistance to disturbance as a key criterion of resilience. However, Carpenter et al.
(2001) emphasised that resilience has the characteristics of: (a) the amount of change a
system can undergo whilst retaining the same structure and function, (b) the degree to
which a system is capable of self-organisation, and (c) the degree to which a system can
build the capacity to learn and adapt.
In short, a disaster happens when a hazard in the environment affects an area which has
vulnerability, for instance, a river flooding (hazard) affects a collection of houses built
close to the river (vulnerability). The area is resilient to an extent to which it can recover
from the effects of the flood. In this simple example, the area would have high resilience
if it had flood defences which kept the water level to a minimum. In contrast, if no
defences were in place then the damage would be extensive and it would take a long time
to recover. The area would, therefore, have low resilience.
2.2.3 Disaster Management Definition and Cycle
The aim of disaster management is to reduce or avoid the potential losses from hazards,
assure prompt and appropriate assistance to victims of disaster, and achieve rapid and
effective recovery. Many different definitions exist for disaster management, amongst
which is that of Deshmukh et al. (2008) who stated that it is an integrated process of
planning, organizing, coordinating and implementing measures that are needed for
effectively dealing with impact on people. As described by Clerveaux et al. (2010), the
disaster management cycle illustrates the process and steps that should be followed in a
disaster to reduce the impact on society, provide a fast response and ensure the best
recovery from the consequences of disaster. Four phases presented by Alexander (2002) -
mitigation, preparedness, response and recovery - have been widely used by policy
makers, practitioners, trainers, educators, and researchers. Figure 2. 2 shows the disaster
16
Figure 2. 2: The disaster management cycle (Alexander, 2002)
The key phases of disaster management are identified - before the event - as
mitigation/preparedness and - after the event - as response and recovery. Mitigation
involves reducing or eliminating the likelihood or the consequences of a hazard and seeks
to “treat” the hazard such that it impacts on society to a lesser degree (Alexander, 2002).
As explained by Haddow et al. (2013) definition of preparedness as plans or preparations
made to save lives or property and to assist the response and rescue service operations.
This phase covers implementation/operation, early warning systems and capacity
building so that the population will react appropriately when an early warning is issued.
According to the National Fire Protection Association (NFPA, 2007,) response is
“immediate and ongoing activities, tasks, programmes, and systems to manage the effects
of an incident that threatens life, property, operations, or the environment. Response
activities may include the preservation of life, meeting basic human needs, preserving
business operations, and protecting property and the environment.” Alexander (2002)
explained recovery as returning victims’ lives back to a normal state following the impact
of disaster consequences. The recovery phase generally begins after the immediate
response has ended and can continue for months or years thereafter.
2.2.4 Summary
The preceding sections defined a variety of disasters that can be divided into the
categories of natural, man-made and hybrid. Connected to each of these disaster types are
the terms hazard (a danger in an area), vulnerability (the likelihood of this danger
affecting the area) and resilience (the ability of the area to recover in the event of a
disaster). These are core concepts in the disaster management cycle which is the cyclical
17
aims to ensure effective recovery if a disaster occurs, taking place before, during and
after a disaster event.
2.3Holistic Approach to Disaster Management
Several well-known holistic approaches have been published in relation to disaster
management. In economically developed countries like the USA and the UK, holistic
approaches are taken. In the USA, a holistic approach includes four main phases of
emergency management (EM): mitigation, preparedness, response and recovery (Tierney
& Cigler, 2009). Meanwhile, in the UK the Integrated Emergency Management (IEM)
consists of six steps; the first four stages are referred to as the Emergency Preparedness
steps consisting of anticipation, assessment, prevention and preparation. The final two
steps are referred to as Emergency Response and Recovery (Guidance on Part 1 of the
Civil Contingency Act 2004, Cabinet Office, 2013c). The UK’s holistic approach for
emergency management is aimed at creating a connected, multi-agency response to
emergencies at local level up to national levels. The holistic approach explicitly aims to
boost the coordination and collaboration between multi-agencies and to ensure that new
information is passed on and that responders at local and regional levels can maintain
policies passed down from the central government. Since the aim of this research is to
study risk assessment aimed at supporting emergency preparedness, the key approaches
used in preparedness is discussed next. These holistic approaches are achieved through
following specific guidelines which offer models of good practice.
The guidance presented in these approaches (which focus on collaboration among
different agencies in preparing for different hazards) is important because different
agencies may have access to different information that needs to be shared with other
groups. In the USA, the authorities have adopted the concept of a Comprehensive
Preparedness Guide (CPG) (Fugate, 2010) whereas the UK uses a risk assessment process
based on the standard used in Australia and New Zealand (Standards Australia/Standards
New Zealand Standard Committee, AS/NZS ISO 31000:2009). These guidelines are
explained below. Within these guidelines, risk assessment plays a critical role because it
forms the basis for emergency planning and so heavily influences the other stages of the
18
2.3.1 USA Comprehensive Preparedness Guide (CPG)
The CPG aims to ensure that the basic aspects of emergency plans are based on a
thorough examination of a threat or hazard. The guidelines suggest that plans ought to be
integrated and coordinated between agencies. The purpose of the guidelines is to build
systematic planning into all phases of emergency management and emphasizes the need
for the entire life cycle of an emergency to be accounted for. The guidelines call for a
clear understanding of hazards, required capabilities and an outline of the roles and
responsibilities of responders and stakeholders. They emphasize the need for a
community to address its own specific context in terms of the risks faced and the
resources available (Fugate, 2010).
The planning process is an important process in the preparedness phase. The process
involves different sources of information which are brought together to create plans that
can be used in an emergency and, therefore, increase preparedness. Collaboration
between different agencies in planning is crucial because different agencies may have
access to different information that needs to be shared with other groups in order to plan
effectively. Moreover, planning is most successful when done as a team. When successful,
the planning process allows multiple agencies to integrate in order to effectively prepare
for disasters (Abbott, 2002). The model below in Figure 2. 3 shows the stages of the
planning process. The model is intended to be flexible and adaptable for different
emergencies. Each step will now be described in detail.