INTRODUCTION
For developing tissues to attain their proper size and cell type proportions, stem cell proliferation and differentiation must be tightly regulated. Recent studies have identified a variety of negative-feedback strategies for achieving robust control of tissue size and cell number (Shraiman, 2005; Kirouac et al., 2009; Lander et al., 2009). The olfactory epithelium (OE) of the mouse has been a particularly useful model system in this regard (Gokoffski et al., 2009).
The OE contains two differentiated cell types: olfactory receptor neurons (ORNs), which relay olfactory information to the central nervous system, and sustentacular (Sus) cells, which are glial cells that form the apical surface monolayer of the OE (Farbman, 1992). A multistage lineage underlies the production of ORNs (Fig. 1A) and includes: (1) stem cells, which express Sox2and are crucial for morphogenesis of the OE and nasal cavity (Kawauchi et al., 2005;
Kawauchi et al., 2009); (2) Ascl1 (Mash1)-expressing early progenitors, which evidence indicates are committed to neuronal differentiation and required for ORN production (Guillemot et al., 1993; Gordon et al., 1995; Murray et al., 2003); and (3) immediate neuronal precursors (INPs), which express Neurog1(Ngn1) and can either self-renew or differentiate into (4) post-mitotic, Ncam (Ncam1)-expressing ORNs (Calof and Chikaraishi, 1989; DeHamer et al., 1994; Lander et al., 2009). Much less is known about the origins of Sus cells (Matulionis, 1976; Huard et al., 1998; Murray et al., 2003).
ORN number is regulated by the TGFligand GDF11, which when absent leads to the production of supernumerary INPs and ORNs. GDF11 has two effects: it inhibits cell-cycle progression of INPs and it decreases the proportion of INPs that self-renew rather than differentiate into ORNs (Wu et al., 2003; Lander et al., 2009). Thus, GDF11 serves as an autocrine negative growth regulator or ‘chalone’, much like its close homolog GDF8 (myostatin) in muscle (Gamer et al., 2003). Additional evidence that GDF11 is a negative regulator of OE neurogenesis comes from studies of follistatin (FST), a GDF11 antagonist: the OE of Fst–/–mice is abnormally thin, with markedly fewer INPs and ORNs (Wu et al., 2003).
There are reasons to suspect that GDF11 is not the sole regulator of cell number and tissue size in the OE. For example, computational modeling suggests that additional feedback control must be exerted on stem cells, rather than just on the committed progenitor (INP) upon which GDF11 acts (Lander et al., 2009). As described below, our finding that the phenotype of the Fst–/–OE is only partially rescued by loss of Gdf11led us to identify activin B (ACTB; also known as inhibin -B – Mouse Genome informatics) as a second feedback factor in the OE, and one that specifically targets Sox2- and Ascl1-expressing stem and early progenitor cells. We show here that ACTB and GDF11 together control not only the size of the stem Development 138, 4131-4142 (2011) doi:10.1242/dev.065870
© 2011. Published by The Company of Biologists Ltd
1Department of Developmental & Cell Biology, University of California, Irvine, CA 92697, USA. 2Department of Anatomy & Neurobiology, University of California, Irvine, CA 92697, USA. 3Center for Complex Biological Systems, University of California, Irvine, CA 92697, USA. 4Department of Neuroscience, UT Southwestern Medical Center, Dallas, TX 75390, USA. 5Departments of Pathology, Molecular & Cellular Biology, and Molecular and Human Genetics, Baylor College of Medicine, Houston, TX 77030, USA.
*Present address: Department of Cell & Neurobiology, Zilkha Neurogenetic Institute, Keck School of Medicine, University of Southern California, Los Angeles, CA 90089, USA
†Present address: School of Midwifery, Laurentian University, Sudbury, ON P3E 2C6, Canada
‡Present address: KAIST, Graduate School of Medical Science and Engineering, Daejeon 305-701, South Korea
§Present address: Division of Biological Sciences, University of California San Diego, La Jolla, CA 92093, USA
¶Author for correspondence ([email protected])
Accepted 13 July 2011
SUMMARY
Studies of the olfactory epithelium model system have demonstrated that production of neurons is regulated by negative feedback. Previously, we showed that a locally produced signal, the TGFsuperfamily ligand GDF11, regulates the genesis of olfactory receptor neurons by inhibiting proliferation of the immediate neuronal precursors (INPs) that give rise to them. GDF11 is antagonized by follistatin (FST), which is also produced locally. Here, we show that Fst–/–mice exhibit dramatically decreased
neurogenesis, a phenotype that can only be partially explained by increased GDF11 activity. Instead, a second FST-binding factor, activin B (ACTB), inhibits neurogenesis by a distinct mechanism: whereas GDF11 inhibits expansion of INPs, ACTB inhibits expansion of stem and early progenitor cells. We present data supporting the concept that these latter cells, previously considered two distinct types, constitute a dynamic stem/progenitor population in which individual cells alternate expression of Sox2 and/or Ascl1. In addition, we demonstrate that interplay between ACTB and GDF11 determines whether stem/progenitor cells adopt a glial versus neuronal fate. Altogether, the data indicate that the transition between stem cells and committed progenitors is neither sharp nor irreversible and that GDF11, ACTB and FST are crucial components of a circuit that controls both total cell number and the ratio of neuronal versus glial cells in this system. Thus, our findings demonstrate a close connection between the signals involved in the control of tissue size and those that regulate the proportions of different cell types.
KEY WORDS: TGF, Olfactory epithelium, Transit-amplifying cell, Neurogenesis, Follistatin, Gliogenesis, Mouse
Activin and GDF11 collaborate in feedback control of
neuroepithelial stem cell proliferation and fate
Kimberly K. Gokoffski1,2,3, Hsiao-Huei Wu2,*, Crestina L. Beites2,†, Joon Kim2,‡, Euiseok J. Kim4,§, Martin M. Matzuk5, Jane E. Johnson4, Arthur D. Lander1,3and Anne L. Calof1,2,3,¶
D
E
V
E
LO
P
M
E
N
and progenitor cell populations, but also influence the choice between neuronal and glial fates assumed by these cells. We argue that this choice occurs through resolution of an initial state in which a bipotential stem cell alternates expression of Sox2and/or Ascl1. Thus, the molecular circuitry underlying OE growth regulation involves feedback effects on fate choice, proliferation and differentiation at all lineage stages.
MATERIALS AND METHODS
Reagents
GDF11 and BMP2 were from Dr Anthony Celeste (Wyeth). Activin B and FGF2 were from PeproTech. FST was from the National Hormone & Pituitary Program (A. F. Parlow, Harbor-UCLA). Bromodeoxyuridine (BrdU) for tissue culture was from Amersham (#RPN201) and for in vivo labeling was from Sigma (#B-5002). MG132 was from Calbiochem (#474790).
Animals
CD-1, Ascl1+/–,TgN1-2G+/+, Fst+/–and Gdf11+/tm2(Gdf11+/–) mice were
maintained as described (Wu et al., 2003). Ascl1GFP/+(Kim et al., 2007)
and ActB+/–mice (Vassalli et al., 1994) were maintained on C57BL/6J
(Jackson Labs). Ascl1CreERT2/+mice were generated as described (Kim et al., 2011). For lineage tracing, Ascl1CreERT2/+ mice were crossed with R26R-stop-YFP mice (Jackson Labs), and pregnant dams were injected with tamoxifen (Tmx; 2.5 mg/40 g body weight; Sigma, T55648) in sunflower oil (Kim et al., 2007).
In situ hybridization (ISH) and immunofluorescence (IF)
ISH and IF were performed on E17.5 OE cryosections as described (Wu et al., 2003; Kawauchi et al., 2009). New probes were Alk4(31-567 bp of GenBank #Z31663); ActRIIa (Acvr2a; 71-472 bp of GenBank #M65287); ActB (1-602 bp of GenBank #X83376 plus 234 bp of 5⬘sequence); activin A (ActA; 1049-1474 bp of GenBank #NM008380 including 50 bp of pro-domain and 24 bp of 3⬘UTR); and Sox2(1281-2029 bp of GenBank #X94127). Primary antibodies were rabbit anti-SOX2 (Chemicon, 1:500), rabbit GFP (Molecular Probes, 1:500), mouse anti-cytokeratin 18 (Millipore RGE53, 1:50) and OE SUS cell-specific mouse monoclonal antibody SUS-4 (Goldstein and Schwob, 1996) (1:50).
BrdU and ASCL1 IF were performed as described (Wu et al., 2003). For CYT18/SOX2 IF, tissue was fixed in Omnifix (AnCon Genetics). Secondary antibodies were from Jackson ImmunoResearch (1:50-1:100) and nuclei were stained with Hoechst 33258 (Sigma; 10 g/ml). Samples were visualized with a Zeiss Axiophot and/or ApoTome epifluorescence microscope, and measurements made using AxioVision software (Zeiss). For quantification, 2-5 mm of septal OE were evaluated in two to three animals of each genotype.
Primary OE cultures
To analyze ASCL1+progenitors, 8-hour OE explants were prepared from CD-1 embryos, ASCL1+IF performed and cells quantified as described (Gordon et al., 1995). To assess effects on INPs, explants from TgN1-2G+/–
embryos were cultured for 30 hours. The only progenitors present in OE cultures at 30 hours in vitro are INPs, which in TgN1-2G+/–-derived OE
explants are marked by expression of a Neurog1-specific GFP reporter (Wu et al., 2003). Sus cell cultures included FGF2 (10 ng/ml) as well as the indicated factors, and were fixed in acetone (DeHamer et al., 1994) for CYT18 IF. Migratory cells with CYT18 fluorescence intensities greater than 2.2-fold background (no primary antibody) were designated Sus. For quantification of results, at least 2000 migratory cells were counted in a minimum of three separate cultures for each condition.
RESULTS
GDF11 alone does not account for all negative-feedback signaling in the OE
Fig. 1A illustrates OE structure and the cell lineages underlying ORN production, including feedback from ORNs onto INPs by GDF11 (Wu et al., 2003; Lander et al., 2009). FST, a known
GDF11 antagonist (Schneyer et al., 2008), is also expressed in olfactory mucosa, and we have reported previously that Fst–/–OE is deficient in ORNs (Wu et al., 2003). A more detailed analysis of Fst–/–OE revealed drastic depletion of cells at all ORN lineage stages (Fig. 1B,C): Sox2+basal stem cells, Ascl1+ progenitors, Neurog1+INPs and Ncam+ORNs. Normally, Sox2 is expressed in two distinct zones: in basal OE there are scattered Sox2+neural stem cells (Kawauchi et al., 2005; Kawauchi et al., 2009) and the apical surface monolayer of OE Sus cells is also Sox2+(Fig. 1B) (Guo et al., 2010). In Fstmutants, only the basal population of Sox2+neural stem cells is depleted (Fig. 1B, see Fig. S1 in the supplementary material). This suggests that FST primarily affects neurogenesis, and not gliogenesis, in OE development, consistent with an inhibitory effect of FST on GDF11 function.
If FST acts solely by antagonizing GDF11, then Fst–/–;Gdf11–/– OE should display the Gdf11–/–phenotype because absence of FST should have no effect when there is no GDF11 to antagonize. As shown in Fig. 1C, the numbers Sox2-, Ascl1-, Neurog1-and Ncam-expressing cells are indeed greater in Fst–/–;Gdf11–/–than in Fst–/– OE; however, they are not increased to the level in Gdf11–/–OE. Indeed, the numbers of ORN lineage cells in Fst–/–;Gdf11–/–OE are all significantly below the values observed in wild type. These data imply that the mechanism(s) by which FST promotes OE neurogenesis can only partially be accounted for by antagonism of GDF11.
This hypothesis is further supported by the significant depletion of basal Sox2+and Ascl1+cells that we observe in Fst–/–OE (Fig. 1B,C). Previously, we showed that GDF11 action on OE neuronal progenitor cells is confined to INPs (Wu et al., 2003). Consistent with this, Gdf11–/–OE displays no change in the numbers of Ascl1+ and basal Sox2+ cells (Fig. 1B,C). Moreover, exposure of OE cultures to GDF11 (at 10-fold higher concentration than that which completely blocks proliferation of INPs) has no effect on the development of ASCL1+cells (see Fig. S2 in the supplementary material). Together, these observations suggest that a second TGF ligand – one that is antagonized by FST but is distinct from GDF11 – is likely to control the production of Sox2- and Ascl1-expressing stem and progenitor cells.
Activin B is expressed by OE neuronal cells
The TGFligands GDF11, GDF8, BMP7 and activins are bound with high affinity and neutralized by FST (Sidis et al., 2006; Schneyer et al., 2008). Of these, FST exhibits strongest binding to activins, GDF8 and GDF11. Since Gdf8is not expressed in OE (Wu et al., 2003), we focused on activins as potential candidates for the additional FST-sensitive factor(s) that regulate OE neurogenesis.
Activins are homo- or heterodimers of -subunits, of which only ActA and ActB (also known as Inhbaand Inhbb, respectively) are expressed in neural tissues (Fang et al., 1997; Chang et al., 2002). As shown in Fig. 1D, ActA is not expressed in OE (although it is transiently expressed in underlying mesenchyme from E12.5-14.5; data not shown). By contrast,ActB, like Gdf11, is expressed within OE proper. Fst expression is limited to the mesenchyme underlying OE prior to E14.5 (data not shown), but from E14.5 onward cells within the OE proper produce Fst as well (Fig. 1D) (Kawauchi et al., 2004).
Increase in stem and early progenitor cells in
ActB–/–OE
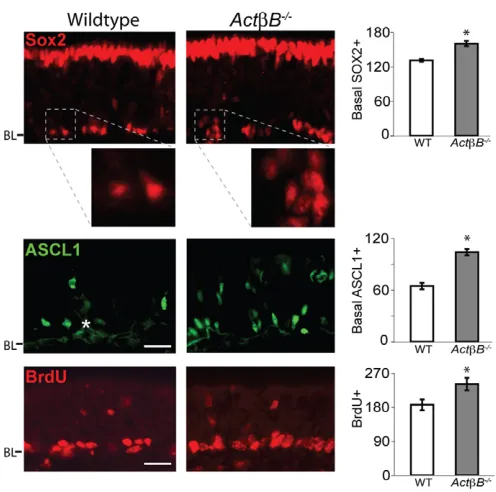
When we analyzed tissue from ActB–/–mice, we found increases in both SOX2+neural stem cells and ASCL1+progenitors (Fig. 2). There were 22% more basal SOX2+cells and 62% more ASCL1+
D
E
V
E
LO
P
M
E
N
cells in ActB–/–OE than in controls. In addition, 30% more cells – predominantly basal in location – incorporated a short pulse of BrdU, indicating that the number of proliferating stem/progenitor cells is increased in ActB–/–OE. These findings are notable for two reasons. First, the increase in the number of SOX2- and ASCL1-expressing cells and in BrdU-incorporating basal cells demonstrates that ACTB normally restrains the expansion of these populations. Second, whereas the magnitude of effects observed in ActB–/–OE is similar to that observed in Gdf11–/– OE (22-62% increase, depending on cell type), the cell types affected are different [e.g. the levels of ASCL1+cells are unchanged in Gdf11–/–OE (Fig. 1B,C)].
ACTB has an anti-neurogenic action distinct from that of GDF11
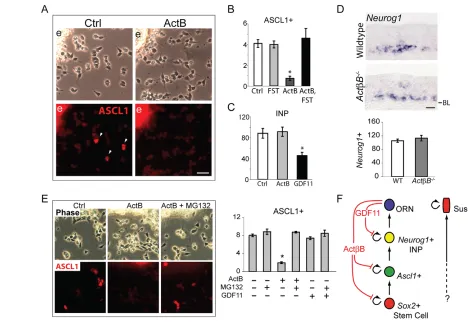
To determine whether ACTB acts directly on ASCL1+progenitors, we performed short-term OE explant cultures. In such cultures, ASCL1+progenitors migrate away from explants (Fig. 3A, ‘e’),
where they can be identified by immunostaining and quantified (Fig. 3A, white arrowheads). Treatment with activin B (ACTB homodimer of ACTB subunits) for 8 hours leads to a dramatic reduction in ASCL1+cells compared with controls, and addition of FST completely abrogates the effect of ACTB (Fig. 3B). FST alone has no effect on ASCL1+progenitors, as expected (Wu et al., 2003). Despite its pronounced effect on ASCL1+progenitors, ACTB has no effect on the development of INPs (Fig. 3C) in a culture paradigm that assesses effects on INPs specifically (see Materials and methods). By contrast, GDF11 strongly inhibits INP development in these cultures, as expected (Wu et al., 2003). These results parallel what we observe in vivo: in ActB–/–OE, the number of Neurog1+ INPs is no different from wild-type OE (Fig. 3D), whereas in Gdf11–/–OE this number is significantly increased (Fig. 1B,C).
[image:3.612.52.515.58.475.2]Interestingly, we found that 2 hours of exposure to ACTB is sufficient for inhibition of ASCL1 expression in OE cultures (Fig. 3E), suggesting a direct action of ACTB on ASCL1+ cells, Fig. 1. Partial recovery of neurogenesis in Gdf11–/–;Fst–/–mouse olfactory epithelium (OE). (A)Schematic of OE structure and lineage. The
origin of sustentacular (Sus) cells is uncertain. (B)In situ hybridization (ISH) for the indicated markers. (C) OE thickness (m), olfactory receptor neuron (ORN; Ncam+) layer thickness (m), and Neurog1-, Ascl1- and basal Sox2-expressing cells are plotted per mm OE and normalized as a
percentage of wild type. Error bars indicate root mean square; *, P≤0.05 by Dunnett’s test [DT (Glantz, 2005)]. (D)ISH with the indicated probes. BL, basal lamina; NC, nasal cavity; Str, stroma. Scale bars: 20m.
D
E
V
E
LO
P
M
E
N
reminiscent of that seen for BMP2 and BMP4: BMP treatment causes rapid, proteasome-mediated degradation of ASCL1 in OE cultures, resulting in arrest of ASCL1+progenitor cell development and cessation of neurogenesis (Shou et al., 1999). Since the proteasome pathway has a known role in regulating cell differentiation (e.g. Reavie et al., 2010), we tested whether inhibition of this pathway prevents the effect of ACTB on ASCL1+ progenitors. As shown in Fig. 3E, the proteasome inhibitor MG132 (Rock et al., 1994) completely blocks the effect of ACTB on ASCL1+cells. GDF11 had no effect on ASCL1+cells in these cultures, nor did addition of MG132 alter this (Fig. 3E). Altogether, these findings indicate that ACTB and GDF11 exert distinct anti-neurogenic effects at different stages in the ORN lineage (Fig. 3F).
Differential expression of type I signaling receptors for ACTB and GDF11
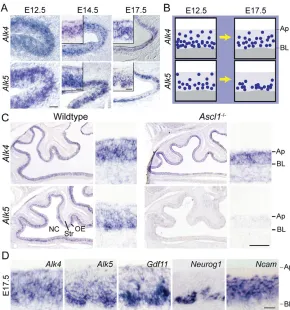
How might ACTB and GDF11, which activate similar signaling pathways, exert such different effects? One possibility is that receptors specific for GDF11 and ACTB are differentially expressed. Although activins and GDF11 can utilize the same type II ligand-binding receptors (Attisano et al., 1996; Oh et al., 2002), increasing evidence indicates that ACTB and GDF11 signal preferentially through different type I receptors, with ALK4 (also known as ACVRIB and ACTRIB) being the preferred receptor for ACTB, and ALK5 (TGFR1) the preferred receptor for GDF11 (Attisano et al., 1996; Andersson et al., 2006; Tsuchida et al., 2008). We examined expression of Alk4 and Alk5 by ISH, and found that both are expressed in OE neuroepithelium (but not underlying stroma) from E12.5-17.5 (Fig. 4A). As development proceeds, Alk4 expression remains widespread throughout the apical-basal extent of the OE, whereasAlk5 expression becomes progressively restricted to basal OE, where stem and progenitor cells reside (Fig. 4B).
To gain further insight, we took advantage of Ascl1–/–mice, in which OE neurogenesis is halted at the stage of Ascl1-expressing early progenitor cells (Guillemot et al., 1993; Murray et al., 2003; Wu et al., 2003). By E17.5, there are essentially no INPs or ORNs in Ascl1–/–OE; instead, virtually all OE cells express markers of Sus cells and/or stem cells, including Sox2, Otx2, Raldh3 (Aldh1a3) and Steel (Kitl) (Murray et al., 2003; Kawauchi et al., 2004; Beites et al., 2005). We found that expression of Alk4 persists, butAlk5 expression is absent, in Ascl1–/–OE (Fig. 4C). This finding is consistent with the idea that Alk4expression reflects a bias toward glial (Sus) differentiation, whereas Alk5expression reflects a bias toward neuronal (ORN) differentiation (e.g. by INPs). The high-magnification images in Fig. 4D illustrate the fact that the patterns of expression of Alk5,Gdf11 andNeurog1 are highly similar, consistent with the finding that GDF11-mediated feedback acts primarily on INPs.
Insensitivity of neuron number to loss of ActB
feedback
If the model of OE neurogenesis in Fig. 3F is correct, it might be expected that the excess of SOX2+and ASCL1+stem and early progenitor cells that accumulate in ActB–/–OE would eventually translate into proportional increases in the numbers of INPs and ORNs (Gokoffski et al., 2009; Lander et al., 2009). Surprisingly, this is not the case: INP number and the thickness of the Ncam+ ORN layer (an indication of ORN number) are unchanged in ActB–/–OE (Fig. 3D, see Fig. S3 in the supplementary material). Overall OE thickness (the distance from the basal lamina to the apical surface) is also unchanged [wild type, 67±3 m; ActB–/–, 67±7 m (±s.e.m.)].
One obvious explanation is that GDF11, still present in ActB–/– OE, limits INP divisions and ORN differentiation (Lander et al., 2009), thereby preventing an increase in INP and ORN numbers. We tested this idea by examining the OE of mice null for both ActBand Gdf11(Fig. 5). The absence of both ActB and Gdf11 does not translate into overproduction of ORNs and INPs: numbers of Neurog1+ INPs and Ncam+ ORNs are the same in ActB–/–;Gdf11–/– OE and Gdf11–/– OE, and the expansion of Ascl1+and basal Sox2+cells is at least as great as that seen in the absence of ActB alone (Fig. 5A, see Fig. S4 in the supplementary material). Therefore, negative feedback of GDF11 onto INP proliferation and/or differentiation cannot account for the selective increase in stem and early progenitor cells seen in ActB–/–OE.
[image:4.612.50.298.58.304.2]Interestingly, we did observe a striking increase in Sox2 expression in the apical compartment of ActB–/–;Gdf11–/–OE (Fig. 5A, top panel, white arrowhead), suggesting that double mutants have increased numbers of Sus cells. To confirm this, we performed SOX2 IF in mice null for ActB, Gdf11, or both genes, and counted apical SOX2+Sus cells. As shown in Fig. 5B-D, the number and spatial arrangement of these cells are not significantly different in ActB mutants compared with wild-type controls. By contrast, SOX2+Sus cells are significantly increased in Gdf11–/– OE, and even more so in ActB–/–;Gdf11–/– OE. These supernumerary SOX2+ Sus cells acquire immunoreactivity for SUS4 (Fig. 5C), a marker of differentiated Sus cells (Goldstein and Schwob, 1996; Huard et al., 1998). Together, these results demonstrate that the mature Sus cell population is expanded significantly in the absence of Gdf11, and even more dramatically when both Gdf11and ActBare absent. Moreover, although Sus cells are a self-renewing population (Weiler and Farbman, 1998), their expansion in Gdf11–/–and ActB–/–;Gdf11–/–OE is not due to increased proliferation: BrdU labeling experiments showed that the Fig. 2. Increase in SOX2+and ASCL1+cells in ActB–/–OE.Bar
charts show cells/mm OE (mean ±s.e.m.; *, P≤0.05 DT). White asterisk, Bowman’s gland. BL, basal lamina. Scale bars: 20m.
D
E
V
E
LO
P
M
E
N
proliferation index of Sus cells is the same in mutant and wild-type OE (Fig. 5E). These data make it unlikely that Sus cell self-renewal is regulated by GDF11 and/or ACTB.
Altogether, these results suggest an alternative explanation for why additional early stage stem cells and progenitors in ActB–/– OE fail to produce supernumerary INPs and ORNs: these cells now preferentially give rise to Sus cells. There have been indications from previous work that Sus cells and ORNs might share a common progenitor in the OE (Huard et al., 1998; Murray et al., 2003; Chen et al., 2004; Kawauchi et al., 2004; Beites et al., 2005). The observation that Sus cells express SOX2, just as basal neuronal stem cells do, supports this idea (Kawauchi et al., 2004; Beites et al., 2005; Kawauchi et al., 2005; Guo et al., 2010). Altogether, our observations suggest that expansion of Sus cells in ActB–/–;Gdf11–/–OE is due to increased production of Sus cells by SOX2+basal stem cells.
Ascl1-expressing cells give rise directly to Sus cells Alteration(s) in gliogenesis resulting in the diversion of excess SOX2+stem cells into Sus cells provide a partial explanation for the insensitivity of neurogenesis to loss of feedback from ACTB. However, it still does not explain why the excess in Ascl1+cells in ActB–/–;Gdf11–/–OE fails to translate into increased numbers of
INPs and ORNs. Although previous findings had suggested that ASCL1 marks cells specific to the ORN lineage (Gordon et al., 1995; Cau et al., 1997; Cau et al., 2002), we noticed that some ASCL1+cells are present in or near the Sus cell layer in IF and ISH experiments (Fig. 2, Fig. 5A). We wondered whether this was an indication that ASCL1+cells also give rise to Sus cells.
[image:5.612.51.521.58.380.2]To address this, dual IF labeling for SOX2 and ASCL1 was performed. Fig. 6A shows that cells expressing both SOX2 and ASCL1 occur not only in the basal (stem/progenitor) compartment of the OE, as expected, but also in the apical (Sus) compartment. This, again, suggests that ASCL1+cells might give rise directly to apical Sus cells. To test this idea directly, we used mice heterozygous for an allele in which the Ascl1coding sequence has been replaced with GFP [Ascl1GFP/+mice (Leung et al., 2007)]. Because of the relatively long half-life of GFP (Okabe et al., 1997; Feng et al., 2000; LeSauter et al., 2003), fluorescence is detected not only in cells that are actively transcribing Ascl1, but also transiently in their progeny. Fig. 6B shows that the OE of these mice contains Ascl1-GFP+cells (i.e. cells expressing GFP from the Ascl1locus) in the apical Sus cell layer. These apical Ascl1-GFP+ cells resemble Sus cells morphologically and also express the differentiated Sus cell marker SUS4 (Fig. 6B, bottom panel) (Goldstein and Schwob, 1996; Huard et al., 1998).
Fig. 3. ACTB limits development of ASCL1+cells in vitro.(A,B)Mouse OE explants (‘e’) cultured for 8 hours in ACTB (10 ng/ml) and/or FST (200
ng/ml). White arrowheads indicate ASCL1+cells. Bar chart shows percentage of cells that are ASCL1+(mean ±s.e.m.; *, P≤0.05 DT). (C)TgN1-2G+/–
explants were cultured for a total of 30 hours, with ACTB (20 ng/ml) or GDF11 (20 ng/ml) added for the final 18 hours in vitro. GFP+(Neurog1+)
immediate neuronal precursors (INPs) were analyzed as described (Wu et al., 2003) and are plotted as mean (±s.e.m.) per 15,000m2explant. *, P≤0.05 by DT. (D)Neurog1ISH in ActB–/–and control OE. Bar chart shows mean ±s.e.m. (E)OE explants were cultured for 6 hours, then ACTB or
GDF11 (20 ng/ml) was added for 2 hours. MG132 (10M) or control (0.1% DMSO in medium) was added 30 minutes prior to ACTB or GDF11 addition. Analysis as in A. (F)Schematic showing actions of ACTB and GDF11 on the ORN lineage. BL, basal lamina. Scale bars: 20m.
D
E
V
E
LO
P
M
E
N
To confirm that Ascl1-expressing cells give rise directly to Sus cells, we performed inducible lineage-tracing experiments in which Ascl1CreERT2/+ mice were crossed with R26R-stop-YFP reporter mice. Pregnant dams were injected with tamoxifen (Tmx), causing Ascl1+cells and their descendants to become marked by YFP (see Materials and methods). When the OE of pups was examined at P0, YFP+cells that also expressed SUS4 were readily observed (Fig. 6C). Altogether, these data indicate that some Sus cells derive directly from cells that express Ascl1and, thus, that expression of Ascl1 does not irreversibly commit OE progenitor cells to a neuronal fate.
If becoming Sus (glial) is a normal fate for an Ascl1+progenitor, then one might expect to observe the migration, during development, of Ascl1+Sus cells from a reservoir of basal Ascl1+ progenitors. We performed BrdU pulse-chase experiments using Ascl1GFP/+mice. As shown in Fig. 6D-F, 2 hours following a pulse of BrdU, virtually all GFP+BrdU+cells (i.e. Ascl1-expressing cells that take up BrdU) are located in basal OE. Twenty-four hours following a BrdU pulse, however, many double-labeled cells have left the basal stem/progenitor compartment and are now in the apical Sus cell compartment. These phenomena could only arise if (1) most or all apical GFP+cells that were labeled with BrdU during the pulse underwent a round of replication during the 24-hour chase and remained in the Sus compartment, or (2) basal Ascl1-GFP+ progenitor cells, which incorporated BrdU while present in the basal compartment, subsequently migrated to the apical Sus compartment. Two observations indicate that the second alternative is correct. First, any change in the BrdU labeling index of Sus cells over the course of the chase is minimal, demonstrating that few Sus cells are self-replicating at this age [pulse-fix, 100±2 apical BrdU+ cells/mm OE; pulse-chase, 114±11 apical BrdU+
cells/mm OE (±s.d.)]. Second, during the same period in which the number of apical GFP+BrdU+cells rises (Fig. 6E), the number of basal GFP+BrdU+progenitor cells decreases by half (Fig. 6F). In order for these shifts to occur simultaneously, there must be an efflux of GFP+ BrdU+ cells from the basal stem/progenitor compartment into the apical compartment, indicating that basal Ascl1-expressing progenitors migrate to apical OE, where they differentiate into Sus cells.
These observations together argue in favor of a revision of the view that Ascl1expression marks a neuronally committed stage on the path from Sox2+stem cell to ORN. Instead, they raise the possibility that there is a single, bipotential stem/progenitor cell that is capable of expressing Sox2, Ascl1or both (Fig. 6G). Cues that bias the amount of time spent in each expression state, or the level of each transcription factor, would then influence the proportion of progeny that differentiate along neuronal versus glial lines. This view is further supported by the results described below.
ActBand Gdf11modulate allocation of OE stem
cells to different fates
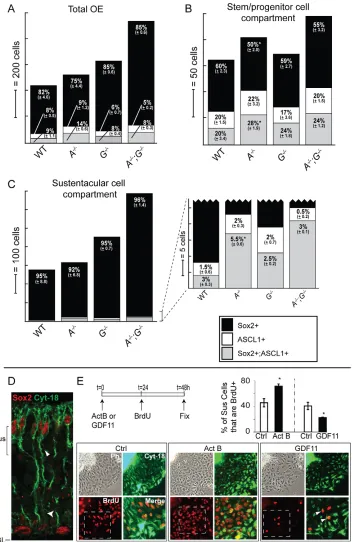
[image:6.612.52.342.62.372.2]Consideration of the model outlined in Fig. 6G prompted us to quantitatively analyze SOX2 and ASCL1 single- and double-immunopositive cells in Gdf11–/–, ActB–/–and double-mutant OE, separately scoring cells that are in the basal stem/progenitor compartment versus the apical Sus compartment. Fig. 7A-C presents the results using stacked bar charts, in which numbers of single- and double-immunopositive cells of each type (per mm OE) are reflected in bar heights and the proportions of each type are given by percentage (for absolute cell counts, see Table S1 in the supplementary material).
Fig. 4. Expression of Alk5, but not Alk4, requires Ascl1 function.(A)ISH in wild-type mouse OE.
(B)Schematic of developmental changes in Alk4and Alk5 expression. Blue circles, represent Alk4- or Alk5-expressing cells. (C) ISH in Ascl1–/–and wild-type OE. (D)Wild-type OE
hybridized with the indicated probes. Ap, apical surface; BL, basal lamina; NC, nasal cavity; Str, stroma. Scale bars: 50m in C, A E12.5; 20m in D, A E14.5 and E17.5.
D
E
V
E
LO
P
M
E
N
In ActB–/–OE, where we had earlier noted simply that basal SOX2+and ASCL1+cells are both increased (Fig. 2), it is now possible to see that this effect is due solely to an increase in ASCL1+and in SOX2+; ASCL1+cells. Cells that express SOX2 alone are not significantly increased in number compared with wild type. These effects are observed in both the basal stem/progenitor compartment (Fig. 7B) and the apical Sus compartment (Fig. 7C). In Gdf11–/–OE, we previously noted that the numbers of basal SOX2+and ASCL1+cells are not significantly different from wild type (Fig. 1C) (Wu et al., 2003), which was confirmed here (Fig. 7B). However, if we combine the data from the apical and basal compartments (Fig. 7A), we see a large increase in the total number of SOX2 single-positive cells, a possible small increase in SOX2+ ASCL1+cells, and no change in ASCL1 single-positive cells. In
ActB–/–;Gdf11–/– OE, where we had noted an even larger expansion of basal SOX2+cells than occurs in the absence of ActBalone (compare Fig. 5A with Fig. 2), we could now see that the additional expansion is due to an increase in the number of cells that express SOX2 alone, as opposed to both SOX2 and ASCL1 (Fig. 7B, see Table S1 in the supplementary material). This is precisely the population that is not expanded in the ActB mutant. The same trends are observed in the apical compartment, where only SOX2 single-positive cells are significantly increased in number compared with what is seen in ActB–/–OE (see Table S1 in the supplementary material).
[image:7.612.47.346.61.573.2]A coherent picture emerges from these data: loss of ActBfavors the selective expansion of cells with a ‘neuronal bias’ (i.e. those expressing ASCL1 alone or together with SOX2), whereas loss of
Fig. 5. Increased Sus cells in Gdf11–/–and
ActB–/–;Gdf11–/–OE. (A)ISH with the indicated probes
indicates increased Sox2 expression and a thicker Sus layer (white arrowhead) in ActB–/–;Gdf11–/–OE. (B)Magnified
images show apical SOX2+cells outlined by white boxes.
(C)Most apical SOX2+cells are also SUS4+[83±2%
(±s.e.m.)]. (D)Mean number of SOX2+Sus cells/mm OE (±
s.e.m.; *, P≤0.05 DT). (E)SOX2+Sus cells and the
percentage of these that are BrdU+(‘proliferation index’)
plotted as mean ± s.e.m. dKO, ActB–/–;Gdf11–/–. BL, basal
lamina; N, neuronal layer; Sus, sustentacular layer. Scale bars: 20m in A,B; 10m in C.
D
E
V
E
LO
P
M
E
N
Gdf11favors the selective expansion of cells with a ‘glial bias’ (i.e. SOX2 single-positive cells). In the latter case, most of the additional SOX2+cells move to the apical compartment, where they produce supernumerary Sus cells [this explains why there is no increase in early stage neuronal progenitors (ASCL1 single-positive cells) in the Gdf11single mutant].
These results suggest that ACTB promotes stem/progenitor cell commitment to the glial (Sus) fate, whereas GDF11 inhibits commitment to that fate. To examine this directly, we tested the effects of ACTB and GDF11 on the development of Sus cells in vitro, in OE explant cultures grown under conditions optimized for Sus cell development (see Materials and methods). In such cultures, Sus cells can be visualized as coherent epithelial sheets in which virtually all cells express cytokeratin 18 (CYT18; also known as keratin 18); Fig. 7D shows CYT18 staining of Sus cells in the OE in vivo (see Pixley, 1992; Jang et al., 2008). To determine the effects of ACTB and GDF11 on Sus cell development in vitro, cultures were grown for 48 hours in the presence or absence of these factors.
During the final 24 hours, BrdU was added, following which cultures were fixed and processed for BrdU and CYT18 immunoreactivity (Fig. 7E, diagram).
As predicted from our findings in vivo, ACTB had a positive effect, whereas GDF11 had a negative effect, on Sus cell development in vitro (Fig. 7E). When we quantified double-label IF experiments, we found that the percentage of definitive Sus cells (CYT18+) derived from BrdU-labeled cells was 57% greater in ACTB-treated cultures than in controls. Conversely, cultures treated with GDF11 contained 44% fewer double-labeled cells than controls (Fig. 7E).
[image:8.612.52.542.56.447.2]Importantly, when experiments were performed in which Sus cell cultures were exposed for 16 hours to GDF11 or ACTB and then pulsed for 2 hours with BrdU, no substantial effect on the proliferation of existing Sus cells was observed with either factor (data not shown). This finding is reminiscent of what is observed in vivo in Gdf11–/–, ActB–/–and Gdf11–/–;ActB–/–OE, where no significant difference in the BrdU pulse-labeling index of Sus cells is seen between any of these mutants and wild-type littermates (Fig. Fig. 6. Ascl1-expressing cells give rise directly to Sus cells.(A)Immunofluorescence (IF) for SOX2 and ASCL1 in wild-type OE. White
arrowheads indicate SOX2+; ASCL1+cells. (B)In Ascl1GFP/+OE, apical GFP+cells are SUS4+(arrowheads). The bottom row shows a z-stack image
(2m spacing) of the boxed cell. Arrows indicate a SUS4+; GFP+cell. (C) Pregnant dams were injected with tamoxifen (Tmx; see Materials and
methods) and SUS4 IF performed on P0 OE. The bottom row shows a z-stack image (0.5m spacing) of the boxed cell. (D)BrdU was administered to pregnant dams (Ascl1GFP/+) and GFP+and BrdU+cells analyzed in Sus and basal (‘B’) compartments at the times indicated. (E,F)Quantification of
experiments in D, plotted as mean GFP+BrdU+cells/mm OE (±s.d.). P-F, pulse-fix; P-C, pulse-chase. (G)Schematic showing feedback and dynamic
expression of Sox2 and/or Ascl1by a stem cell. BL, basal lamina; N, neuronal layer; Sus, sustentacular layer. Scale bars: 20m.
D
E
V
E
LO
P
M
E
N
5E). Altogether, our findings in vivo and in culture indicate that ACTB and GDF11 exert opposing effects on Sus cell development, with ACTB promoting, and GDF11 opposing, the production of Sus cells.
DISCUSSION
GDF11 and ACTB have distinct, cell stage-specific feedback actions on neurogenesis and gliogenesis Here we show that two TGFsuperfamily signaling molecules, GDF11 and ACTB, play crucial and distinct roles in feedback regulation of stem and progenitor cell proliferation and fate in the
[image:9.612.60.413.60.602.2]OE (Fig. 8). In the neurogenic pathway, GDF11 inhibits proliferation of INPs, the progenitor cells that occupy the penultimate place in the ORN lineage (Wu et al., 2003; Lander et al., 2009), whereas ACTB inhibits expansion of the cells that give rise to INPs. These latter progenitors, which express Sox2and/or Ascl1, had previously been treated as two distinct populations – the Sox2+stem and Ascl1+transit-amplifying cell stages (Calof et al., 2002; Kawauchi et al., 2004; Beites et al., 2005; Kawauchi et al., 2005). However, the present study shows that basal compartment cells that express Sox2and/or Ascl1 contribute to both the ORN and Sus cell populations, arguing that the fluctuating expression of Fig. 7. ActBand GDF11modulate stem cell fates. (A-C)Cells in three marker categories (SOX2+, black;
ASCL1+, white; SOX2+; ASCL1+, gray)
were quantified for (A) total OE, (B) basal stem/progenitor cell
compartment and (C) apical sustentacular cell compartment. The height of each shaded segment in a bar indicates the total number of cells/mm OE for that category. The percentage of cells in a given compartment [±error (root mean square)] for each marker category is indicated. *, P≤0.05 (DT) compared with wild type. A, ActB; G, Gdf11. (D)z-stack image (0.3m spacing) of SOX2 and cytokeratin 18 IF. White arrowheads indicate a Sus cell that is SOX2+; CYT18+. (E)Sus cultures were
treated with ACTB (20 ng/ml) or GDF11 (20 ng/ml). BrdU (1:10,000) was added for the final 24 hours in vitro. Bar charts show mean ±s.e.m. (*, P≤0.05, Student’s t-test). White arrowheads in the magnified image point to BrdU+CYT18+cells. Ph, phase
contrast image; BL, basal lamina; Sus, sustentacular layer.
D
E
V
E
LO
P
M
E
N
these genes denotes a single population of bipotent stem/progenitor cells in a dynamic state. If these cells migrate apically and Sox2 expression is maintained then they commit to a glial (Sus) fate (Figs 5-7). An interplay between SOX2 and bHLH transcription factors (such as ASCL1) in the establishment of neuronal versus glial identity has been seen in other instances (reviewed by Pevny and Placzek, 2005; Wegner and Stolt, 2005; Kondoh and Kamachi, 2010), but the results reported here show for the first time that the outcomes of that interplay are controlled by feedback provided by TGFsuperfamily signaling molecules.
Altogether, our view of a dynamic stem/progenitor cell population in the OE is consistent with recent data in a variety of stem cell systems suggesting that the transition between stem and transit-amplifying cells is neither sharp nor irreversible (Xi and Xie, 2005; Zipori, 2005; Clayton et al., 2007; Frye et al., 2007; Jones et al., 2007), as well as with evidence that bipotential progenitor cells often co-express genes that specify mutually exclusive cell fates (a phenomenon sometimes called transcriptional priming) (Laslo et al., 2006; Glauche et al., 2007). An indication of these phenomena might in fact have been seen in experiments in which the OE of adult rodents was subjected to extensive damage: in some such cases, cells that do not normally participate in the ORN lineage, such as squamous ‘horizontal basal epithelial cells’, were able to contribute to the progenitor cell pool, and at least some of their progeny became ORNs (Huard et al., 1998; Jang et al., 2003; Leung et al., 2007; Iwai et al., 2008). Such findings argue that the stem/progenitor cell population of the OE is not fixed, and that production of neurons remains sensitive to environmental cues long after development has ceased.
Analysis of the production of Sus cells in Gdf11–/–, ActB–/–and double-mutant mice, together with results from Sus cell cultures, indicate that ACTB biases the OE bipotential stem/progenitor cell toward a glial fate, whereas GDF11 biases it toward the production of neurons (Fig. 5, Fig. 7). Although there were some indications from prior studies that OE stem cells might share properties with Sus cell progenitors (Murray et al., 2003), we were surprised to find that ASCL1+cells can give rise to Sus cells, especially because previous reports from us and others indicated that Ascl1 expression marks cells committed to the neuronal lineage in the OE (Gordon et al., 1995; Cau et al., 1997; Shou et al., 1999; Shou et al., 2000; Tomita et al., 2000; Cau et al., 2002). However, our finding that Ascl1-expressing cells can be progenitors for both ORNs and Sus cells brings the OE into line with the findings from recent studies of the
developing central nervous system, where it has been shown that Ascl1is expressed by subsets of progenitor cells that can give rise to glia, as well as neurons, in regions as diverse as the subventricular zone, spinal cord and corpus callosum (Parras et al., 2004; Battiste et al., 2007; Kim et al., 2007; Kim et al., 2008).
Importantly, our findings with ActB–/–, Gdf11–/– and ActB–/–;Gdf11–/–mutant mice demonstrate that it is the signaling environment that controls the balance of glial versus neuronal commitment by stem/progenitor cells in the OE. In addition, our observation that GDF11 and ACTB influence stem and progenitor cell fate, as well as proliferation, reconciles the actions of these factors in the OE with those that we have identified in other parts of the nervous system, such as the retina, where loss of GDF11 leads to alterations in cell fate without detectable changes in proliferation (Kim et al., 2005).
Direct versus indirect actions of ACTB and GDF11 Because both proliferation and differentiation within the OE lineage are influenced by feedback (Lander et al., 2009), distinguishing direct from indirect phenotypic effects can be challenging. With respect to ACTB, we can be reasonably confident that its influence on fate choice by bipotential stem/progenitor cells is direct. Supporting data include: (1) in vitro, ACTB acts directly on ASCL1+ cells to block their development (Fig. 3E), whereas it enhances development of Sus cells (Fig. 7E); (2) loss of ActBfunction in vivo leads to an increase in the proportion and number of basal progenitor cells that express ASCL1 (with or without concomitant expression of SOX2; Fig. 2, Fig. 7B, see Table S1 in the supplementary material); (3) ACTB has no observable effects on INPs, in vitro (Fig. 3C) or in vivo (Fig. 3D); and (4) ActBhas no observable effect on the proliferation index of differentiated Sus cells (Fig. 5E).
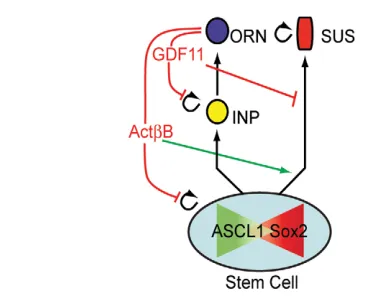
[image:10.612.53.237.55.204.2]With respect to GDF11, previous work showed that it acts directly on INPs both to decrease their rate of cell division and increase their probability of differentiating into ORNs (Wu et al., 2003; Lander et al., 2009). Here, we have uncovered an additional role for GDF11 in the Sus lineage: GDF11 inhibits the development of Sus cells in vitro (Fig. 7C,E) and loss of Gdf11function leads to an increase in Sus cell number in vivo (Fig. 5). If GDF11, like ACTB, acts directly on stem/progenitor cells, then it will be necessary to figure out how two molecules that ostensibly utilize the same SMAD2/3 signaling pathway (Oh et al., 2002; Feng and Derynck, 2005) exert opposite effects on the same cell type, one imposing a bias toward glial fate and the other a bias toward neuronal fate. The alternative is that some or all of the effects of GDF11 on stem/progenitor cells are indirect, mediated through changes brought about by GDF11 in the numbers and proportions of INPs and ORNs. For example, if INPs produce a signal that acts on stem/progenitor cells to bias their progeny toward Sus fates, this could explain why Sus cell numbers rise in Gdf11 mutants (i.e. the effect is an indirect consequence of the overproduction of INPs in these animals). Although we have no direct evidence for such a mechanism, this hypothesis brings to mind the known actions of Notch signaling in other systems. Indeed, Notch signals provided by neuronal cells are often used to drive progenitors toward non-neuronal fates – a feedback mechanism that ensures the production of neuronal and non-neuronal cells in balanced proportions (Gaiano and Fishell, 2002; Kageyama et al., 2005; Karcavich, 2005). As multiple Notch ligands and receptors are expressed in the OE (Lindsell et al., 1996; Cau et al., 2000; Doi et al., 2004; Manglapus et al., 2004; Carson et al., 2006; Orita et al., 2006; Schwarting et al., 2007), this idea merits future investigation. Interestingly, Notch2has recently been shown to be important for the maintenance of Sus cells in adult OE (Rodriguez et al., 2008). Fig. 8. Schematic of OE lineages showing distinct roles for GDF11
and ACTB feedback.In the ORN pathway, GDF11 feedback limits INP proliferation, whereas ACTB feedback inhibits proliferation of stem cells that give rise to INPs. In the Sus pathway, GDF11 antagonizes, whereas ACTB promotes, stem cell development into Sus cells.
D
E
V
E
LO
P
M
E
N
Implications for the control of lineage progression and regeneration
The experiments presented here underscore the importance of feedback control in developing neural tissues. In most of the nervous system, where the capacity for neurogenesis declines precipitously over the course of development (Kauffman, 1968; Caviness et al., 1995; Brazel and Rao, 2004; Galvan and Jin, 2007; Gould, 2007), investigations with the goal of identifying conditions that promote regeneration in the adult nervous system have focused on finding factors that stimulate stem cell self-renewal and expansion (Doetsch et al., 2002; Lennington et al., 2003; Zheng et al., 2004). The work presented here, together with a growing body of literature in other tissues (Lee and McPherron, 2001; Gamer et al., 2003; Falk et al., 2008; Manceau et al., 2008), suggest that the management of feedback signals that inhibit self-renewal and cell-cycle progression and that bias cell fate decisions might be a much more important strategy in understanding how to create conditions permissive for neural regeneration and repair.
In addition, the findings we present indicate that there is a close connection between the signals involved in the control of tissue size and those that regulate the proportions of cells of different types within a given tissue. This is likely to be a key concept in understanding stem cell-based lineages in general: increasing evidence that feedback signals and cell-cell interactions control the diversity of cell types produced by stem cell lineages can be found in tissue and organ systems as diverse as Drosophilagut and central nervous system (Ohlstein and Spradling, 2007; Baumgardt et al., 2009), nematode genitalia (e.g. Yu et al., 2009) and vertebrate spinal cord and retina (Reh, 1987; Eisen, 1992; Kim et al., 2005). Indeed, one of the feedback regulators analyzed in the present study, GDF11, also plays a major role in determining the proportions of different neural cell types produced by the mammalian retina (Kim et al., 2005).
Acknowledgements
We thank R. R. Reed for Ascl1GFP/+mice and J. E. Schwob for anti-SUS4 antibody.
Funding
This work was supported by grants from the NIH to A.L.C. (DC03583), A.D.L. (GM076516), M.M.M. (HD32067) and J.E.J. (NS032817). K.K.G. was supported by NS07444 and GM08620 and UCI’s MSTP program. Deposited in PMC for release after 12 months.
Competing interests statement
The authors declare no competing financial interests.
Supplementary material
Supplementary material for this article is available at
http://dev.biologists.org/lookup/suppl/doi:10.1242/dev.065870/-/DC1
References
Andersson, O., Reissmann, E. and Ibanez, C. F.(2006). Growth differentiation factor 11 signals through the transforming growth factor-beta receptor ALK5 to regionalize the anterior-posterior axis. EMBO Rep.7, 831-837.
Attisano, L., Wrana, J. L., Montalvo, E. and Massague, J.(1996). Activation of signalling by the activin receptor complex. Mol. Cell. Biol. 16, 1066-1073. Battiste, J., Helms, A. W., Kim, E. J., Savage, T. K., Lagace, D. C., Mandyam, C.
D., Eisch, A. J., Miyoshi, G. and Johnson, J. E.(2007). Ascl1 defines sequentially generated lineage-restricted neuronal and oligodendrocyte precursor cells in the spinal cord. Development134, 285-293.
Baumgardt, M., Karlsson, D., Terriente, J., Diaz-Benjumea, F. J. and Thor, S. (2009). Neuronal subtype specification within a lineage by opposing temporal feed-forward loops. Cell139, 969-982.
Beites, C. L., Kawauchi, S., Crocker, C. E. and Calof, A. L.(2005). Identification and molecular regulation of neural stem cells in the olfactory epithelium. Exp. Cell Res.306, 309-316.
Brazel, C. Y. and Rao, M. S.(2004). Aging and neuronal replacement. Ageing Res. Rev.3, 465-483.
Calof, A. L. and Chikaraishi, D. M.(1989). Analysis of neurogenesis in a mammalian neuroepithelium: proliferation and differentiation of an olfactory neuron precursor in vitro. Neuron3, 115-127.
Calof, A. L., Bonin, A., Crocker, C. E., Kawauchi, S., Murray, R., Shou, J. and Wu, H. H.(2002). Progenitor cells of the olfactory receptor neuron lineage. Microsc. Res. Tech.58, 176-188.
Carson, C., Murdoch, B. and Roskams, A. J.(2006). Notch 2 and Notch 1/3 segregate to neuronal and glial lineages of the developing olfactory epithelium. Dev. Dyn.235, 1678-1688.
Cau, E., Gradwohl, G., Fode, C. and Guillemot, F.(1997). Mash1 activates a cascade of bHLH regulators in olfactory neuron progenitors. Development124, 1611-1621. Cau, E., Gradwohl, G., Casarosa, S., Kageyama, R. and Guillemot, F.(2000). Hes
genes regulate sequential stages of neurogenesis in the olfactory epithelium. Development127, 2323-2332.
Cau, E., Casarosa, S. and Guillemot, F.(2002). Mash1 and Ngn1 control distinct steps of determination and differentiation in the olfactory sensory neuron lineage. Development129, 1871-1880.
Caviness, V. S., Jr, Takahashi, T. and Nowakowski, R. S.(1995). Numbers, time and neocortical neuronogenesis: a general developmental and evolutionary model. Trends Neurosci.18, 379-383.
Chang, H., Brown, C. W. and Matzuk, M. M.(2002). Genetic analysis of the mammalian transforming growth factor-{beta} superfamily. Endocr. Rev.23, 787-823.
Chen, X., Fang, H. and Schwob, J. E.(2004). Multipotency of purified, transplanted globose basal cells in olfactory epithelium. J. Comp. Neurol. 469, 457-474. Clayton, E., Doupe, D. P., Klein, A. M., Winton, D. J., Simons, B. D. and Jones, P.
H.(2007). A single type of progenitor cell maintains normal epidermis. Nature446, 185-189.
DeHamer, M. K., Guevara, J. L., Hannon, K., Olwin, B. B. and Calof, A. L. (1994). Genesis of olfactory receptor neurons in vitro: Regulation of progenitor cell divisions by fibroblast growth factors. Neuron13, 1083-1097.
Doetsch, F., Petreanu, L., Caille, I., Garcia-Verdugo, J. M. and Alvarez-Buylla, A. (2002). EGF converts transit-amplifying neurogenic precursors in the adult brain into multipotent stem cells. Neuron36, 1021-1034.
Doi, K., Ishida, H. and Nibu, K.(2004). Notch expression in developing olfactory neuroepithelium. NeuroReport 15, 945-947.
Eisen, J. S.(1992). The role of interactions in determining cell fate of two identified motoneurons in the embryonic zebrafish. Neuron8, 231-240.
Falk, S., Wurdak, H., Ittner, L. M., Ille, F., Sumara, G., Schmid, M. T., Draganova, K., Lang, K. S., Paratore, C., Leveen, P. et al.(2008). Brain area-specific effect of TGF-beta signaling on Wnt-dependent neural stem cell expansion. Cell Stem Cell2, 472-483.
Fang, J., Wang, S.-Q., Smiley, E. and Bonadio, J.(1997). Genes coding for mouse activin Cand E are closely linked and exhibit a liver-specific expression pattern in adult tissues. Biochem. Biophys. Res. Commun. 231, 655-661.
Farbman, A. I.(1992). Cell Biology of Olfaction.New York, NY, USA: Cambridge University Press.
Feng, G., Mellor, R. H., Bernstein, M., Keller-Peck, C., Nguyen, Q. T., Wallace, M., Nerbonne, J. M., Lichtman, J. W. and Sanes, J. R.(2000). Imaging neuronal subsets in transgenic mice expressing multiple spectral variants of GFP. Neuron28, 41-51.
Feng, X. H. and Derynck, R.(2005). Specificity and versatility in TGF-beta signaling through Smads. Annu. Rev. Cell Dev. Biol. 21, 659-693.
Frye, M., Fisher, A. G. and Watt, F. M.(2007). Epidermal stem cells are defined by global histone modifications that are altered by Myc-induced differentiation. PLoS ONE2, e763.
Gaiano, N. and Fishell, G.(2002). The role of notch in promoting glial and neural stem cell fates. Annu. Rev. Neurosci.25, 471-490.
Galvan, V. and Jin, K.(2007). Neurogenesis in the aging brain. Clin. Interv. Aging2, 605-610.
Gamer, L. W., Nove, J. and Rosen, V.(2003). Return of the chalones. Dev. Cell4, 143-144.
Glantz, S. A.(2005).Primer of Biostatistics.New York: McGraw-Hill.
Glauche, I., Cross, M., Loeffler, M. and Roeder, I.(2007). Lineage specification of hematopoietic stem cells: mathematical modeling and biological implications. Stem Cells25, 1791-1799.
Gokoffski, K. K., Kawauchi, S., Wu, H.-H., Santos, R., Hollenbeck, P. L. W., Lander, A. D. and Calof, A. L.(2009). Feedback regulation of neurogenesis in the mammalian olfactory epithelium: New insights from genetics and systems biology. In The Neurobiology of Olfaction(ed. A. Menini), pp. 241-265. Boca Raton, FL: CRC Press.
Goldstein, B. J. and Schwob, J. E.(1996). Analysis of the globose basal cell compartment in rat olfactory epithelium using GBC-1, a new monoclonal antibody against globose basal cells. J. Neurosci. 16, 4005-4016.
Gordon, M. K., Mumm, J. S., Davis, R. A., Holcomb, J. D. and Calof, A. L.(1995). Dynamics of MASH1 expression in vitro and in vivo suggest a non-stem cell site of MASH1 action in the olfactory receptor neuron lineage. Mol. Cell. Neurosci.6, 363-379.
Gould, E.(2007). How widespread is adult neurogenesis in mammals?Nat. Rev. Neurosci.8, 481-488.
Guillemot, F., Lo, L. C., Johnson, J. E., Auerbach, A., Anderson, D. J. and Joyner, A. L.(1993). Mammalian achaete-scute homolog 1 is required for the early
development of olfactory and autonomic neurons. Cell75, 463-476.
D
Guo, Z., Packard, A., Krolewski, R. C., Harris, M. T., Manglapus, G. L. and Schwob, J. E.(2010). Expression of pax6 and sox2 in adult olfactory epithelium. J. Comp. Neurol.518, 4395-4418.
Huard, J. M., Youngentob, S. L., Goldstein, B. J., Luskin, M. B. and Schwob, J. E. (1998). Adult olfactory epithelium contains multipotent progenitors that give rise to neurons and non-neural cells. J. Comp. Neurol.400, 469-486.
Iwai, N., Zhou, Z., Roop, D. R. and Behringer, R. R.(2008). Horizontal basal cells are multipotent progenitors in normal and injured adult olfactory epithelium. Stem Cells. 26, 1298-1306.
Jang, W., Youngentob, S. L. and Schwob, J. E.(2003). Globose basal cells are required for reconstitution of olfactory epithelium after methyl bromide lesion. J. Comp. Neurol.460, 123-140.
Jang, W., Lambropoulos, J., Woo, J. K., Peluso, C. E. and Schwob, J. E.(2008). Maintaining epitheliopoietic potency when culturing olfactory progenitors. Exp. Neurol. 214, 25-36.
Jones, P. H., Simons, B. D. and Watt, F. M.(2007). Sic transit gloria: farewell to the epidermal transit amplifying cell? Cell Stem Cell1, 371-381.
Kageyama, R., Ohtsuka, T., Hatakeyama, J. and Ohsawa, R.(2005). Roles of bHLH genes in neural stem cell differentiation. Exp. Cell Res.306, 343-348. Karcavich, R. E.(2005). Generating neuronal diversity in the Drosophila central
nervous system: a view from the ganglion mother cells. Dev. Dyn.232, 609-616. Kauffman, S. L.(1968). Lengthening of the generation cycle during embryonic
differentiation of the mouse neural tube. Exp. Cell Res.49, 420-424.
Kawauchi, S., Beites, C. L., Crocker, C. E., Wu, H. H., Bonnin, A., Murray, R. and Calof, A. L.(2004). Molecular signals regulating proliferation of stem and progenitor cells in mouse olfactory epithelium. Dev. Neurosci.26, 166-180. Kawauchi, S., Shou, J., Santos, R., Hebert, J. M., McConnell, S. K., Mason, I.
and Calof, A. L.(2005). Fgf8 expression defines a morphogenetic center required for olfactory neurogenesis and nasal cavity development in the mouse. Development132, 5211-5223.
Kawauchi, S., Kim, J., Santos, R., Wu, H. H., Lander, A. D. and Calof, A. L. (2009). Foxg1 promotes olfactory neurogenesis by antagonizing Gdf11. Development136, 1453-1464.
Kim, E. J., Leung, C. T., Reed, R. R. and Johnson, J. E.(2007). In vivo analysis of Ascl1 defined progenitors reveals distinct developmental dynamics during adult neurogenesis and gliogenesis. J. Neurosci. 27, 12764-12774.
Kim, E. J., Battiste, J., Nakagawa, Y. and Johnson, J. E.(2008). Ascl1 (Mash1) lineage cells contribute to discrete cell populations in CNS architecture. Mol. Cell. Neurosci.38, 595-606.
Kim, E. J., Ables, J. L., Dickel, L. K., Eisch, A. J. and Johnson, J. E.(2011). Ascl1 (Mash1) defines cells with long-term neurogenic potential in subgranular and subventricular zones in adult mouse brain. PLoS ONE6, e18472.
Kim, J., Wu, H.-H., Lander, A. D., Lyons, K. M., Matzuk, M. M. and Calof, A. L. (2005). GDF11 controls the timing of progenitor cell competence in developing retina. Science308, 1927-1930.
Kirouac, D. C., Madlambayan, G. J., Yu, M., Sykes, E. A., Ito, C. and Zandstra, P. W.(2009). Cell-cell interaction networks regulate blood stem and progenitor cell fate. Mol. Syst. Biol. 5, 293.
Kondoh, H. and Kamachi, Y.(2010). SOX-partner code for cell specification: regulatory target selection and underlying molecular mechanisms. Int. J. Biochem. Cell Biol. 42, 391-399.
Lander, A. D., Gokoffski, K. K., Wan, F. Y., Nie, Q. and Calof, A. L.(2009). Cell lineages and the logic of proliferative control. PLoS Biol. 7, e15.
Laslo, P., Spooner, C. J., Warmflash, A., Lancki, D. W., Lee, H. J., Sciammas, R., Gantner, B. N., Dinner, A. R. and Singh, H.(2006). Multilineage transcriptional priming and determination of alternate hematopoietic cell fates. Cell126, 755-766. Lee, S.-J. and McPherron, A. C.(2001). Regulation of myostatin activity and muscle
growth. Proc. Natl. Acad. Sci. USA 98, 9306-9311.
Lennington, J. B., Yang, Z. and Conover, J. C.(2003). Neural stem cells and the regulation of adult neurogenesis. Reprod. Biol. Endocrinol.1, 99.
LeSauter, J., Yan, L., Vishnubhotla, B., Quintero, J. E., Kuhlman, S. J., McMahon, D. G. and Silver, R.(2003). A short half-life GFP mouse model for analysis of suprachiasmatic nucleus organization. Brain Res.964, 279-287. Leung, C. T., Coulombe, P. A. and Reed, R. R.(2007). Contribution of olfactory
neural stem cells to tissue maintenance and regeneration.Nat. Neurosci.10, 720-726.
Lindsell, C. E., Boulter, J., diSibio, G., Gossler, A. and Weinmaster, G.(1996). Expression patterns of Jagged, Delta1, Notch1, Notch2, and Notch3 genes identify ligand-receptor pairs that may function in neural development. Mol. Cell. Neurosci. 8, 14-27.
Manceau, M., Gros, J., Savage, K., Thome, V., McPherron, A., Paterson, B. and Marcelle, C.(2008). Myostatin promotes the terminal differentiation of embryonic muscle progenitors. Genes Dev.22, 668-681.
Manglapus, G. L., Youngentob, S. L. and Schwob, J. E.(2004). Expression patterns of basic helix-loop-helix transcription factors define subsets of olfactory progenitor cells. J. Comp. Neurol.479, 216-233.
Matulionis, D. H.(1976). Light and electron microscopic study of the degeneration and early regeneration of olfactory epithelium in the mouse. Am. J. Anat.145, 79-99.
Murray, R. C., Navi, D., Fesenko, J., Lander, A. D. and Calof, A. L.(2003). Widespread defects in the primary olfactory pathway caused by loss of Mash1 function. J. Neurosci. 23, 1769-1780.
Oh, S. P., Yeo, C.-Y., Lee, Y., Schrewe, H., Whitman, M. and Li, E.(2002). Activin type IIA and IIB receptors mediate Gdf11 signaling in axial vertebral patterning. Genes Dev. 16, 2749-2754.
Ohlstein, B. and Spradling, A.(2007). Multipotent Drosophila intestinal stem cells specify daughter cell fates by differential notch signaling. Science315, 988-992. Okabe, M., Ikawa, M., Kominami, K., Nakanishi, T. and Nishimune, Y.(1997).
‘Green mice’ as a source of ubiquitous green cells. FEBS Lett.407, 313-319. Orita, Y., Nagatsuka, H., Tsujigiwa, H., Yoshinobu, J., Maeda, Y., Kakiuchi, M.,
Orita, S., Takeuchi, A., Takeda, Y., Fukushima, K. et al.(2006). Expression of Notch1 and Hes5 in the developing olfactory epithelium. Acta Oto-Laryngol.126, 498-502.
Parras, C. M., Galli, R., Britz, O., Soares, S., Galichet, C., Battiste, J., Johnson, J. E., Nakafuku, M., Vescovi, A. and Guillemot, F.(2004). Mash1 specifies neurons and oligodendrocytes in the postnatal brain. EMBO J.23, 4495-4505.
Pevny, L. and Placzek, M.(2005). SOX genes and neural progenitor identity.Curr. Opin. Neurobiol.15, 7-13.
Pixley, S. K.(1992). Purified cultures of keratin-positive olfactory epithelial cells: identification of a subset as neuronal supporting (sustentacular) cells. J. Neurosci. Res.31, 693-707.
Reavie, L., Della Gatta, G., Crusio, K., Aranda-Orgilles, B., Buckley, S. M., Thompson, B., Lee, E., Gao, J., Bredemeyer, A. L., Helmink, B. A. et al.(2010). Regulation of hematopoietic stem cell differentiation by a single ubiquitin ligase-substrate complex.Nat. Immunol.11, 207-215.
Reh, T. A.(1987). Cell-specific regulation of neuronal production in the larval frog retina. J. Neurosci. 7, 3317-3324.
Rock, K. L., Gramm, C., Rothstein, L., Clark, K., Stein, R., Dick, L., Hwang, D. and Goldberg, A. L.(1994). Inhibitors of the proteasome block the degradation of most cell proteins and the generation of peptides presented on MHC class I molecules. Cell78, 761-771.
Rodriguez, S., Sickles, H. M., DeLeonardis, C., Alcaraz, A., Gridley, T. and Lin, D. M.(2008). Notch2 is required for maintaining sustentacular cell function in the adult mouse main olfactory epithelium. Dev. Biol. 314, 40-58.
Schneyer, A. L., Sidis, Y., Gulati, A., Sun, J. L., Keutmann, H. and Krasney, P. A. (2008). Differential antagonism of activin, myostatin and growth and differentiation factor 11 by wild-type and mutant follistatin. Endocrinology149, 4589-4595. Schwarting, G. A., Gridley, T. and Henion, T. R.(2007). Notch1 expression and
ligand interactions in progenitor cells of the mouse olfactory epithelium. J. Mol. Histol.38, 543-553.
Shou, J., Rim, P. C. and Calof, A. L.(1999). BMPs inhibit neurogenesis by a mechanism involving degradation of a transcription factor.Nat. Neurosci.2, 339-345.
Shou, J., Murray, R. C., Rim, P. C. and Calof, A. L.(2000). Opposing effects of bone morphogenetic proteins on neuron production and survival in the olfactory receptor neuron lineage. Development127, 5403-5413.
Shraiman, B. I.(2005). Mechanical feedback as a possible regulator of tissue growth. Proc. Natl. Acad. Sci. USA102, 3318-3323.
Sidis, Y., Mukherjee, A., Keutmann, H., Delbaere, A., Sadatsuki, M. and Schneyer, A.(2006). Biological activity of follistatin isoforms and follistatin-like-3 is dependent on differential cell surface binding and specificity for activin, myostatin, and bone morphogenetic proteins. Endocrinology147, 3586-3597.
Tomita, K., Moriyoshi, K., Nakanishi, S., Guillemot, F. and Kageyama, R.(2000). Mammalian achaete-scute and atonal homologs regulate neuronal versus glial fate determination in the central nervous system. EMBO J.19, 5460-5472.
Tsuchida, K., Nakatani, M., Uezumi, A., Murakami, T. and Cui, X.(2008). Signal transduction pathway through activin receptors as a therapeutic target of musculoskeletal diseases and cancer. Endocr. J.55, 11-21.
Vassalli, A., Matzuk, M. M., Gardner, H. A., Lee, K. F. and Jaenisch, R.(1994). Activin/inhibin beta B subunit gene disruption leads to defects in eyelid development and female reproduction. Genes Dev. 8, 414-427.
Wegner, M. and Stolt, C. C.(2005). From stem cells to neurons and glia: a Soxist’s view of neural development. Trends Neurosci.28, 583-588.
Weiler, E. and Farbman, A. I.(1998). Supporting cell proliferation in the olfactory epithelium decreases postnatally. Glia22, 315-328.
Wu, H.-H., Ivkovic, S., Murray, R. C., Jaramillo, S., Lyons, K. M., Johnson, J. E. and Calof, A. L.(2003). Autoregulation of neurogenesis by GDF11. Neuron37, 197-207.
Xi, R. and Xie, T.(2005). Stem cell self-renewal controlled by chromatin remodeling factors. Science310, 1487-1489.
Yu, H., Seah, A., Herman, M. A., Ferguson, E. L., Horvitz, H. R. and Sternberg, P. W.(2009). Wnt and EGF pathways act together to induce C. elegans male hook development. Dev. Biol. 327, 419-432.
Zheng, W., Nowakowski, R. S. and Vaccarino, F. M.(2004). Fibroblast growth factor 2 is required for maintaining the neural stem cell pool in the mouse brain subventricular zone. Dev. Neurosci.26, 181-196.
Zipori, D.(2005). The stem state: plasticity is essential, whereas self-renewal and hierarchy are optional. Stem Cells23, 719-726.