IJPSR (2016), Vol. 7, Issue 4 (Research Article)
Received on 01 November, 2015; received in revised form, 23 December, 2015; accepted, 22 January, 2016; published 01 April, 2016
METHOD DEVELOPMENT AND VALIDATION OF STABILITY INDICATING METHOD FOR ANALYSIS OF LOSARTAN POTASSIUM IN BULK DRUG AND DOSAGE FORM FORMULATION
Elsadig H. Rudwan *1, Amna B. W. E Mohammed Hussien 2 and Ahmed E. M. Saeed 3
Amipharma Laboratories Ltd 1, Khartoum, Sudan.
College of Animal Production science and Technology 2, Sudan University of Science and Technology, Sudan.
Department of Chemistry 3, College of Science, Sudan University of Science and Technology, Sudan.
ABSTRACT: Losartan potassium in tablet dosage form, separation achieved with C 18 column (Kromasil 100-5C18250mm x4.6mm E82860 i.d., 5µm particle), ambient temperature with isocratic mode with mobile phase containing 40:60 Acetonitrile: Buffer consist of 10.5mM of disodium hydrogen phosphate and 10mM potassium dihydrogen phosphate, pH 3.5 adjusted by 10 % Orthophosphoric acid and at flow rate 1.0ml/minute the eluent was monitored at 250nm. The selected chromatographic conditions were found to be effectively separate Losartan potassium 9.98min. The proposed method was found to be linear over the range of 6.4-9.6µg/ml. The drug was subjected to oxidation, acid, alkaline, photolysis and heat stress conditions for degradation. The method was validated for specificity, linearity, accuracy, robustness and solution stability.
INTRODUCTION: According to an FDA guidance document, a stability-indicating method is “a validated quantitative analytical procedure that can detect the changes with time in the pertinent properties of the drug substance and drug product. A stability-indicating method accurately measures the active ingredients, without interference from degradation products, process impurities, excipients, or other potential impurities 7. Information on the stability of the drug substance is an integral part of the systematic approach to stability evaluation.
QUICK RESPONSE CODE
DOI:
10.13040/IJPSR.0975-8232.7(4).1413-21
Article can be accessed online on:
www.ijpsr.com
DOI link: http://dx.doi.org/10.13040/IJPSR.0975-8232.7 (4).1413-21
Stress testing (or forced degradation studies) is a critical component of the drug development process. The ICH guideline indicates that stress testing is designed to help “determine the intrinsic stability of the molecule by establishing degradation pathways in order to identify the likely degradation products and to validate the stability indicating power of the analytical procedures used. Stress testing also is becoming increasingly important in testing new molecules. Methods developed by stress testing and the stability information gained from those methods can have a significant effect on the actual compound selected for development
Literature review revealed that several methods have been reported for analysis of the drug in pharmaceutical formulation alone or with other drugs in combination. USP described HPLC
Key words:
Losartan potassium, reversed phase HPLC, Experimental design, stress
condition, validation Correspondence to Author: Elsadig H. Rudwan
Amipharma Laboratories Ltd, Khartoum, Sudan
method for assay and impurities of Losartan potassium, Valsartan and their impurities B, C (RP-HPLC), Valsartan impurity a (normal phase HPLC) and Irbesartan (ion pair HPLC), ion pair HPLC for Telmisartan.
BP described a potentiometric titration for assay of Losartan potassium. For impurities BP used a gradient RP-HPLC for Losartan potassium, some methods have been published for simultaneous determination of studied ARA-II-drugs including 8. Losartan potassium is chemically:2-butyl-4-chloro-1-[[2’-(1H-tetrazol-5-yl) [1, 1’-biphenyl]-4-yl] methyl]-1H-imidazole-5-methanol monopotassium salt. Losartan is a phenyl tetrazole substituted imidazole compound which acts as a selective, angiotensin II receptor type I antagonist and is employed in the management of essential hypertension 2, 3.
Losartan potassium is white to off white crystalline powder, it is freely soluble in water, soluble in alcohols, and slightly soluble in common organic solvents, such as acetonitrile and methyl ethyl ketone.
FIG.1: LOSARTAN POTASSIUM
The aim of this work, we report the development and validation of a stability indicating LC method for determination Losartan potassium in pharmaceutical dosage form. It separates drug components from degradation products under ICH
suggested stress conditions (acid base hydrolysis, oxidation, photolysis and thermal stress) 4.
The target in developing the stability indicating method is to achieve the resolution between the losartan potassium and its degradation products. Our goal of chromatographic method development was to achieve peak tailing factor <2, retention time between 3 to 10min and capacity factor K >3.
Method validation study include system suitability, linearity, precision, accuracy, specificity, robustness, limit of detection, limit of quantification and stability of sample, reagents, instruments.
MATERIAL AND METHODS:
Instrument and Chromatographic equipment conditions:
Chromatographic separation was performed on SYKAM HPLC isocratic system equipped with a pump S1121 delivery system, variable- wavelength programmable UV-visible detector S3200, Auto sampler S5200 sample iniector, and software chromostar version 6.35. Samples (20µL) were injected using 20 µL loops; compound separated on
column Kromasil
250x4.6mm100-5C1825cmx4.6mm E82860i.d., 5µm particle .The mobile phase was 40:60 ACN: Buffer consist of 10.5mM of disodium hydrogen phosphate and 10mM potassium dihydrogen phosphate, pH 3.5 adjusted by 10 % Orthophosphoric acid and at flow rate 1.0ml/minute theeluent was monitored at 250nm.
Reagents and Chemicals:
HPLC grade of potassium dihydrogen phosphate, disodium hydrogen phosphate, orthophosphoric acid, acetonitrile 99.99%, methanol, Sodium hydroxide, hydrogen peroxide and losartan potassium working standard 99.85% from GPT Company India. The commercial formulation of losartan potassium from local market.
Preparation of mobile phase and stock solution: Mobile phase: The mobile phase containing 40:60 Acetonitrile: Buffer consist of 10.5mM of
disodium hydrogen phosphate and 10mM
sonicated for 10min and filtrate through 0.45µm membrane filter which is used as a mobile phase.
Stock solution (1000µg/ml) -stock solutions were prepared by weighing 100mg of losartan potassium, the weighed drug was transferred into 100ml volumetric flask and adjust the volume to the mark with methanol , sonicate for 10 min and filtrate.
Working standard solutions ( 8µg/ml)- take 0.2ml solution from stock solution and transfer into 25 ml volumetric flask, the volume was completed to the mark with diluent.
The HPLC analysis was performed on reversed phase high performance liquid chromatography system with isocratic elution mode using a mobile phase of acetonitrile: buffer of 10.5mM of
disodium hydrogen phosphate and 10mM
potassium dihydrogen phosphate( 40:60) on
Kromasil 250x4.6mm100-5 C1825cmx4.6mm
E82860i.d., 5µm particle , with 1.0ml/min flow rate at 250nm using UV detector.
Preparation of degradation samples:
The effect of acid and base on instability of losartan potassium:
Accurately weight 54.63mg of losartan potassium and transferred into 100 volumetric flask, to it 10ml of water was added and sonicateted for 15 minutes with intermittent shaking. To it 5 ml of 1M of HCl was added and 5ml of 1M NaOH were added separately. The sample was heated on boiling water bath for 45 minutes, cool to room temperature and diluted to volume with diluent, mixed well. The acidic degradation and the alkaline forced degradation was performed in dark in order to exclude the possible degradation effect of light. This solution was filtered through 0.45um filter, 5ml of the filtrate was transferred to 25 ml volumetric flask, diluted to volume with diluent(9:1) acetonitrile and water, mixed well and injected into the HPLC system.
Effect of UV radiation on losartan potassium: Accurately weight 54.63mg of losartan potassium and transferred into 100 volumetric flask, to it 10ml of water was added and sonicateted for 15 minutes with intermittent shaking. Kept in UV 254nm (UV
radiation for 16hours), completed to the mark with diluent. This solution was filtered through 0.45um filter, 5ml of the filtrate was transferred to 25 ml volumetric flask, diluted to volume with diluent(9:1) acetonitrile and water, mixed well and injected into the HPLC system.
Effect of hydrogen peroxide on losartan potassium:
Accurately weight 54.63mg of losartan potassium and transferred into 100 volumetric flask, to it 10ml of water was added and sonicateted for 15 minutes with intermittent shaking. To it 5 ml of 3% H2O2 was added. The sample was heated on boiling water bath for 45 minutes, cool to room temperature and diluted to volume with diluent, mixed well. This solution was filtered through 0.45um filter, 5ml of the filtrate was transferred to 25 ml volumetric flask, diluted to volume with diluent(9:1) acetonitrile and water, mixed well and injected into the HPLC system.
RESULTS AND DISCISSION:
Optimization of Chromatographic Condition: The Chromatographic method development for the determination of Losartan potassium was optimized by applying factorial design experiment.
Effect of column type:
To have good separation of degradation products, we used a stationary phase. This column was found optimum hence; it become the column of work study. The bests electivity was observed on a C18 based stationary phase. The chromatographic
(Kromasil250x4.6mm100-5C1825cmx4.6mm E82860i.d., 5µm particle).
Effect of mobile phase Mode:
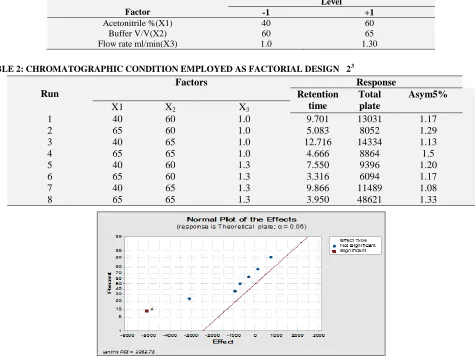
Change the composition of mobile phase optimized chromatographic method by applying factorial design approach. Opitimization experiments were conducted through a process of screening and optimization. The purpose of screening design is to identify the factors that have significant effects on the selected chromatographic responses, and for this purpose a factorial design 23 was used to develop a stability indicating method it was necessary to maintain proportion of the mobile phase Table 1, 2: (isocratic mode for determination losartan potassium peak was studied. Isocratic elution was firstly using different Acetonitrile ration with phosphate buffer pH 3.5.
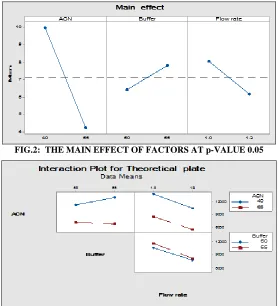
By Appling statistical software (SPSS 22, Minitab 17). Themodel was fit R=90.30 if we consider P –value 0.05 and standard deviation about 1.055,
acetonitrile has p-value 0.0066 is highly significant, but buffer composition no significant with respect to flow rate is mild affected the elution of peak.
The obtained adjusted R2 were within acceptable limit of R2≥0.80, indicating that the experimental data were a good fit to the equation 4.
Y = ß0+β1 X1 +β2X2+β3X3+ β4X1X2+ β5X2X3+ β6X1X3+ β7X1X2X3
Where, Y is the level of the measured response, ß0 is the intercept, β1 to β7 are the regression coefficients, X1, X2 and X3 stand for the main effects, X1 X2, X2 X3 and X1 X3 are the two- way interaction between the main effects and X1 X2 X3 is the three-way interact between the main effect.
As a result the optimized composition of the mobile phase Acetonitrile: buffer pH 3.5 40: 60v/v was selected.
TABLE 1: FACTORS LEVEL
[image:4.612.65.540.387.744.2]TABLE 2: CHROMATOGRAPHIC CONDITION EMPLOYED AS FACTORIAL DESIGN 23
FIG.1: RESOPNSE OF RETENTION TIME AT p-VALUE 0.05 Factor
Level
-1 +1
Acetonitrile %(X1) 40 60
Buffer V/V(X2) 60 65
Flow rate ml/min(X3) 1.0 1.30
Run
Factors Response
Retention time
Total plate
Asym5%
X1 X2 X3
1 40 60 1.0 9.701 13031 1.17
2 65 60 1.0 5.083 8052 1.29
3 40 65 1.0 12.716 14334 1.13
4 65 65 1.0 4.666 8864 1.5
5 40 60 1.3 7.550 9396 1.20
6 65 60 1.3 3.316 6094 1.17
7 40 65 1.3 9.866 11489 1.08
FIG.2: THE MAIN EFFECT OF FACTORS AT p-VALUE 0.05
FIG.3: THE INTERACTION OF FACTORS AT p-VALUE 0.05
Effect of wavelength:
The wavelength was important for detection of the components for HPLC as a detector. Losartan potassium have wavelength 250nm, this wavelength was selected as optimum wavelength.
Effect of Flow rate:
The flow rate of mobile phase was very important to achieved the good resolution between drug and its degradation products. 1.0ml/min was efficient to resolve all peaks within appropriate time about 20 min.
Method validation: 5, 6
Method validation is the process which to confirm that the analytical procedure employed for specific test is suitable for its intended use.
System suitability:
System suitability parameters were measured to confirm or verify the system performance. System precision was determined on six replicate injection
of standard preparation. All important
characteristics were measured, including peak resolution, capacity factor, tailing factor and theoretical plate.
Specificity:
Specificity is ability to assess unequivocally the analyte in the presence of compounds which may be present. The describe method was validated with respect to specificity, linearity, system suitability, accuracy, robustness, limit of detection (LOD) and limit of quantitation(LOQ).
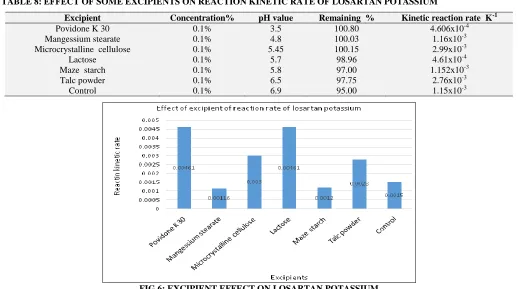
The excipients in the tablets contained the following in active ingredients: Microcrystalline cellulose, Povidone K 30, Maze starch, Magnesium stearate, Lactose and Talc powder as excipients, chromatograms of placebo solution showed no interference with the main peak of losartan potassium Table 9 and Fig. 6.
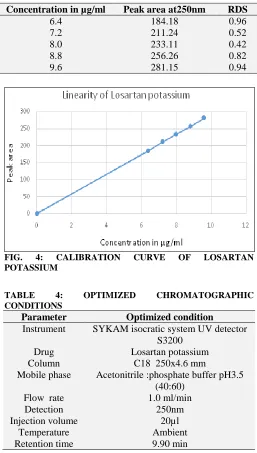
Linearity and calibration Curve:-
The linearity of analytical procedure is its ability( within a given range) to obtain test results which are directly proportional to the concentration ( amount) of analyte.
obtained by plotting peak area response against concentration of the drug. The equation of the calibration curve of losartan potassium y =29.87x-5.772, the graph was found to be linear with correlation coefficients 0.9998, standard error of intercept 4.512 and for slope 0.558.
Precision (repeatability):
The precision of analytical procedure expresses the closeness of agreement( degree of scatter) between a series of measurements obtained from multiple sampling of the same homogenous sample under prescribed conditions. Precision may be considered at three levels: repeatability, intermediate precision and reproducibility .Repeatability expresses the precision under the same operating conditions over a short interval time.
Accuracy:
The accuracy of analytical method is extent to which test results generated by method and true value agree. Accuracy of method was studied by recovery experiments. The accuracy of analytical procedure expresses the closeness of agreement between the value which is accepted either as a conventional true value or an accepted reference value and the value found.
The recovery was performed at three levels 80%,100% and 120% of the label claim of losartan potassium 50 mg, placebo equivalent to one tablet was transferred into 100ml volumetric flask and the amount of losartan potassium at 80,100 and 120% were added. Three levels were analyzed and the percentage recoveries were calculated from the calibration curve. The recovery value of losartan range from % to %,the average recovery and % RSD of three levels(nine determination) for losartan was 99.61%(1.068) RSD shown in parenthesis
Limit of detection and Quantitation (LOD and LOQ):
The detection limit of an individual analytical procedure is the lowest amount of analyte in the sample which can be detected but not necessary quantitated as exact value. The quantitation limit of an individual analytical procedure is the lowest amount of analyte in a sample which can be
quantitatively determined with suitable precision and accuracy.
The LOD of losartan potassium was 0.176µg/ml and LOQ was 0534µg/ml.
Robustness:
The robustness of analytical procedure is a measure of its capacity to remain unaffected by small but deliberate variations in method parameters and provides an indication of its reliability during normal usage. For the determination of method's robustness a number of chromatographic parameters (flow rate, buffer pH).
TABLE 3: CALIBRATION CURVE OF LOSARTAN
POTASSIUM
FIG. 4: CALIBRATION CURVE OF LOSARTAN
POTASSIUM
TABLE 4: OPTIMIZED CHROMATOGRAPHIC
CONDITIONS
Parameter Optimized condition
Instrument SYKAM isocratic system UV detector S3200
Drug Losartan potassium
Column C18 250x4.6 mm
Mobile phase Acetonitrile :phosphate buffer pH3.5 (40:60)
Flow rate 1.0 ml/min
Detection 250nm
Injection volume 20µl
Temperature Ambient
Retention time 9.90 min
Concentration in µg/ml Peak area at250nm RDS
6.4 184.18 0.96
7.2 211.24 0.52
8.0 233.11 0.42
8.8 256.26 0.82
[image:6.612.310.567.280.733.2]TABLE 5: REGRESSION CHARACTERISTIC AND SYSTEM SUITABILITY PARAMETERS OF PROPOSED METHOD
Parameter Losartan potassium
Retention time 9.90
Asymmetry 5% 1.10
Capacity factor 4.25
Theoretical plate 6828
Linearity µg/ml 6.4 -9.6
LOD µg/ml 0.176
LOQ µg/ml 0.534
Regression equation Y =29.87x-0.5154
Slope(m) 29.87
Intercept(c) 0.5154
Correlation coefficient ( r2 ) 0.9998
RSD 1.412
TABLE 6: ROBUSTNESS STUDY
Parameters RSD of peak area
Flow rate(ml/min)
0.9 1.175
1.0 0.778
1.1 0.485
Change the pH of buffer
3.4 1.96
3.5 0.70
3.6 0.96
TABLE 7: RESULTS OF THE RECOVERY TEST FOR THE LOSARTAN POTASSIUM
[image:7.612.47.565.452.741.2]TABLE 8: EFFECT OF SOME EXCIPIENTS ON REACTION KINETIC RATE OF LOSARTAN POTASSIUM
FIG.6: EXCIPIENT EFFECT ON LOSARTAN POTASSIUM Level of addition
(%)
Drug Tablet strength
(n =3)µg/ml
Amount added( n=3) µg/ml
Average Amount recovered
Recovery
80 Losartan 50 6.4 6.3 98.44
100 Losartan 50 8.0 7.99 99.87
120 Losartan 50 9.6 9.65 100.52
Average 99.61
%RSD 1.068
Excipient Concentration% pH value Remaining % Kinetic reaction rate K-1
Povidone K 30 0.1% 3.5 100.80 4.606x10⁻⁴
Mangessium stearate 0.1% 4.8 100.03 1.16x10⁻³
Microcrystalline cellulose 0.1% 5.45 100.15 2.99x10⁻³
Lactose 0.1% 5.7 98.96 4.61x10⁻⁴
Maze starch 0.1% 5.8 97.00 1.152x10⁻³
Talc powder 0.1% 6.5 97.75 2.76x10⁻³
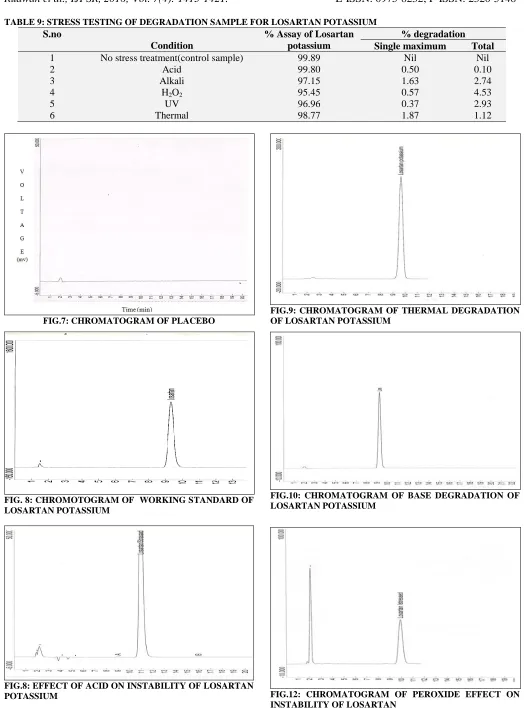
TABLE 9: STRESS TESTING OF DEGRADATION SAMPLE FOR LOSARTAN POTASSIUM
[image:8.612.44.568.38.754.2]FIG.7: CHROMATOGRAM OF PLACEBO
FIG. 8: CHROMOTOGRAM OF WORKING STANDARD OF LOSARTAN POTASSIUM
FIG.8: EFFECT OF ACID ON INSTABILITY OF LOSARTAN POTASSIUM
FIG.9: CHROMATOGRAM OF THERMAL DEGRADATION OF LOSARTAN POTASSIUM
FIG.10: CHROMATOGRAM OF BASE DEGRADATION OF LOSARTAN POTASSIUM
FIG.12: CHROMATOGRAM OF PEROXIDE EFFECT ON INSTABILITY OF LOSARTAN
S.no
Condition
% Assay of Losartan potassium
% degradation
Single maximum Total
1 No stress treatment(control sample) 99.89 Nil Nil
2 Acid 99.80 0.50 0.10
3 Alkali 97.15 1.63 2.74
4 H2O2 95.45 0.57 4.53
5 UV 96.96 0.37 2.93
[image:8.612.311.565.564.721.2]CONCLUSION: A new HPLC analytical method was developed to be as routinely applied to
estimation of losartan potassium in
pharmaceutical dosage form. In this work the stability of losartan potassium in present of dosage form was established through employment of ICH recommended stress condition. The developed procedure was evaluated for specificity, linearity, accuracy, precision and robustness to assure the stability –indicating method. The simplicity of the method allows for application in laboratories that lack sophisticated an analytical instrument such as LC-MS/MS that are complicated, costly and time consuming than a simple HPLC-UV method .The method was found to be specific. Linear, precise, accurate, robust and stability –indicating. So the method is recommended for routine quality control analysis and stability sample analysis.
REFERENCES:
1. J.T Carstensen C.T. Rhodes. Drug Stability, principles and practices informa healthcare, third edition vol107, 2000, p329. 2. FDA Guidance for Industry. Analytical Procedures and Methods
Validation (draft guidance), August 2000.
3. Abdullah A Elshanawane, Lobna M Abdelaziz and Hani M Hafez.2013.Stability Indicating HPLC Method for Simultaneous Determination of Several Angiotensin-II-Receptor Antagonists in Their Dosage Forms: Pharmaceut Anal Acta, 2013,Volume 3 .Issue 8. 1000175.
4. Milkica Crevar Sakac, Zorica Vujie, Jasmina Brboric, Vesna Kuntic and Snezana Uskokovic. An Improved HPLC Method with aid of Chemometric: Simultaneous Determination of Atorvastatin and its Metabolites I n plasma, molecules 2013, 18, 2469-2482. 5. ICH Q2B: Validation of Analytical Procedures: Methodology
(International Conference on Harmonization of Technical Requirements for the Registration of Drugs for Human Use, Geneva, Switzerland, May1997.
6. International Conference on Harmonization, 2005 .of Technical Requirement for Registration of pharmaceutical for human Use. Validation of Analytical Procedure’s: Text and Methodology, Q2. 7. ICH Harmonized Tripartite Guidelines (2003) Stability testing of
New Drug substances and Products Q1A (R2). 8. British pharmacopeia 2015.
All © 2013 are reserved by International Journal of Pharmaceutical Sciences and Research. This Journal licensed under a Creative Commons Attribution-NonCommercial-ShareAlike 3.0 Unported License.
This article can be downloaded to ANDROID OS based mobile. Scan QR Code using Code/Bar Scanner from your mobile. (Scanners are available on Google Playstore)
How to cite this article: