0095-1137/05/$08.00⫹0 doi:10.1128/JCM.43.6.2629–2634.2005
Copyright © 2005, American Society for Microbiology. All Rights Reserved.
Nationwide Antibiogram Analysis Using NCCLS M39-A Guidelines
Antonia Zapantis,
1* Melinda K. Lacy,
2Rebecca T. Horvat,
3Dennis Grauer,
2Brian J. Barnes,
2Brian O’Neal,
2and Rick Couldry
2Nova Southeastern University, College of Pharmacy, Fort Lauderdale, Florida1; University of Kansas, School of Pharmacy,
Kansas City, Kansas2; and University of Kansas, School of Medicine, Kansas City, Kansas3
Received 13 October 2004/Returned for modification 3 December 2004/Accepted 24 February 2005
Lack of standardization in antibiogram (ABGM) preparation (the overall profile of antimicrobial suscep-tibility results of a microbial species to a battery of antimicrobial agents) has not been addressed until recently. The objective of this study was to analyze current antibiograms using the recently published NCCLS M39-A guidelines for preparation of antibiograms to identify areas for improvement in the reporting of antibiogram susceptibility data. Antibiograms from across the United States were obtained by various methods, including direct mailings, Internet searches, and professional contacts. Each ABGM collected was analyzed using pro-spectively defined elements from the M39-A guidelines. Additionally, seven quality indicators were also eval-uated to look for the reporting of any atypical or inappropriate susceptibility data. The 209 antibiograms col-lected from 149 institutions showed at least 85% compliance to 5 of the 10 M39-A elements analyzed. Clinically relevant elements not met included annual analysis, duplicate isolate notation, and the exclusion of organisms with fewer than 10 isolates. As for the quality indicators evaluated, unexpected results included the 7% of
anti-biograms that reported <100% vancomycin susceptibility forStaphylococcus aureus, 24% that had inconsistent
beta-lactam susceptibility forStaphylococcus aureus, 20% that reported <100% imipenem susceptibility forEscherichia
coli, and 37% that reported >0% ampicillin susceptibility forKlebsiella pneumoniae. These findings suggest that
antibiograms should be reviewed thoroughly by infectious disease specialists (physicians and pharmacists), clin-ical microbiologists, and infection control personnel for identification of abnormal findings prior to distribution.
The NCCLS (now known as the CLSI [Clinical and Labo-ratory Standards Institute]) defines an antibiogram (ABGM) as an overall profile of antimicrobial susceptibility results of a microbial species to a battery of antimicrobial agents (17), which should reflect patient care needs along with the insti-tution’s formulary (15). When properly prepared and inter-preted, ABGMs are an important resource for healthcare providers. While patient-specific cultures and susceptibility re-ports are pending, the ABGM may guide empirical therapy decisions based on likely pathogens and their probable suscep-tibilities to anti-infectives available at the institution (6, 21, 24). Clinicians and local infection control personnel use ABGM data in monitoring resistance trends, identifying outbreaks, developing quality improvement initiatives, and forming infec-tion control policies and procedures (1, 6, 7, 8, 25). Microbi-ology and laboratory personnel also use ABGMs as a quality assurance measure for the Joint Commission on Accreditation of Healthcare Organizations (6, 11, 19). Pharmacy and Ther-apeutics committees use ABGM data when making anti-infec-tive formulary decisions and establishing drug use policies (6). The lack of standardization in the preparation and data assimilation of ABGMs has not been addressed until recently, though susceptibility testing has been standardized for years (12, 18). Because of this lack of standardization, empirical therapy selection based on ABGM data may be compromised. Furthermore, the comparison of ABGM data between institu-tions may be less meaningful when data have been summarized using various methods. In an attempt to resolve these issues,
the NCCLS has published the M39-A guidelines. This docu-ment provides recommendations on the collection, analysis, and presentation of cumulative antimicrobial susceptibility test data with the goal of guiding clinicians in the appropriate se-lection of empirical therapy (17).
The objective of this study was to identify areas of improve-ment in ABGM data presentation, which can ultimately im-prove empirical anti-infective selection. Recent ABGMs from different types of institutions from across the United States were analyzed using the NCCLS M39-A published guidelines on antibiogram development. Several quality indicators were also evaluated for the reporting of any atypical or inappropriate susceptibility data. It should be noted that analysis of specific antibiotic resistance patterns were not a focus of this study.
MATERIALS AND METHODS
Antibiogram collection process. Direct mailings, professional contacts, and Internet searches were used to collect ABGMs for 2000, 2001, and 2002 from university-affiliated, state of Kansas, Kansas City metropolitan area, and various community hospitals. Hospitals were identified using a University HealthSystem Consortium database and an Internet search using http://www.yellowpages.com/. During the fall of 2002, letters requesting antibiograms and demographic survey completion were sent to 264 different institutions nationwide along with a pre-addressed, postage-paid return envelope. Reminder cards were sent to nonre-spondents. Recipient institutions were assured that their specific susceptibility data would remain completely confidential. Additional ABGMs were collected through professional contacts until March 2003.
An Internet search was conducted using the Google and Dogpile search engines during winter 2003. Search terms included “antibiograms,” “hospital,” “2001,” “2002,” “2003,” “university,” “susceptibility reports,” and “university hospitals” in various combinations. Inclusion criteria included ABGMs during the 2000, 2001, and 2002 calendar years reporting results from human isolates. Demographic survey.The demographic survey included institution type, num-ber of licensed beds, departments involved in publishing ABGM data, publica-tion frequency, and availability of any electronic distribupublica-tion methods. Incom-plete surveys were comIncom-pleted using the institution’s Internet website or by * Corresponding author. Mailing address: Nova Southeastern
Uni-versity College of Pharmacy, 3200 South UniUni-versity Drive, Fort Lau-derdale, FL 33308. Phone: (954) 262-1362. Fax: (954) 262-2278. E-mail: [email protected].
2629
on May 16, 2020 by guest
http://jcm.asm.org/
telephone interview. The survey instruments were sequentially numbered prior to mailing to identify nonrespondents.
Antibiogram analysis.Each ABGM was analyzed using prospectively defined elements from the M39-A guidelines. The following elements were evaluated: (i) methods of summarizing susceptibility data, (ii) reporting results as “percent susceptible,” (iii) organisms’ morphological grouping, (iv) duplicate isolate no-tation, (v) description of exact collection period, (vi) number of isolates for each organism, (vii) reporting only organisms with greater than 10 isolates, (viii) antimicrobial description (generic name, trade name), (ix) utilization of NCCLS antimicrobial abbreviations, and (x) utilization of “dash” to describe susceptibil-ity data not reported. For the purpose of analysis, frequency of publication was also considered a prospectively defined element, for a total of 11 elements. Other M39-A recommendations evaluated were based on institutional need. These included separation of urine susceptibility data from nonurine susceptibility data, separation of susceptibility data by hospital location (e.g., intensive care units), and resistance trends descriptions (17).
Quality data indicators.Although data concerning antibiotic resistance pat-terns were not a focus of this study, ABGMs were evaluated for atypical or inappropriate susceptibility data to assess the quality of the data being reported. These indicators were selected from the recent NCCLS M-100 performance standards for susceptibility testing (17). These data included the following: (i) in-consistent beta-lactam susceptibility forStaphylococcus aureus, (ii) vancomycin susceptibility of less than 100% forS. aureus, (iii)Enterococcusspp. tested against cephalosporins or trimethoprim-sulfamethoxazole, (iv) imipenem susceptibility of less than 100% forEscherichia coli, (v) imipenem susceptibility for Stenotro-phomonas maltophilia, (vi) less than 100% susceptibility to third-generation cephalosporins forHaemophilus influenzae, and (vii) ampicillin susceptibility for Klebsiella pneumoniae. In addition, we noted the frequency ABGMs report of Streptococcus pneumoniaesusceptibility.
Statistical analysis.Demographic information and preselected ABGM ele-ments were descriptively compared and evaluated for statistical significance by the use of bivariate analyses. Fischer’s exact or a2test was used when
appro-priate. Data were analyzed using SPSS for Windows, release 9.0 (Chicago, IL).
RESULTS
One hundred seven hospitals responded to letter requests, yielding a 41% response rate. A total of 209 ABGMs were ac-quired using all three collection methods, which represented 149 hospitals. Seventeen additional hospitals indicated that ABGMs are not compiled at their institution. Fifty-seven
per-cent of the ABGMs were from 2001, 33% were from 2000, and 11% were from 2002.
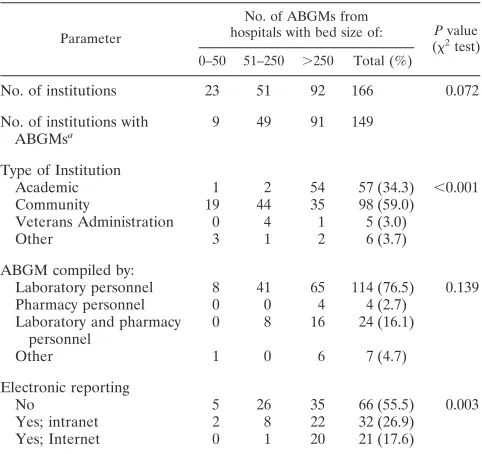
Table 1 represents cross-tabulations for institutional demo-graphics based on hospital size. Antibiograms from large hos-pitals (⬎250 beds) represented 61% of the sample, while 59% of institutions were community hospitals. Over one-third of the institutions (36%) distribute ABGMs electronically (intranet, 22%; Internet, 14%).
Antibiogram evaluation.Fig. 1 represents the frequency of
[image:2.585.43.284.80.307.2]analyzed ABGMs meeting the 11 predefined M-39A elements. Over 85% of the ABGMs met at least seven of the elements evaluated. Only 1 ABGM of the 209 evaluated met all 11 ele-ments. Table 2 represents cross-tabulations for the 11 prese-lected M39A ABGM elements by hospital size.
TABLE 1. Demographics by institution
Parameter
No. of ABGMs from
hospitals with bed size of: Pvalue (2
test) 0–50 51–250 ⬎250 Total (%)
No. of institutions 23 51 92 166 0.072
No. of institutions with
ABGMsa 9 49 91 149
Type of Institution
Academic 1 2 54 57 (34.3) ⬍0.001
Community 19 44 35 98 (59.0)
Veterans Administration 0 4 1 5 (3.0)
Other 3 1 2 6 (3.7)
ABGM compiled by:
Laboratory personnel 8 41 65 114 (76.5) 0.139
Pharmacy personnel 0 0 4 4 (2.7)
Laboratory and pharmacy personnel
0 8 16 24 (16.1)
Other 1 0 6 7 (4.7)
Electronic reporting
No 5 26 35 66 (55.5) 0.003
Yes; intranet 2 8 22 32 (26.9)
Yes; Internet 0 1 20 21 (17.6)
a
[image:2.585.301.543.82.371.2]Evaluated in analysis.
FIG. 1. Frequency of analyzed ABGMs meeting the 11 predefined M-39A elements.
TABLE 2. Summary of data by ABGM
Parameter
No. of ABGMs from hospitals with bed size of: 0–50 51–250 ⬎250 Total (%) Summarized data presentationa
9 68 122 199 (95.2)
Organisms separated by morphology 10 63 114 187 (89.5) Reported as % susceptible 10 73 120 203 (97.1)
Duplicate isolate notation 2 5 17 24 (11.5)
ABGM frequency
More than annually (⬍12 mo) 1 4 20 25 (16.8)
Annually 6 44 70 120 (80.5)
Less than annually (⬎12 mo) 2 1 1 4 (2.7) Collection period description
(i.e., mo and yr)
5 52 94 151 (72.2)
No. of isolates reported 11 73 119 203 (97.1) Less than 10 isolatesb
6 37 42 85 (40.7)
Name used in antimicrobial agent description
All generic 11 56 99 166 (79.4)
All generic and all brand 0 3 6 9 (4.3)
All generic and some brand 0 4 5 9 (4.3)
Some generic and some brand 0 11 14 25 (12.0) Antimicrobial abbreviations used
NCCLS recommended 1 14 7 22 (10.5)
Other 1 6 30 37 (17.7)
Presentation of susceptibility data not reported
Dash 0 6 20 26 (12.4)
Blank 6 48 75 129 (61.7)
Other method (e.g., shading, asterisk, etc.)
5 20 29 54 (25.8)
Total no. of ABGMs 11 74 124 209
aDefined as data presented in tabular form.
bDefined as the number of ABGMs with at least one organism reported with
less than 10 isolates (n⫽203).
on May 16, 2020 by guest
http://jcm.asm.org/
[image:2.585.301.542.603.703.2]Susceptibility data presentation.The NCCLS recommends that final verified susceptibility results be reported on ABGMs (17). In this study, computer-generated, raw susceptibility summaries were not classified as “final, verified results” and represented only 5% of the entire sample.
Antibiogram methodology.The NCCLS advocates the use
of “percent susceptibility” for each data box, clarification of where the isolates came from (i.e., use of duplicates), and description of the collection period (17). Reporting the sus-ceptibility data as “percent susceptible” for each organism-antimicrobial agent combination was the most commonly used method (97%). Additionally, seven quality indicators were also evaluated to look for the reporting of any atypical or inappropriate susceptibility data.
Isolates from the same patient should be excluded from ABGMs for a 1-year time period (17). This recommendation could not be evaluated; therefore, we evaluated ABGM doc-umentation of inclusion or exclusion of duplicate isolates. Only 12% of ABGMs documented how duplicates were managed.
Most ABGMs are compiled on an annual basis, as NCCLS recommends. They generally included the dates (month and year) for the collection period (72%). Of those, 70% reflected calendar years (January through December). Others periods of time included July to June and May to April.
Morphological grouping. Most ABGMs separated
organ-isms by morphology (90%), as recommended, with less than 4% reporting fungal susceptibility information. The remainder (10%) listed organisms alphabetically or by prevalence of oc-currence.
Number of isolates. The inclusion of the total number of
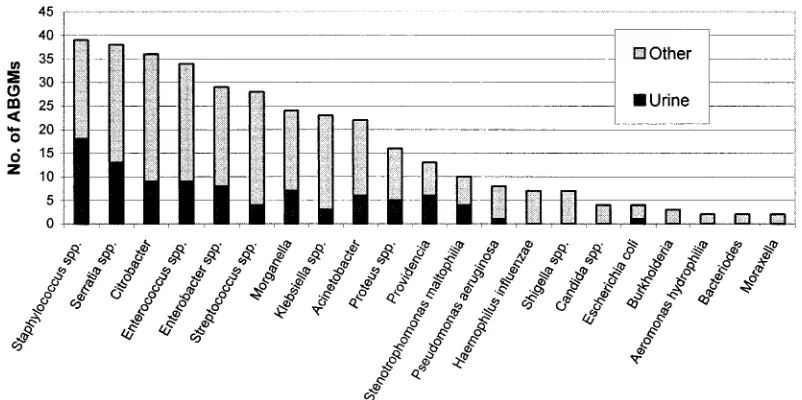
isolates collected for each organism is recommended along with the inclusion of data only for those organisms with 10 or more isolates (17). Ninety-seven percent of ABGMs reported the number of isolates tested per organism-antimicrobial com-bination. Interestingly, 42% of ABGMs contained susceptibil-ity data for organisms with fewer than 10 isolates. As shown in Fig. 2, many of these were clinically uncommon species or urine isolates.
Antimicrobial description. The M39-A document vaguely
recommends the use of complete antimicrobial names (17). Generic nomenclature was used most often (88%), followed by a mixture of some generic and some brand names (12%). Combination products (e.g., piperacillin-tazobactam) were most commonly implicated when ABGMs utilized brand names. The NCCLS recommends that when abbreviations are used for ABGMs, they should either agree with abbreviations used on patient susceptibility reports or utilize those listed in Appendix F of the M39-A document (17). Since it is not pos-sible to ascertain abbreviation congruency between patient sus-ceptibility reports and individual ABGMs, those contained in the M39-A document were the basis for this assessment. Twen-ty-eight percent of ABGMs contained abbreviations, and of those, only 37% used the NCCLS abbreviations.
Data not reported.Use of a dash in each ABGM data box
when a drug is either not tested at that institution or when it is known to be clinically ineffective is recommended in the M39-A guidelines (17). Our data show that only 12% of M39-ABGMs utilized the dash method, 25% used another method, and the remainder simply left the data box blank.
Other M39-A recommendations based on institutional need. The guidelines recommend that selectively tested antibiotics should be noted in some manner (e.g., footnotes) (17). Forty-seven percent of ABGMs separated urine isolates from nonu-rine isolates. Susceptibility information may be separated by specialty care areas, such as intensive care units or outpatient areas within the institution, to allow for more meaningful com-parisons between like units and the overall institution ABGM (17). A few ABGMs had separated specific location suscepti-bility information into intensive care units (n⫽20) and out-patient areas (n ⫽ 30). To assist clinicians with interpreting significant ABGM changes from year to year, institutions can provide a summary of major resistance trends in a variety of ways, such as with tables or graphs (1). Over 14% of ABGMs reported resistance trends. Various methods included the use of brief summaries, graphs, upward- and downward-pointing arrows in the data boxes, or numbers in boldface or
nonbold-FIG. 2. Organisms with fewer than 10 isolates reported.
on May 16, 2020 by guest
http://jcm.asm.org/
[image:3.585.91.492.511.711.2]face type. A couple of institutions distributed a brief letter with each new ABGM.
Quality data indicators.Overall, 14.3% of ABGMs included
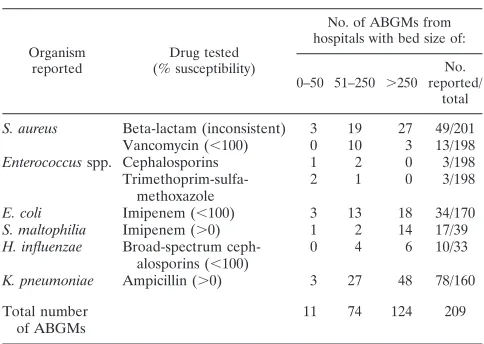
unusual results, based upon the seven prospectively defined quality indicators assessing unusual results and indicating un-verified ABGMs. Table 3 summarizes the results for these data quality indicators by institution size. The number of ABGMs assessed for each quality indicator varied widely, since not all ABGMs included results for each organism-antimicrobial com-bination evaluated.
Twenty-four percent of ABGMs reported inconsistent sus-ceptibility rates forS. aureusacross the beta-lactam class, spe-cifically the penicillinase-resistant penicillins, cephalosporins, and carbapenems. Of further interest, 7% of the study ABGMs (13 of 198) reported less than 100% vancomycin susceptibility (range, 98 to 99% susceptible) forS. aureus. Few ABGMs (3 of 198) reported susceptibility data forEnterococcusspp. to cephalosporins and trimethoprim-sulfamethoxazole. Despite the widespread availability of national surveillance data which routinely characterize the susceptibility trends for pneumococ-cus, only 20% of ABGMs included susceptibility data for this pathogen.
Of ABGMs that reported E. coli, 20% showed less than 100% imipenem susceptibility (range, 93 to 99% susceptible), while 43% reportedS. maltophiliaas having susceptibility to imipenem (range, 2 to 11% susceptible). Thirty percent (10 of 33) of ABGMs reported less than 100% susceptibility (range, 75 to 97% susceptible) ofH. influenzaeisolates to broad-spec-trum cephalosporins. Ampicillin showed susceptibility (range, 1 to 19% susceptible) toK. pneumoniaein 49% of ABGMs.
DISCUSSION
In an era of antimicrobial misuse, increasing anti-infective resistance, and reduced emphasis on antibiotic development by pharmaceutical manufacturers, the need for reliable, accurate ABGM data to guide appropriate antibiotic selection is critical (9, 20, 26). The recent publication of the first approved stan-dards for cumulative susceptibility data presentation under-scores the importance of these documents and their use in clinical practice. A couple of survey studies evaluate ABGM preparation but, to our knowledge, this study is the first of its size to evaluate actual ABGMs within the context of these standards (4, 8).
Perhaps the most interesting finding came from the evalua-tion of final, verified ABGM data, as done by evaluating eight separate quality indicators from the M-100 performance stan-dards (18). These surrogate markers represent ABGM validity. With only eight documented cases of vancomycin-intermediate
S. aureus(VISA) and three documented cases of vancomycin-resistantS. aureus(VRSA) in the United States (3, 5, 13), the 7% of ABGM analyzed with less than 100% vancomycin re-sistance forS. aureuslead us to believe either that the suscep-tibility data had not been verified at the institution level or that VISA or VRSA is more common than the published reports indicate. None of the institutions we evaluated were the insti-tutions with published VISA/VRSA cases in the literature. Inconsistent beta-lactam susceptibilities forS. aureusmay lead inexperienced clinicians to choose an inappropriate empirical regimen.
Although Halstead et al. reported that 90% of their respon-dents had a system in place to alert staff of atypical results (8), our findings indicate that many of these ABGMs may not have been thoroughly screened prior to distribution, since 14% of ABGMs had unusual susceptibility results. It is recommended that microbiology personnel or other clinicians review draft versions of ABGMs prior to distribution (10).
While the ABGM can be an important tool to increase awareness of hospital resistance patterns, study data revealed that a substantial number of small hospitals do not prepare ABGMs. This lack of ABGM preparation may be due to the fact that these small institutions have limited resources avail-able or that their cultures are sent to outside laboratories, given that there is low demand for this service (23).
The NCCLS recommends that ABGMs be prepared on an annual basis to allow for proper trend interpretation without confounders of seasonal variations (17). Although others con-tend that more frequent analysis of susceptibility data can reveal early identification of resistance trends (15), the results of our study show that the majority of institutions report cu-mulative susceptibility data on an annual basis. Also, there was no consistency with dates used to label antibiogram docu-ments. For example, a “2002” label on an antibiogram could refer to the actual collection date or the current year of re-lease, which often leads to confusion by clinicians using these documents.
[image:4.585.300.542.77.249.2]As expected, microbiology laboratory personnel compiled the majority of ABGMs; however, pharmacists were involved in the preparation process at 19% of institutions. Our findings underscore the value of using a multidisciplinary approach (physicians, infection control personnel, microbiologists, phar-macists) in reviewing antibiogram data prior to publication to avoid reporting misleading or suspicious susceptibility infor-mation. Also, with the increased use and accessibility of tech-nology, it is not surprising that over 35% of institutions report their ABGMs on hospital Internet or intranet sites. It is advis-able to provide an annual summary that highlights current susceptibility information, as several institutions in this study have done. This can assist clinicians with understanding insti-tutional shifts in susceptibility from one reporting period to
TABLE 3. Quality indicators
Organism reported
Drug tested (% susceptibility)
No. of ABGMs from hospitals with bed size of:
0–50 51–250 ⬎250 No. reported/
total S. aureus Beta-lactam (inconsistent) 3 19 27 49/201
Vancomycin (⬍100) 0 10 3 13/198
Enterococcusspp. Cephalosporins 1 2 0 3/198
Trimethoprim-sulfa-methoxazole
2 1 0 3/198
E. coli Imipenem (⬍100) 3 13 18 34/170 S. maltophilia Imipenem (⬎0) 1 2 14 17/39 H. influenzae Broad-spectrum
ceph-alosporins (⬍100)
0 4 6 10/33
K. pneumoniae Ampicillin (⬎0) 3 27 48 78/160 Total number
of ABGMs
11 74 124 209
on May 16, 2020 by guest
http://jcm.asm.org/
another and can be helpful for making empirical antibiotic de-cisions.
Many practitioners are completely unaware of how duplicate isolates from the same patient can skew susceptibility data on the antibiogram. Frequently, such duplicate isolates falsely el-evate resistance rates. This has recently been addressed in both the literature and by the NCCLS (10, 14, 16, 22, 27), yet only 12% of ABGMs analyzed included some notation of how du-plicate isolates from the same patient were managed during the compilation of susceptibility data. The proportion of institu-tions that report only nonduplicate isolates may be higher than is actually reported on ABGMs (7). Furthermore, it is appar-ent that to fully comply with the NCCLS duplicate isolates recommendation, laboratory information systems need to be modified to facilitate the removal of duplicate isolates, which is a tedious and time-consuming process when done manually (10, 16).
Nearly all ABGMs reported the number of isolates repre-sented; however, 41% reported susceptibility information on less than 10 isolates. The NCCLS recognizes that this number of isolates is an arbitrary number; however, it was chosen to assure that a low sample size does not mislead practitioners. The question is whether small numbers will negatively influ-ence susceptibility conclusions or would provide insight into the susceptibility data of less prevalent organisms (e.g., fungal pathogens). The small sample size of isolates reported also could influence many smaller hospitals in electing not to pre-pare ABGMs or to prepre-pare them infrequently.
The use of complete antimicrobial names, NCCLS-defined abbreviations, or abbreviations used on patient reports is rec-ommended. We interpreted this recommendation, regarding “complete antimicrobial names,” as meaning complete generic names, which follows the pattern exhibited throughout the M-39A document. The use of brand names for combination products could be due to spatial concerns on the ABGM or ease of recognition of brand names. Because the abbreviations for anti-infectives that were used on patient reports were un-available, we analyzed this recommendation based solely upon the M-39A document. Therefore, the full implication of the recommendation is difficult to assess in the present study.
In our analysis, we discovered that institutions most fre-quently deviated from the guidelines when indicating that an antibiotic-pathogen combination was neither reported nor tested. With only 12% of respondents using the dash meth-od, perhaps any method denoted on the ABGM, other than leaving blank data boxes, should be an acceptable alterna-tive. Additionally, the use of reporting results from selectively tested isolates, specific locations, or resistance trends may be interesting, yet their use may not be feasible for smaller insti-tutions based on need and quantity of isolates tested.
Our study contained several potential limitations. The most notable was that all conclusions were established based on ABGM evaluation without detailed knowledge of each insti-tution’s hospital policies and procedures. Furthermore, the M39-A guidelines contain approximately 40 recommendations, many of which could not be evaluated by inspecting only the antibiogram documents. For example, the recommendations regarding data analysis systems, patient demographic informa-tion, specimen identification and specifications, and antimicro-bial susceptibility testing methods could not be assessed by
the methods outlined. Additionally, readability may have been hampered in some cases by the access to photocopied versions of some of the ABGMs. The use of multiple ABGMs from the same institution could have influenced our study results. It is also possible that respondents who returned more than one ABGM were more interested in the process and/or had better access to published ABGMs data than other respondents. We included these multiple ABGMs in the analysis because ABGM preparation tends to evolve, and we believed that other institutions could learn from the changes that are made from year to year.
Despite these limitations, we and other organizations recog-nize the importance of ABGMs as a clinical tool. In 2002, the Centers for Disease Control and Prevention began pro-moting its latest campaign, “12 steps to prevent antimicrobial resistance among hospitalized adults” (2). The importance of ABGM data is featured in Step 6, “Use local data.” Specifical-ly, the campaign asks that healthcare professionals know their antibiogram, formulary, and patient population. In addition, the Joint Commission on Accreditation of Healthcare Organi-zations recognizes the ABGM as a quality assurance measure for clinical laboratories and therefore as a fulfillment of Stan-dard IM.8 (6, 11).
Given the emphasis that government agencies, accredita-tion organizaaccredita-tions, and the medical literature have placed on antimicrobial susceptibility patterns and inappropriate use of antimicrobials, it is evident that ABGMs have under-gone scrutiny. The lack of standardization limits the versatility of ABGMs across various areas of healthcare, including em-pirical antimicrobial selection, ABGM surveillance, and assis-tance in hospital and public health policy. Adoption of the M39-A guidelines for preparation of antibiogram data should improve the quality, standardization of reporting, and inter-pretation of results by infectious disease specialists along with microbiology and infection control personnel.
ACKNOWLEDGMENTS
This work was not supported by outside funds.
We thank the institutions participating in this research. The authors also recognize the contribution of Kristine Brunton for providing ad-ditional ABGMs for institutions in Kansas and Kelly Smith for her Internet search efforts.
REFERENCES
1.Calfee, D. P., and B. M. Farr.2002. Infection control and cost control in the era of managed care. Infect. Control Hosp. Epidemiol.23:407–410. 2.Centers for Disease Control and Prevention.2004. Campaign to prevent
antimicrobial resistance in healthcare settings [Online.] http://www.cdc.gov /drugresistance/healthcare/default.htm.
3.Centers for Disease Control and Prevention.2003. VISA/VRSA—vancomy-cin-intermediate/resistantStaphylococcus aureus.Fact sheet. [Online.] http: //www.cdc.gov/ncidod/hip/ARESIST/visa.htm.
4.Ernst, E. J., D. J. Diekema, B. J. Bootsman, T. Vaughn, J. W. Yankey, S. D. Flach, M. M. Ward, C. L. J. Franciscus, E. Acosta, M. A. Pfaller, and B. N. Doebbeling.2004. Are United States hospitals following national guidelines for the analysis and presentation of cumulative antimicrobial susceptibility data? Diagn. Microbiol. Infect. Dis.49:141–145.
5.Fridkin, S. K.2001. Vancomycin-intermediate and -resistantStaphylococcus aureus: what the infectious disease specialist needs to know. Clin. Infect. Dis. 32:108–115.
6.Ginocchio, C.2002. Role of NCCLS in antimicrobial susceptibility testing and monitoring. Am. J. Health Syst. Pharm.59(Suppl. 3):S7–S11. 7.Gums, J. G.2002. Assessing the impact of antimicrobial resistance. Am. J.
Health Syst. Pharm.59(Suppl. 3):S4–S6.
8.Halstead, D. C., N. Gomez, and Y. S. McCarter.2004. Reality of developing a community-wide antibiogram. J. Clin. Microbiol.42:1–6.
9.Hecker, M. T., D. C. Aron, N. P. Patel, M. K. Lehmann, and C. J. Donskey.
on May 16, 2020 by guest
http://jcm.asm.org/
2003. Unnecessary use of antimicrobials in hospitalized patients. Arch. In-tern. Med.163:972–978.
10.Horvat, R. T., N. E. Klutman, M. K. Lacy, D. Grauer, and M. Wilson.2003. Effect of duplicate isolates of methicillin-susceptible and methicillin-resistant Staphylococcus aureuson antibiogram data. J. Clin. Microbiol.41:4611–4616. 11.Joint Commission on Accreditation of Healthcare Organizations. 2000. Comprehensive accreditation manual for hospitals: the official handbook. Joint Commission on Accreditation of Healthcare Organizations, Oakbrook Terrace, Ill.
12.Jones, R. N.2001. Method preferences and test accuracy of antimicrobial susceptibility testing. Arch. Pathol. Lab. Med.125:1285–1289.
13.Kacica, M., and L. C. McDonald.2004. Brief report: vancomycin-resistant Staphylococcus aureus—New York, 2004. Morb. Mortal. Wkly. Rep.53:322– 323.
14.Lacy, M. K., N. E. Klutman, R. T. Horvat, and A. Zapantis.2004. Antibio-grams: new NCCLS guidelines, development, and clinical application. Hosp. Pharm.39:542–553.
15.Lamp, K.1996. Antibiograms. Pharm. Pract. Manag. Q.16:52–56. 16.Lee, S., Y. K. Cho, S. Kim, E. S. Lee, S. Y. Park, and Y. Seo.2004.
Com-parison of trends of resistance rates over 3 years calculated from results for all isolates and for the first isolate of a given species from a patient. J. Clin. Microbiol.41:4776–4779.
17.NCCLS.2002. Analysis and presentation of cumulative susceptibility test data; approved guideline. NCCLS document M39-A. NCCLS, Wayne, Pa. 18.NCCLS. 2002. Performance standards for antimicrobial susceptibility
testing: twelfth informational supplement. NCCLS document M100-S12. NCCLS, Wayne, Pa.
19.Patton, K. A.2002. Role of JCAHO standards and clinical practice guide-lines in promoting appropriate antimicrobial use. Am. J. Health Syst. Pharm. 59(Suppl. 3):S16–S18.
20.Pflomm, J.2002. Strategies for minimizing antimicrobial resistance. Am. J. Health Syst. Pharm.59(Suppl. 3):S12–S15.
21.Rush, D. R.1991. Antimicrobial formulary management: meeting the chal-lenge in the community hospital. Pharmacotherapy11(1, Pt. 2):19S–26S. 22.Shannon, K. P., and G. L. French.2002. Antibiotic resistance: effect of
different criteria for classifying isolates as duplicates on apparent resistance frequencies. J. Antimicrob. Chemother.49:201–204.
23.Stein, C. R., D. J. Weber, and M. Kelley.2003. Using hospital antibiogram data to assess regional pneumococcal resistance to antibiotics. Emerg. Infect. Dis.9:211–216.
24.Ting, Y., and D. Miles.2002. Developing a web-based tool using hospital-specific cumulative antibiogram data. Hosp. Pharm.37:1190–1195. 25.Van Beneden, C. A., C. Lexau, W. Baughman, B. Barnes, N. Bennett, P. M.
Cassidy, M. Pass, L. Gelling, N. L. Barrett, E. R. Zell, and C. G. Whitney. 2003. Aggregated antibiograms and monitoring of drug-resistant Streptococ-cus pneumoniae. Emerg. Infect. Dis.9:1089–1095.
26.Wester, C. W., L. Durairaj, A. T. Evans, D. N. Schwartz, S. Husain, and E. Martinez.2002. Antibiotic resistance, a survey of physician perceptions. Arch. Intern. Med.162:2210–2216.
27.White, R. L., L. V. Friedrich, D. S. Burgess, E. W. Brown, and L. E. Scott. 2001. Effect of removal of duplicate isolates on cumulative susceptibility reports. Diagn. Microbiol. Infect. Dis.39:251–256.