Copyright © 2000, American Society for Microbiology. All Rights Reserved.
Comparison and Application of a Novel Genotyping Method,
Semiautomated Primer-Specific and Mispair Extension Analysis,
and Four Other Genotyping Assays for Detection of
Hepatitis C Virus Mixed-Genotype Infections
YU-WEN HU,1* EVAN BALASKAS,1MILENA FURIONE,2PEI-HUA YEN,1GARRY KESSLER,1
VITO SCALIA,1LINDA CHUI3ANDGRAHAM SHER1
Canadian Blood Services, Ottawa, Ontario, Canada K1G 4J51; Servizio Di Virologia, I.R.C.C.S. Policlinico,
San Matteo, 27100 Pavia, Italy2; and Microbiology and Public Health,
Edmonton, Alberta, Canada T6G 2J23
Received 18 January 2000/Returned for modification 5 April 2000/Accepted 9 May 2000
To date the true prevalence of hepatitis C virus (HCV) mixed-genotype infections has not been established mainly because currently available methods are not suitable for the detection of mixed genotypes in a viral population. A novel semiautomated genotyping method, primer-specific and mispair extension analysis (S-PSMEA), which is more reliable than other genotyping assays was developed for detection of HCV mixed-genotype infections. A mixed-genotype present at levels as low as 0.8% in a defined mix of HCV mixed-genotypes was detected, showing a 20-fold increase in sensitivity over that of direct DNA sequencing. A total of 434 HCV isolates were genotyped and analyzed for a comparative study of the accuracy between S-PSMEA and four current geno-typing methods. The results showed that viruses in approximately 40% of the samples from this group determined to be infected with mixed genotypes by S-PSMEA were undetected by direct DNA sequencing due to its low sensitivity. Type-specific PCR, line probe assay, and restriction fragment length polymorphism anal-ysis performed poorly, being able to identify only 38.5, 16.1, and 15.4% of mixed-genotype infections, respec-tively, that were detected by direct DNA sequencing. The prevalence of mixed-genotype infections detected by S-PSMEA was 7.9% (12 of 152 donors) among HCV-infected blood donors, 14.3% (15 of 105) among patients with chronic hepatitis C, and 17.1% (6 of 36) among thalassemia patients who had received multiple trans-fusions. The data lead us to conclude that HCV mixed-genotype infections are more common than previously estimated and that S-PSMEA may be the method of choice when detection of genotypes present at low levels in mixed-genotype infections is required due to its higher level of sensitivity.
Hepatitis C virus (HCV) is an RNA virus with a high rate of genetic mutation (20). As a result, extensive genetic heteroge-neity of HCV exists in infected individuals, and HCV isolates are found as either a group of isolates with very closely related genomes, referred to as quasispecies, or genetically distinct groups called “genotypes” (5, 18). At present, 11 types and at least 50 subtypes of HCV have been described (23–25). More than one genotype can be found in the circulations of some HCV-infected patients, particularly in individuals who have received multiple transfusions and intravenous drug users. These are referred to as mixed-genotype infections (13, 26). The rate of HCV mixed-genotype infections is extremely vari-able in the same group of patients tested by different assays (7). The frequency of distribution of genotypes between patients with single- and mixed-genotype infections was not found to be concordant by the use of current genotyping methods (6). It has been difficult to assess the true prevalence of mixed-gen-otype infections by currently available assays, including direct DNA sequencing, since they are designed to identify only the HCV genotype dominant in the population (6, 16). As a result, genotypes present at lower proportional levels in a mix could be missed or mistyped (11). Population-based DNA sequenc-ing (i.e., clonsequenc-ing and sequencsequenc-ing of HCV cDNA) is the only
reliable method for detection of mixed-genotype infections. However, it is not practical for large cohort studies since it is expensive and time-consuming. Thus, virtually all studies of the clinical significance of HCV genotypes have been based on data from the detection of a single-genotype infection, ignoring the presence of mixed-genotype infections. This may have a significant impact on the interpretation of results from some studies of the biological and clinical differences between HCV genotypes (6, 26). We recently developed a simple and accu-rate genotyping method, primer-specific and mispair extension analysis (PSMEA) (11). The sensitivity of this assay for detec-tion of HCV mixed-genotype infecdetec-tions is superior to that of direct DNA sequencing. This assay has now been developed as a semiautomated genotyping system (S-PSMEA) that has shown a greater sensitivity and accuracy for detection of human im-munodeficiency virus type 1 mixed-genotype infection than our first-generation assay (12). We report here on the sensitivity and reliability of S-PSMEA for detection of HCV mixed-gen-otype infections by comparing four major currently available genotyping assays, type-specific PCR (T-S PCR), restriction fragment length polymorphism (RFLP) analysis, line probe assay (LiPA), and direct DNA sequencing with S-PSMEA and population-based DNA sequencing. By using S-PSMEA and direct DNA sequencing, the prevalence of HCV mixed-geno-type infections was also estimated among HCV-positive blood donors, patients with chronic hepatitis C, and patients with thalassaemia and HCV viremia who had received multiple transfusions in Canada.
* Corresponding author. Mailing address: Canadian Blood Services, 1800 Alta Vista Dr., Ottawa, Ontario, Canada K1G 4J5. Phone: (613) 739-2439. Fax: (613) 739-2426. E-mail: yu-wen.hu@bloodservices.ca.
2807
on May 15, 2020 by guest
http://jcm.asm.org/
MATERIALS AND METHODS
Samples.A total of 292 HCV-positive plasma samples were genotyped, of which 152 were from random blood donors who tested positive by both enzyme immunoassay (Ortho Diagnostic Systems Inc., Raritan, N.J.) and HCV RIBA-2 assays (CHIRON, Emeryville, Calif.), 105 were from patients with chronic hep-atitis C, and 35 were from thalassemia patients. In addition, 142 HCV RNA-positive samples were selected from 1,280 consecutive HCV RNA-RNA-positive pa-tients, including injection drug users, individuals who had received multiple transfusions, and persons with chronic liver disease from northern Italy, for a study on HCV mixed-genotype infections (8; M. Furione, M. Gatti, L. Dossena, C. Zanello, F. Baldanti, and G. Gerna, 5th Int. Meet. Viral Hepatitis C Virus and Related Viruses, Molecular Virology and Pathogenesis, p. 167 (abstr., 1998). The majority (76.9%) of these samples were found to contain more than one geno-type according to primer-specific PCR (P-S PCR) methods, but these results could not be confirmed by RFLP analysis or direct DNA sequencing.
cDNA amplifications by PCR. Viral RNA from each plasma sample was purified with the QIAamp Viral RNA kit (QIAGEN Inc., Venlo, The Nether-lands). The Pharmacia Biotech First-Strand cDNA synthesis kit was then used for cDNA synthesis. Reverse transcription-PCR was performed with a set of primers (sense primer from positions⫺302 to⫺278 [5⬘-CTCCCCTGTGAGG AACTACTGTCTT-3⬘] and antisense primer from positions⫺21 to⫺1 [5⬘-GG TGCACGGTCTACGAGACCT-3⬘]) that target highly conserved domains within the 5⬘untranslated region (5⬘UR). If a second-round PCR was necessary to provide sufficient cDNA for PSMEA, a pair of nested primers (sense primer from positions⫺264 to⫺239 [5⬘ -TCTAGCCATGGCGTTAGTATGAGTGT-3⬘] and antisense primer from positions⫺50 to⫺29 [5⬘-CTCGCAAGCACCCTA TCAGG-3⬘]) was used. The free nucleotides and primers were removed from the PCR products with the QIAquick PCR purification kit (QIAGEN Inc.). These purified PCR products were used for primer extension and automated sequenc-ing analysis (11).
S-PSMEA for HCV genotyping. S-PSMEA for HCV genotyping was per-formed by a procedure described previously (11, 12). The original assay, PSMEA (12), was improved by substituting the32P-labeled primer with a 5⬘-end Cy 5.5 dye-labeled primer, allowing the assay to be performed with an automated DNA sequencer to detect primer extension. This improvement has led to the devel-opment of the assay as a semiautomated system. Primer extension reaction mixtures contained 5 ng of 5⬘-end Cy 5.5 dye-labeled primer, 5 to 7 ng of PCR product, each required deoxynucleoside triphosphate (dNTP) at a concentration of 20M, 0.3 U ofPfu(Pyrococcus furiosus) DNA polymerase, and 2.5l of 10⫻ Pfureaction buffer (Stratagene, La Jolla, Calif.). Primer extensions were per-formed in a 25-l reaction volume in a thermocycler (GeneAmp 9600; Perkin-Elmer). Twenty cycles of 94°C for 20 s, 64°C for 20 s, and 72°C for 35 s were performed. One microliter of the primer extension products was mixed with 1l of the sequencing stop solution (Visible Genetics, Toronto, Ontario, Canada), and the mixture was electrophoresed on 6% polyacrylamide–8 M urea–Tris-borate-EDTA minigels for 10 min. Extension products were analyzed with au-tomated DNA fragment length polymorphism analysis (FLPA) software in the OpenGene automated DNA sequencing system (Visible Genetics). The princi-ple of primer design for PSMEA has been described previously (11).
RFLP analysis, T-S PCR, and LiPA for HCV genotyping.RFLP and T-S PCR for HCV genotyping were performed as described previously by Furione et al. (8), as modified from the methods of Ponjanpelto et al. (22) and Okamoto et al. (21). LiPA (Inno-LiPA HCV II) was performed by the procedure provided by the manufacturer (Innogenetics N.V., Ghent, Belgium).
Direct and population-based DNA sequencing.Both direct DNA sequencing and population-based sequencing were performed with an automated DNA sequencer (Visible Genetics) and DNA sequencing kits (Visible Genetics). For population-based DNA sequencing, the PCR products were directly cloned into the TOPO TA vector (Invitrogen Corp., Carlsbad, Calif.). The HCV sequence was amplified from positive colonies ofEscherichia coliwith M13 primers (Phar-macia Biotech). The reamplified PCR products were sequenced by the same procedure used for direct DNA sequencing.
RESULTS
Sensitivity and reliability of S-PSMEA for detection of HCV mixed-genotype infection. PSMEA was based on the unique 3⬘35⬘exonuclease proofreading properties ofPfuDNA poly-merase (11). It has now been developed as a semiautomated genotyping system with FLPA computer software in an auto-mated DNA sequencing system. Figure 1 illustrates the prin-ciple and procedure of S-PSMEA. Briefly, mispair formations and extensions occur during DNA synthesis in a primer exten-sion reaction with an incomplete set of dNTPs when DNA polymerases are used. However, the 3⬘35⬘exonuclease activ-ity ofPfu polymerase peaks sharply at its standard polymer-ization temperature, being extremely discriminative in nucle-otide incorporation and proofreading at the initiation step of
[image:2.612.320.537.68.405.2]DNA synthesis. The efficient 3⬘35⬘exonuclease proofreading ofPfucan completely prevent primer extension when a mispair (or mispairs) is found at the site of initiation of DNA synthesis (Fig. 1B-1). However,Pfucannot completely proofread, as it does allow some single mispair formations and extensions at certain nucleotide positions that are several nucleotides away from the primer extension initiation site (Fig. 1B-2 and B-3). Any two or more consecutive mispairs or a single mispair closely followed by another mispair (or mispairs) located downstream of the primer can completely terminate primer extension byPfu(Fig. 1B-2 and B-3). Taking advantage of the unique property of the Pfu 3⬘35⬘ exonuclease proofreading activity, nucleotide variations including a single-nucleotide variation, deletion, or insertion can be accurately identified by single PSMEA. In this improved PSMEA, S-PSMEA, a single Cy 5.5 dye-labeled primer extends up to 15 bases, providing a genotype-specific profile on a minigel that can be detected and FIG. 1. Principle and procedure of S-PSMEA. (A) Amplification of 5⬘UR of the HCV genome by PCR. (B) PSMEA reaction with an incomplete set of dNTPs (dCTP and dGTP) and a Cy 5.5 dye-labeled primer. (B-1) Primer exten-sion cannot initiate if a mispair(s) is present at and/or within the 3⬘end of the primer. (B-2) Single mispair formation and extension may occur at certain nucleotide positions that are more than one nucleotide away from the initiation site of primer extension. (B-3) Two consecutive mispairs or a single mispair closely followed by more than one mispair can completely terminate primer extension. (C) Genotype-specific profiles of the PSMEA reaction determined by FLPA after electrophoresis of PSMEA reaction products. (Top profile) No extension, showing a single peak for an unextended primer, due to a mispair that exists at the nucleotide position immediately adjacent to the 3⬘end of the primer (see B-1). (Bottom two profiles) Primer extended with the addition of a different number of bases, showing a genotype-specific pattern (also see B-2 and B-3). d, c, and a indicate the position of each detected peak.
on May 15, 2020 by guest
http://jcm.asm.org/
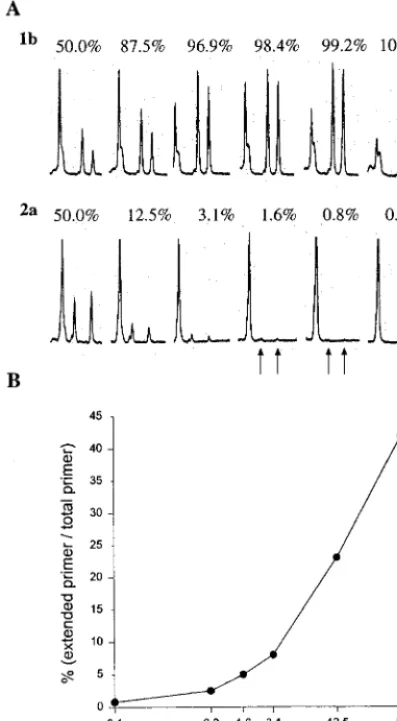
analyzed with a laser detection system and FLPA software in an automated DNA sequencer (Fig. 1C). Excess primer is used in PSMEA (molar ratio of primer to template of 10:1), so that more than 30% of the total primer could be extended in a 20-cycle primer extension reaction with a thermocycler. Cy 5.5 dye-labeled primers extend, revealing a few peaks with strong signals which are readily quantified with FLPA software, so that the proportion of each genotype in a mix can be measured. To assess the sensitivity and reliability of S-PSMEA for detection of mixed genotypes in a viral population, an artificial mixing experiment was performed with defined PCR products amplified from the 5⬘URs of HCV genotype 1b and 2a isolates as described previously (11). The products were mixed in the following proportions of genotype 2a to genotype 1b: 50.0% (1:1), 25.0% (1:3), 12.5% (1:7), 6.3% (1:15) 3.1% (1:31), 1.6%
(1:63), 0.8% (1:127), and 0.0% (0:100). Figure 2A shows that 0.8% of genotype 2a in the mix was clearly detected by PS-MEA. Genotype 2a at levels of 0.8 to 25% could not be iden-tified by direct DNA sequencing (11). There was an approxi-mate 20-fold increase in the sensitivity of PSMEA over that of direct DNA sequencing for detection of mixed genotypes in a viral population. The proportion of primer extension of geno-type 2a was calculated and was shown to be in agreement with the proportion of genotype 2a in the mixture (Fig. 2B). The efficiency and accuracy of this assay have been improved sig-nificantly in comparison with those of the original PSMEA (11).
[image:3.612.70.269.76.437.2]It is difficult for most assays to identify mixed infections with genotypes 1a and 1b because only one nucleotide difference at position⫺99 is available to distinguish between the two geno-types when the 5⬘UR of the HCV genome is used. Unfortu-nately, genotypes 1a and 1b are the most prevalent genotypes reported in the world. We have previously demonstrated that PSMEA could accurately distinguish between genotypes 1a and 1b and sensitively detect mixtures of genotypes (11). Figure 3 shows that by S-PSMEA, genotypes 1a and 1b in a mixture were identified with a single primer and two sets of dNTPs that generated a subtype-specific profile of primer ex-tension in the PSMEA reaction, as described previously (11). In this study, a total of 362 isolates from several different populations in Italy and Canada were genotyped and examined by S-PSMEA and direct DNA sequencing for the presence of mixed genotypes. Fifty-two (14.4%) of the samples were found to have mixtures genotypes when S-PSMEA was used. Thirty-one (59.6%) of these 52 samples were concordantly identified
[image:3.612.319.537.400.579.2]FIG. 2. Evaluation of the sensitivity of S-PSMEA for detection of low levels of HCV mixed-genotype infections with a defined mixture of genotypes 1b and 2a in different proportions. (A) FLPA graphs showing the genotype-specific profiles and proportion of primer extension in the PSMEA reactions with dif-ferent proportions of genotypes in the mixtures. The first peak from the left is the unextended primer, and the other two peaks represent extended primer to which different numbers of bases were added. See the report by Hu et al. (11) for details. (B) Quantification analysis of primer extension with different percent-ages of genotype 2a in the mixture with FLPA software. The proportion of primer extension in agreement with the percentage of the template (genotype 2a) in the mixtures was shown to be 100%. The formula for the calculation was as follows: the percentage of each genotype in the mixture is equal to the [percent primer extension of target genotype/(percent primer extension of target geno-type⫹percent primer extension for each other genotype in the mix)]⫻100.
FIG. 3. Detection of mixed-genotype infections (genotypes 1a and 1b) by S-PSMEA. (A) Genotypic profiles of primer extension of genotypes 1a and 1b by PSMEA reactions with universal primer 1BR in presence of different sets of dNTPs. (A-1) No extension with dTTP and dGTP in the presence of genotype 1b alone; (A-2) primer extension profile with dCTP and dGTP in the presence of genotypes 1a and 1b in a mixture; (A-3) no extension with dCTP and dGTP in the presence of genotype 1a alone; (A-4) primer extension profile with dTTP and dGTP in the presence of genotypes 1a and 1b in a mixture. (B) Nucleotide sequences of the templates (genotypes 1a and 1b), primers, and extension prod-ucts illustrated in panel A. The capital letters CGCGGGGC and GT represent the bases that were extended. The majority of primer extension products ended at a pair with a single mismatch: g in genotype 1b or a in genotype 1a (B-2 and B-4). A small proportion of primers extended with several more bases (gcgccc or ggggg) and ended at a pair with a double mismatch (xx) (B-2 and B-4). The percentage of genotypes 1a and 1b in a mixture is calculated as follows: [percent primer extension of genotype 1a or 1b/percent total primer extension of genotype 1a⫹genotype 1b (i.e., percent primer extension with G and T⫹percent primer extension with C and G)]⫻100.
on May 15, 2020 by guest
http://jcm.asm.org/
as having mixed-genotype infections by direct DNA sequenc-ing, suggesting that approximately 40% of HCV mixed-geno-type infections were undetected due to the low sensitivity of direct DNA sequencing. To further confirm the accuracy of S-PSMEA, a proportional-level analysis was carried out by S-PSMEA with 20 of the 52 samples. Ten of them were iden-tified to have mixtures of genotypes by both S-PSMEA and direct DNA sequencing, and another 10 samples were deter-mined to have mixtures of different genotypes by S-PSMEA but not by direct DNA sequencing. Table 1 shows that the results of PSMEA were in 100% agreement with those of direct DNA sequencing for both genotyping and estimation of the proportion of each genotype only when the genotypes in the mixtures were detected by both methods. Direct DNA sequencing could not reliably detect genotypes that were present in mixtures at levels below 25%. The results were in agreement with data reported previously (11). In addition, the results also indicate that more than two mixed genotypes in a sample could be detected by S-PSMEA but not by direct DNA sequencing. This is another limitation of direct DNA sequenc-ing for detection of HCV mixed-genotype infections.
The high sensitivity and reliability of S-PSMEA for detec-tion of mixed-genotype infecdetec-tions was further confirmed by population-based DNA sequencing (Table 2). One of the sam-ples (sample F17) identified to contain a mixture of genotypes 1a and 1b (Table 1) by both direct DNA sequencing and S-PSMEA was used as a positive control. Two other samples (samples F6 and 25; Table 1) were found to contain mixtures of genotypes 1a and 1b by S-PSMEA but not by direct DNA sequencing. The results of population-based DNA sequencing showed that all three truly contained mixtures of genotypes 1a and 1b. The proportion of each genotype in the mixtures esti-mated by S-PSMEA was similar to that estiesti-mated by popula-tion-based DNA sequencing, indicating that PSMEA is more sensitive and reliable for detection of mixed-genotype infec-tions than direct DNA sequencing.
Comparison of accuracies of S-PSMEA, RFLP analysis, T-S PCR, and LiPA for genotyping and detection of HCV
mixed-genotype infections.For general HCV genotyping, most cur-rent genotyping methods are quite reliable (16). However, considerable discordance between those methods has been reported (6, 8; Furione et al., 5th Int. Meet. Viral Hepatitis C and Related Viruses). This may be due to differences in geno-type distributions and variations of HCV (23; Furione et al., 5th Int. Meet. Viral Hepatitis C and Related Viruses). To evaluate the accuracy and reliability of widely used genotyping assays and S-PSMEA for general genotyping, a total of 208 samples collected from northern Italy and across Canada were genotyped by direct DNA sequencing, S-PSMEA, RFLP, P-S PCR, and LiPA. Table 3 shows that for isolates of a single genotype or a predominant genotype, the levels of concor-dance of the results of S-PSMEA, RFLP analysis, P-S PCR, and LiPA, with those of direct DNA sequencing were 98.9, 87.6, 13.6, and 96.7%, respectively. Note that the level of con-cordance between P-S PCR and direct DNA sequencing was extremely low. This was mainly due to the cross-reactivity be-tween genotype 4 with other genotypes in the P-S PCR (8; Furione et al., 5th Int. Meet. Viral Hepatitis C and Related Viruses). RFLP analysis could accurately identify genotype 4, so that its accuracy was higher than that of P-S PCR. However, in some cases it could not distinguish between genotypes 1a and 1b. S-PSMEA and LiPA were more accurate than the other methods. To compare the accuracies of the genotyping methods for detection of mixed-genotype infections, 20 of the 208 samples defined as containing mixtures of different geno-types by direct DNA sequencing were tested. The results show that the detection rates were 100% (20 of 20 samples), 35.7% (5 of 14), 16.7% (1 of 6), and 14.3% (2 of 14) for S-PSMEA, PS-PCR, LiPA, and RFLP analysis, respectively, demonstrat-ing that S-PSMEA was the most accurate method. Further-more, with several samples the old PSMEA method (11) and the improved S-PSMEA method were compared; a 100% con-cordance of the results was observed. In this study, 66 of the 208 samples collected from patients with chronic hepatitis C from Canada were genotyped by LiPA, S-PSMEA, and direct DNA sequencing. The results showed that 6 of the 66 samples were found to contain mixed genotypes by both S-PSMEA and direct DNA sequencing. LiPA detected mixtures of genotypes in only one of the six samples, and three of four samples with mixtures of genotypes of 1a and 1b were found by LiPA to contain genotype 1 isolates, but LiPA provided no subtyping results for these samples.
Prevalence of HCV mixed-genotype infections estimated by S-PSMEA and direct DNA sequencing. Table 4 shows the prevalence of HCV mixed-genotype infections determined by S-PSMEA and direct DNA sequencing in different populations across Canada. As expected, the prevalence of HCV
mixed-TABLE 1. Comparison of accuracy between S-PSMEA and direct DNA sequencing for detection and estimation of proportional
levels of mixed genotypes in the HCV isolates
Sample no.
% of the following genotype
detected by S-PSMEA: Sequencing result
1a 1b Other
56 37.0 63.0 1a⬎1b
76 38.5 53.9 7.6 (2a) 1b⬎2a
120 15.6 84.4 1a⬍1b
127 75.6 24.4 1a⬎1b
128 44.5 55.5 1a⫽1b
129 64.5 35.5 1a⬎1b
130 70.0 30.0 1a⬎1b
CIO9 41.4 58.6 1b⬎1a
M51 68.0 32.0 1a⬎1b
F17 60.0 40.0 1a⬎1b
25 12.0 88.0 1b
58 88.4 11.6 1a
89 95.5 4.5 1a
104 89.1 10.9 1a
107 90.8 9.2 1a
108 84.9 15.1 1a
112 96.5 3.5 1a
131 80.2 7.0 12.8 (2a) 1a⬎2a
132 82.5 7.5 10.0 (2a) 1a⬎2a
[image:4.612.52.293.100.326.2]F6 75.0 25.0 1a
TABLE 2. Evaluation of accuracy of S-PSMEA and direct DNA sequencing for detection of mixed 1a and 1b infections compared
with that of population-based DNA sequencing
Sample no.
% of the following geno-type detected by S-PSMEA:
Direct DNA sequencing
result
% the following genotype detected by population-based
DNA sequencinga:
1a 1b 1a 1b
F17 60.0 40.0 1a⬎1b 65.0 (13/20) 35.0 (7/20) F6 75.0 25.0 1a 78.1 (25/32) 21.9 (7/32) 25 12.0 88.0 1b 6.7 (2/30) 93.3 (28/30)
aDenotes the proportion of each genotype in clones of PCR products from
samples. The numbers in parentheses represent the total numbers of clones analyzed/number of clones found to contain the genotype.
on May 15, 2020 by guest
http://jcm.asm.org/
[image:4.612.311.552.616.703.2]genotype infections was high (17.1%) in thalassaemia patients who had received multiple transfusions. However, the rate of HCV mixed-genotype infections in patients with chronic hep-atitis C was as high as 14.3%, which was not significantly different from that in the thalassaemia patients who had re-ceived multiple transfusions. Even in the group of HCV-posi-tive blood donors, the prevalence of mixed-genotype infections was 7.9%, which was much higher than expected. Thirteen (61.9%) of 21 of the mixed-genotype infections in chronic hepatitis C and thalassaemia patients were also detected by direct DNA sequencing. The remaining 38.5% of mixed-gen-otype infections identified by S-PSMEA could not be detected by direct DNA sequencing, possibly because direct DNA se-quencing was not sensitive enough to detect low levels of mixed genotypes, as shown in Table 1 and our previous report (11).
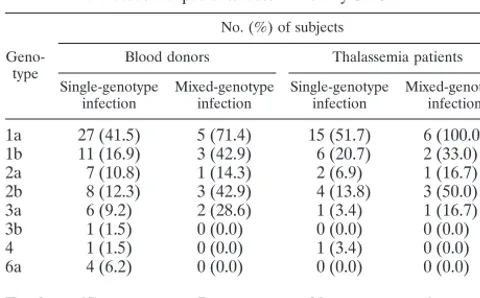
HCV genotype distribution in patients with single- and mixed-genotype infections.Table 5 shows the genotype distri-bution of HCV in blood donors and thalassemia patients in-fected with single or multiple HCV genotypes in Canada as determined by S-PSMEA. Among the samples with single-genotype infections, single-genotype 1a was the predominant geno-type in blood donors (41.5%) and thalassemia patients who had received multiple transfusions (51.7%). Among the sam-ples with mixed-genotype infections, genotype 1a was found in 71.4% of the blood donors and 100% of the thalassemia pa-tients. Genotypes 1b and 2b were the next commonly found genotypes in samples either with single-genotype infections or with mixed-genotype infections. It was apparent that the dis-tribution of genotypes in samples with HCV single- and mixed-genotype infections determined by S-PSMEA was concordant for both blood donors and thalassaemia patients. Samples were collected from blood donors in western and eastern Canada, with a higher prevalence of genotype 6a frequently found in the samples from western Canada. The samples from thalas-semia patients were obtained from patients in Toronto, in eastern Canada; thus, no isolates of genotype 6a were found in this group of patients.
DISCUSSION
In this study we have demonstrated that PSMEA is more reliable than other currently available genotyping methods for
detection of HCV mixed-genotype infections. This has allowed us to more accurately estimate the prevalence of mixed-geno-type infections in different populations, which has important implications for clinical and epidemiological studies of HCV genotypes (3, 17, 19).
The accuracies of four currently available genotyping meth-ods for detection of HCV mixed-genotype infections compared with those of S-PSMEA and population-based DNA sequenc-ing were reevaluated in this study. It appears from our data that S-PSMEA is a more sensitive method than T-S PCR, RFLP analysis, and LiPA for detection of HCV mixed-geno-type infections. Although direct DNA sequencing remains the best among the currently available genotyping assays, only about 60% of HCV mixed-genotype infections can be detected by that method. In light of these findings, results by these methods that indicate HCV mixed-genotype infections should be interpreted with caution.
[image:5.612.55.553.93.264.2]Genotypes 1a and 1b are the most prevalent in most parts of the world (23). On the basis of our results, 40 to 75% of mixed-genotype 1a and 1b infections can be missed or mis-typed by these currently available genotyping methods. The true prevalence of HCV mixed-genotype infections, particu-larly, mixed-genotype 1a and 1b infections, should be higher than that estimated previously by the widely used genotyping methods with samples from blood donors and patients with chronic hepatitis C (4). In addition, it is difficult for these methods to identify more than two genotypes in a mixture. Extensive cloning and sequencing of a large number of clones
TABLE 3. Comparison of accuracies of S-PSMEA, RFLP, P-T PCR, and LiPA for genotyping and detection of HCV mixed-genotype infections
DNA sequencing result (no. of samples)
% Concordance between DNA sequencing and other assays
S-PSMEA RFLP P-S PCR LiPA
Single
1a (64) 100.0 (64/64)a 88.2 (30/34) 23.5 (8/34) 96.7 (29/30)
1b (34) 97.1 (33/34) 43.8 (7/16) 6.3 (1/16) 94.4 (17/18)
2a (30) 100.0 (30/30) 100.0 (28/28) 7.1 (2/28) 100.0 (2/2)
2b (8) 100.0 (8/8) 100.0 (6/6) 100.0 (6/6) 100.0 (2/2)
3a (29) 100.0 (29/29) 91.5 (21/23) 4.3 (1/23) 100.0 (6/6)
4 (24) 95.8 (23/24) 95.5 (21/22) 0.0 (0/23) 100.0 (2/2)
Total no., 189 98.9 (171/173) 87.6 (113/129) 13.6 (18/129) 96.7 (58/60)
Mix
1a⫹1b (15) 100.0 (15/15) 18.2 (2/11) 36.4 (4/11) 25.0 (1/4)
2a⫹1a (2) 100.0 (2/2) 0.0 (0/2) 0.0 (0/2) NDb
2a⫹1b (1) 100.0 (1/1) 0.0 (0/1) 100.0 (1/1) ND
2b⫹1a (2) 100.0 (2/2) ND ND 0.0 (0/2)
Total no., 20 100.0 (20/20) 14.3 (2/14) 35.7 (5/14) 16.7 (1/6)
aThe numbers in bracket parentheses are the number of samples correctly typed/total number of samples typed. bND, not determined.
TABLE 4. Prevalence of HCV mixed-genotype infections in different HCV-positive populations determined by
S-PSMEA and direct DNA sequencing
Population
No. of samples with mixed genotypes/total no.
of samples (%)
S-PSMEA Direct DNAsequencing
Blood donors and general population 12/152 (7.9) 4/80 (5.0) Patients with chronic hepatitis C 15/105 (14.3) 9/105 (8.6) Thalassemia patients 6/35 (17.1) 4/35 (11.1)
on May 15, 2020 by guest
http://jcm.asm.org/
[image:5.612.312.551.641.728.2]from each of these isolates are required in order to determine whether more than one genotype is present simultaneously. Unfortunately, use of this method for clinical studies is imprac-tical. S-PSMEA is an alternative for accurate detection of HCV mixed-genotype infections including multiple-genotype infections in large cohort studies.
It is not surprising that a high frequency of mixed-genotype infections is found in persons with hemophilia since many had multiple exposures to HCV from long-term use of older co-agulation factor concentrates before heat treatment and anti-HCV testing was implemented (13, 26). In this study, the prevalence of HCV mixed-genotype infections among blood donors and patients with chronic hepatitis determined by S-PSMEA was found to be higher than that reported previously (4, 16). This is because low levels of a genotype present in a mixture of genotypes can be detected by S-PSMEA. On the basis of epidemiological studies, mixed-genotype infections in HCV-positive patients should be common because injection drug use currently accounts for 60% of cases of HCV trans-mission and has accounted for a substantial proportion of HCV infections in past decades (1, 2). Multiple exposures may have led to episodes of reinfection with different genotypes for many chronic injection drug users (9). It is noted in this study that the rate of mixed-genotype infections in thalassemia pa-tients who have received multiple transfusions was not as high as expected. Our explanation is that these patients are young (i.e., age, 22.3 ⫾ 10.7 years), so that the frequency of their exposure to HCV has been dramatically decreased because the screening tests for HCV were introduced in 1990.
Reliable detection of HCV mixed-genotype infections may have broad applications for studies of the clinical significance of HCV genotypes and epidemiological mysteries: (i) accurate detection of mixed-genotype infections is required for study of the frequency of HCV reinfection and reactivation (14). (ii) Reliable detection of mixed-genotype infections is crucial to gain a precise understanding of the mechanism of genotype changes over time in patients with conditions such as hemo-philia and thalassemia who have received multiple transfusions (26). (iii) A high frequency of mixed-genotype 1a and 1b in-fections may have a significant impact on clinical studies of whether genotype 1b is less sensitive to interferon treatment and is associated with a more severe form of liver disease than the form of liver disease associated with other genotypes (10). (iv) Analysis of samples from individuals with mixed-genotype infections can facilitate studies of the clinical and biological
differences among HCV genotypes in which confounding host factors would be completely eliminated (10). (v) The preva-lence of HCV mixed-genotype infections can be used as a marker for monitoring the presence of risk factors in a popu-lation. (vi) Accurate detection of mixed-genotype infection provides a tool that can be used to address whether multiple episodes of reinfection with different genotypes would increase the likelihood of acquiring highly pathogenic variants (or ge-notype), resulting in more severe hepatitis when compared with that from a primary single-genotype infection (15; Y. W. Hu, E. Balaskas, G. Kessler, V. Scalia, A. Giulivi, G. Sher, and P. Gill, 5th Int. Meet. Viral Hepatitis C Virus and Related Vi-ruses, Molecular Virology and Pathogenesis, p. 179 (abstr., 1998).
REFERENCES
1.Alter, M. J.1997. Epidemiology of hepatitis C. Hepatology26:62S–65S. 2.Alter, M. J., D. Kruszon-Moran, O. V. Nainan, G. M. McQuillan, F. Gao,
L. A. Moyer, R. A. Kaslow, and H. S. Margolis.1999. The prevalence of hepatitis C virus infection in the United States, 1988 through 1994. N. Engl. J. Med.341:556–562.
3.Andonov, A., and R. K. Chaudhary.1994. Genotyping of Canadian hepatitis C virus isolates by PCR. J. Clin. Microbiol.32:2031–2034.
4.Bernier, L., B. Willems, G. Delage, and D. G. Murphy.1996. Identification of numerous hepatitis C virus genotypes in Montreal, Canada. J. Clin. Micro-biol.34:2815–2818.
5.Bukh, J., R. H. Miller, and R. H. Purcell.1995. Genetic heterogeneity of the hepatitis C virus: quasispecies and genotypes. Semin. Liver Dis.15:41–63. 6.Eyster, M. E., K. E. Sherman, J. J. Goedert, A. Katsoulidou, and A.
Hatza-kis.1999. Prevalence and changes in hepatitis C virus genotypes among multitransfused persons with hemophilia. The Multicenter Hemophilia Co-hort Study. J. Infect. Dis.179:1062–1069.
7.Forns, X., M. D. Maluenda, F. X. Lopez-Labrador, S. Ampurdanes, E. Olmedo, J. Costa, P. Simmonds, J. M. Sanchez-Tapias, M. T. Jimenez De Anta, and J. Rodes.1996. Comparative study of three methods for genotyp-ing hepatitis C virus strains in samples from Spanish patients. J. Clin. Mi-crobiol.34:2516–2521.
8.Furione, M., L. Simoncini, M. Gatti, F. Baldanti, F. Grazia, M. Revello, and G. Gerna.1999. HCV genotyping by three methods: analysis of discordant results based on sequencing. J. Clin. Virol.13:121–130.
9.Garfein, R. S., D. Vlahov, N. Galai, M. C. Doherty, and K. E. Nelson.1996. Viral infections in short-term injection drug users: the prevalence of the hepatitis C, hepatitis B, human immunodeficiency, and human T-lympho-tropic viruses. Am. J. Public Health86:655–661.
10. Horiike, N., T. Masumoto, K. Michitaka, K. Kurose, S. M. Akbar, and M. Onji.1996. Response to interferon in chronic hepatitis C due to mixed genotype infection. J. Gastroenterol. Hepatol.11:353–357.
11. Hu, Y. W., E. Balaskas, G. Kessler, C. Issid, L. J. Scully, D. G. Murphy, A. Rinfret, A. Giulivi, V. Scalia, and P. Gill.1998. Primer specific and mispair extension analysis (PSMEA) as a simple approach to fast genotyping. Nu-cleic Acids Res.26:5013–5015.
12. Hu, Y. W., P. Tranqui, E. Balaskas, V. Scalia, A. Giulivi, P. Gill, S. Cassol, J. B. Angel, C. M. Kovacs, and G. Sher.1999. A sensitive genotyping assay, primer specific and mispair extension analysis (PSMEA) for detection of low levels of HIV-1 drug resistance mutants. Can. J. Infect. Dis.10(Suppl.):9B. 13. Jarvis, L. M., C. A. Ludlam, and P. Simmonds.1995. Hepatitis C virus
genotypes in multi-transfused individuals. Haemophilia1(Suppl.):3–7. 14. Jarvis, L. M., H. G. Watson, F. McOmish, J. F. Peutherer, C. A. Ludlam, and
P. Simmonds.1994. Frequent reinfection and reactivation of hepatitis C virus genotypes in multitransfused hemophiliacs. J. Infect. Dis.170:1018– 1022.
15. Lai, M. E., A. P. Mazzoleni, F. Argiolu, S. De Virgilis, A. Balestrieri, R. H. Purcell, A. Cao, and P. Farci.1994. Hepatitis C virus in multiple episodes of acute hepatitis in polytransfused thalassaemic children. Lancet343:388–390. 16. Lau, J. Y., M. Mizokami, J. A. Kolberg, G. L. Davis, L. E. Prescott, T. Ohno, R. P. Perrillo, K. L. Lindsay, R. G. Gish, K. P. Qian, M. Kohara, P. Simmonds, and M. S. Urdea.1995. Application of six hepatitis C virus genotyping systems to sera from chronic hepatitis C patients in the United States. J. Infect. Dis.171:281–289.
17. Le Guen, B., G. Squadrito, B. Nalpas, P. Berthelot, S. Pol, and C. Brechot.
1997. Hepatitis C virus genome complexity correlates with response to in-terferon therapy: a study in French patients with chronic hepatitis C. Hepa-tology25:1250–1254.
18. Martell, M., J. I. Esteban, J. Quer, J. Genesca, A. Weiner, R. Esteban, J. Guardia, and J. Gomez. 1992. Hepatitis C virus (HCV) circulates as a population of different but closely related genomes: quasispecies nature of HCV genome distribution. J. Virol.66:3225–3229.
[image:6.612.53.293.100.249.2]19. Mihm, S., A. Fayyazi, H. Hartmann, and G. Ramadori.1997. Analysis of histopathological manifestations of chronic hepatitis C virus infection with respect to virus genotype. Hepatology25:735–739.
TABLE 5. Distribution of genotypes in HCV single-and mixed-genotype infections in blood donors single-and
thalassaemia patients determined by S-PSMEA
Geno-type
No. (%) of subjects
Blood donors Thalassemia patients Single-genotype
infection Mixed-genotypeinfection Single-genotypeinfection Mixed-genotypeinfection
1a 27 (41.5) 5 (71.4) 15 (51.7) 6 (100.0) 1b 11 (16.9) 3 (42.9) 6 (20.7) 2 (33.0) 2a 7 (10.8) 1 (14.3) 2 (6.9) 1 (16.7) 2b 8 (12.3) 3 (42.9) 4 (13.8) 3 (50.0) 3a 6 (9.2) 2 (28.6) 1 (3.4) 1 (16.7)
3b 1 (1.5) 0 (0.0) 0 (0.0) 0 (0.0)
4 1 (1.5) 0 (0.0) 1 (3.4) 0 (0.0)
6a 4 (6.2) 0 (0.0) 0 (0.0) 0 (0.0)
Total 65 7 29 6
on May 15, 2020 by guest
http://jcm.asm.org/
20.Ogata, N., H. J. Alter, R. H. Miller, and R. H. Purcell.1991. Nucleotide sequence and mutation rate of the H strain of hepatitis C virus. Proc. Natl. Acad. Sci. USA88:3392–3396.
21. Okamoto, H., H. Tokita, M. Sakamoto, M. Horikita, M. Kojma, H. Iizuka, and S. Mishiro.1993. Characterization of the genomic sequence of type V (or 3a) hepatitis C virus isolates and PCR primers for specific detection. J. Gen. Virol.74:2385–2390.
22. Pohjanpelto, P., M. Lappalainen, A. Widell, K. Asikainen, and M. Paunio.
1996. Hepatitis C genotypes in Finland determined by RFLP. Clin. Diagn. Virol.7:7–16.
23. Simmonds, P.1995. Variability of hepatitis C virus. Hepatology21:570–583. 24. Stuyver, L., W. van Arnhem, A. Wyseur, F. Hernandez, E. Delaporte, and G. Maertens.1994. Classification of hepatitis C viruses based on phylogenetic analysis of the envelope 1 and nonstructural 5B regions and identification of five additional subtypes. Proc. Natl. Acad. Sci. USA91:10134–10138. 25. Stuyver, L., A. Wyseur, W. van Arnhem, F. Hernandez, and G. Maertens.
1996. Second-generation line probe assay for hepatitis C virus genotyping. J. Clin. Microbiol.34:2259–2266.
26. Tuveri, R., C. Rothschild, S. Pol, D. Reijasse, T. Persico, C. Gazengel, C. Bre-chot, and V. Thiers.1997. Hepatitis C virus genotypes in French haemophili-acs: kinetics and reappraisal of mixed infections. J. Med. Virol.51:36–41.