2017 3rd International Conference on Artificial Intelligence and Industrial Engineering (AIIE 2017) ISBN: 978-1-60595-520-9
Evaluation of the Variation Process of Bearing Vibration Based on
Non-ordered Gray Relation (Part II: Experiment)
Xin-tao XIA, Xiang-feng CHEN
*, Li CHENG and Bin LIU
Mechatronical Engineering College, Henan University of Science and Technology, Luoyang 471003, China
*Corresponding author
Keywords: Bearing vibration variation, Original data, Intrinsic data sequence, Gray confidence level.
Abstract. In order to analyze the process of bearing vibration variation, the original vibration data of four kinds of damage diameters are grouped, and the intrinsic data sequence is selected after grouping. Then, the non-ordered gray relation between data sequence of different groups and the intrinsic data sequence is established and the gray confidence level is obtained. The gray confidence level is compared with the set threshold of 90%. Then the variation of the bearing vibration is evaluated. The correctness and feasibility of the proposed method are verified by comparing the assessment with the actual situation.
Introduction
During the service period of bearings, the vibration performance of the bearing decreases gradually with time due to the loss of the constituent element, the movement of the auxiliary sub-gap or the friction, that is, the vibration variation[1]. Rolling bearings as the important implementation of components and wearing parts of a mechanical transmission system, the health condition of its performance is of great significance to maintain the stable operation of the system[2]. For example, the bearing fatigue life, friction torque, vibration and noise and other performances will directly affect operation status of the host[3]. Vibration variation means that the bearing damage occurred and its sustainable development will inevitably lead to functional failure of the host, resulting in huge losses or even disaster. In order to avoid serious disaster, bearing vibration variation evaluation is very important. Therefore, the evaluation of bearing vibration variation process has aroused great concern of scholars at home and abroad.
L.D. Chen proposed creatively the use of atomic absorption spectrometry to determine bearing abnormal sound failure of car engine crankshaft[4]. Based on the derivation of bearing failure model of subway vehicle bogie, J.Q. Liu proposed a intelligent method for fault diagnosis of subway vehicle bogie[5]. EL Morsy used the optimal morlet wavelet filtering and envelope detection to analyze the experimental signals of the inner ring failure of rolling bearing[6]. Uddin S proposed a K-NN classification algorithm which can improve performance in bearing fault diagnosis[7].
gray confidence level. By comparing the obtained gray confidence level with the set threshold of 90%, the dynamic evaluation of the bearing vibration variation process is finally realized.
Experimental Process
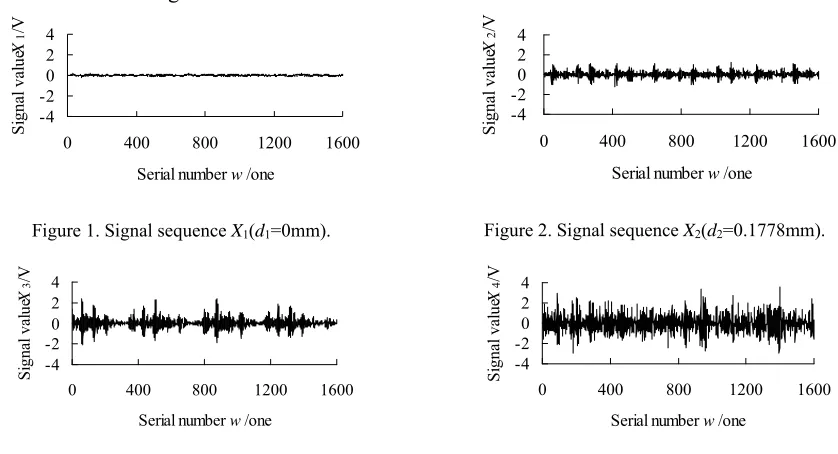
This is a case where the variation of bearing vibration is caused by wear from the surface of the channel. The test data comes from the bearing data center website at the University of Case Western Reserve, which has a dedicated rolling bearing failure simulation test stand. The test bed consists of an electric motor, a torque sensor/ decoder and a power tester. SKF6205 bearings supported the rotation of the motor shaft can be tested. The acceleration of the bearing is measured with an acceleration sensor. Bearing speed is 1797r/min and the sampling frequency is 12kHz. The bearing
inner ring channel damage diameter is set respectively to d1=0mm, d2=0.1778mm, d3=0.5334mm and
d4=0.7112mm. The bearing vibration acceleration signal data sequences obtained by the acceleration
sensor are shown in Figures 1 to 4.
-4 -2 0 2 4
0 400 800 1200 1600 Serial number w/one
S
ignal
va
lue
X1
[image:2.612.97.516.248.475.2]/V
Figure 1. Signal sequence X1(d1=0mm).
-4
-20
2 4
0 400 800 1200 1600
Serial number w/one
Si
gnal
va
lue
X
2
[image:2.612.102.277.258.337.2]/V
Figure 2. Signal sequence X2(d2=0.1778mm).
-4 -2 0 2 4
0 400 800 1200 1600 Serial number w/one
S
ig
nal
v
al
ue
X
3
/V
Figure 3. Signal sequence X3(d3=0.5338mm)
-4 -2 0 2 4
0 400 800 1200 1600 Serial number w/one
S
ignal
va
lue
X
4
/V
Figure 4. Signal sequence X4(d4=0.7112mm)
The data sequence X1 is divided into four groups of 14 and each group of has 400 data, that is,
1=1400, 2=401800, 3=8011200, 4=12011600. Then set 1=1400 as the intrinsic data
sequence, the gray confidence level P12, P13, P14 of the other three groups relative to the intrinsic data
sequence can be calculated. Similarly, for the data sequence X2X4, the gray confidence level P12, P13,
[image:2.612.336.515.259.341.2]P14 relative to the intrinsic data sequence can be obtained as shown in Table 1.
Table 1. The gray confidence level of 2, 3, 4 relative to 1 of X1X4.
Data sequence The gray confidence level
P12 P13 P14
X1(d1=0.0000mm) 0.9847 0.9941 0.9681
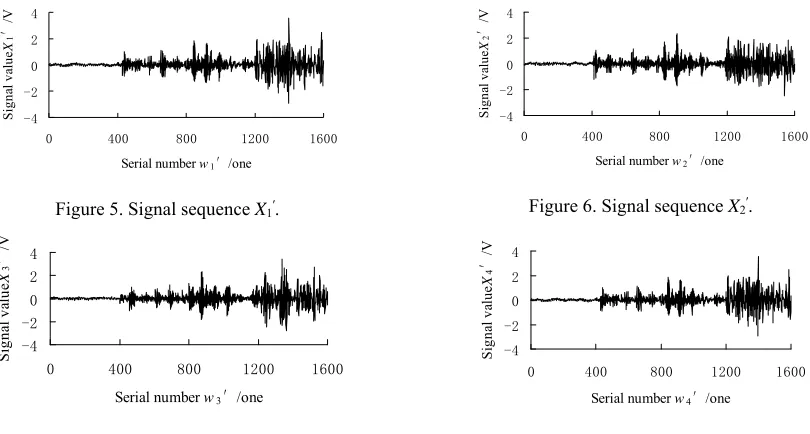
[image:2.612.90.521.588.665.2]damage diameters as the amount of damage produced by the operation of bearing through the four time intervals, the four damage diameter data needs to be grouped and reorganized. Through the operation of four time intervals, bearing vibration variation really happened. In order to simulate the amount of damage produced by the operation of bearing through the four time intervals, the specific
approach is as follows. Respectively, taking 1=1400 of the data sequence X1X4, a new data
sequence X1′ is formed by connecting them in turn. Similarly, respectively, taking 2=401800 of the
data sequence X1X4, X2′ is also formed by connecting them in turn. And so on, X3′ and X4′ is also
formed. X1′ X4′ are shown in Figure 5 to 8.
-4 -2 0 2 4
0 400 800 1200 1600
Serial number w1′/one
S
igna
l va
lue
X1 ′/V
Figure 5. Signal sequence X1′.
-4 -2 0 2 4
0 400 800 1200 1600
Serial number w2′/one
Si
gn
al
v
al
ue
X
2
[image:3.612.104.509.179.396.2]′/V
Figure 6. Signal sequence X2′.
-4 -2 0 2 4
0 400 800 1200 1600
Serial number w3′/one
S
ign
al
va
lue
X
3
′/V
Figure 7. Signal sequence X3′.
-4 -2 0 2 4
0 400 800 1200 1600
Serial number w4′/one
Si
gn
al
v
al
ue
X
4
′/V
Figure 8. Signal sequence X4′.
The data sequence X1′ is divided into four groups of 14 and each group of has 400 data, that is,
1=1400, 2=401800, 3=8011200, 4=12011600. Then set 1=1400 as the intrinsic data
sequence, the gray confidence level P12, P13, P14 of the other three groups relative to the intrinsic data
sequence can be calculated. Similarly, for the data sequence X2′ X4′, the gray confidence level P12,
P13, P14 relative to the intrinsic data sequence can be obtained as shown in Table 2. X1′ X4′ are
[image:3.612.109.503.532.609.2]vibration signal data of the amount of damage produced by the operation of bearing through the four time intervals.
Table 2. The gray confidence level of 2, 3, 4 relative to 1 of X1′ X4′.
Data sequence The gray confidence level
P12 P13 P14
X1′ 0.7730 0.6815 0.5455
X2′ 0.7865 0.7080 0.5475
X3′ 0.7385 0.6260 0.5265
X4′ 0.7455 0.6715 0.5255
According to Table 2, the change curve of gray confidence level of data sequence X1′ X4′ with the
0 0.2 0.4 0.6 0.8 1
0 0.2 0.4 0.6 0.8
Damage diameter d/mm
Gr
ay
co
nf
id
en
ce l
ev
el
[image:4.612.180.434.77.200.2]X1′ X2′ X3′ X4′
Figure 9. The change curve of gray confidence level of X1′ X4′.
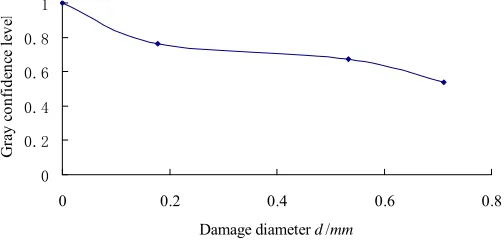
In order to eliminate the influence of random error, P12, P13, P14 corresponding to X1′ X4′ are
averaged to obtain new gray confidence levels. Then the change curve of new gray confidence level with the damage diameter increases is shown in Figure 10.
0 0.2 0.4 0.6 0.8 1
0 0.2 0.4 0.6 0.8
Damage diameter d/mm
G
ra
y
con
fi
de
nc
e
le
ve
l
Figure 10. The change curve of the new gray confidence level.
[image:4.612.182.434.281.401.2]or even disaster caused by the bearings failure and provides scientific decision-making. This analysis method is also a useful complement to the existing bearing fault diagnosis theory.
Acknowledgement
This project is supported by Natural Science Foundation of Henan Province of China (Grant No. 162300410065).
References
[1] D.H. Zhou, M.H. Wei, X.S. Si. A survey on anomaly detection, life prediction and maintenance decision for industrial processes, J. ACTA Automatica Sinica. 39 (2013) 711-722.
[2] Z.J. Jue, X.H. Jin, Y. Sun. Remaining useful life prediction for bearings with the unscented Kalman filter-based approach, J. Chinese Journal of Scientific Instrument. 37 (2016) 2036-2043. [3] L.J. Zhang, Y.Q. Wang. Influence of vibration and shock on transient thermal Elastohydrodynamic lubrication of seawater-lubricated plastic bearings, J. Journal of Vibration and Shock. 32(2013)203-208.
[4] L.D. Chen, Y.R. Zhao. Application of microwave digestion/ASS in detecting crankshaft bearing knock, J. Spectroscopy and Spectral Analysis. 22(2014)201-215.
[5] J.Q. Liu, Z.B. Zhao, G.P. Zhang. Research on fault diagnosis method for bogie bearings of metro vehicle, J. Journal of the China Railway Society. 11(2005)109-115.
[6] E.L. Morsy, Mohamed, Achtenova, et al. Application of optimal morlet wavelet filter for bearing fault diagnosis, J. Journal article(JA). 8(2015)817-824.
[7] Uddin S., Islam M.R., Khan S.A. Distance and density similarity based enhanced K-NN classifier for improving fault diagnosis performance of bearings, J. Shock and Vibration. 2016(2016)29-39. [8] X.T. Xia, L. Ye, Z. Chang. Prediction for variation process of reliability on vibration performance of rolling bearings under the condition of poor information, J. Journal of Vibration and Shock. 36(2017)105-112.
[9] X.T. Xia, J.M. Zhu, T.M. Lv. Inference of Poor Information of Friction Torque of Rolling Bearing, Science Press, Beijing, 2010.