ISBN: 978-1-60595-544-5
Simulation of Ship-ice Collision Considering the Effect of Temperature
Tong-qiang YU, Kun LIU, Zi-li WANG and Yan SHEN
School of Naval Architecture and Ocean Engineering, Jiangsu University of Science and Technology, Zhenjiang, Jiangsu, China
Keywords: Ship structures, Ship-ice collision, Ice material constitutive, Temperature.
Abstract. The full opening of the northern shipping line puts forward a great challenge for the safety of polar ships, the presence of floating ice increases the possibility of collision between ship and sea ice. However, due to the complex mechanical properties of sea ice, a reasonable description of its material constitutive relation is the main factor affecting the accusation of calculation and analysis. In this paper, a constitutive model of ice material considering the effect of temperature is presented, a user-defined subroutine is developed and embedded into the finite element software LS-DYNA. Based on this, the damage and deformation characteristics of the ship structure and ice is studied, and effects of collision scenario parameters are discussed. The results of this paper can provide reference for the design and manufacture of polar ships.
Introduction
Arctic sea ice, especially summer sea ice, is declining at a rate of 10% per decade [1]. The full opening of the Arctic channel becomes possible and the polar shipping industry is bound to grow rapidly. However, due to the complicated environmental features in polar waters, the safety of ships in ice-bound areas is gaining more and more attention because there is still a large sum of floating ice even in summer. Ship-ice collision will result in damage to the ship, water or even sink, causing significant loss of life and property. Therefore, the research on the collision performance of polar ships is of great importance to reduce the loss of polar ice collision and for polar ship design.
Foreign studies on ice material and ship-ice collision started early. In 1968 Peyton [2] began to study the intensity of sea ice. Dempsey and Ian J. Jordaan [3, 4] gave analytical methods for ice loading and ice pressure. Tatinclaux J C [5] and Valanto [6] carried out model scale tests using the R-class icebreaker and the Swedish coast guard ship KBV-181 model and the thrust and drag data were recorded and analyzed. Frederking R. [7] studied the effect of strain rate on ice loading through comparative experiments. With the rapid development of computer simulation technology, commercial finite element analysis software is increasingly used to simulate ice material and ice load. Gagnon [8] used the foam material to simulate the brittleness of ice, and obtained a good consistency with the Terry fox real-ship test. The Kelvin-Voigt viscoelastic constitutive theory was introduced into the sea-ice dynamics by Shunying J. [9], which well reflected the viscoelastic behavior of the sea ice in Bohai Sea at small strain and strain rate. In addition, many other materials are studied but due to the complexity of materials, there is still no authoritative and uniform solution for this problem at present.
In this paper, an elastic-plastic constitutive model is adopted and the influence of temperature on the yield function and failure criterion is considered. The sea ice material model is established and embedded in the LS-DYNA material library by secondary development. Based on this, the mechanism of damage and deformation of hull structures during ship-ice collision is analyzed.
Ice Material
Ice Material Model
1
2 2
max
( ) ( ) 1
c
p p
(1)
Where, and 1 are the oval center coordinates, is the deviator stress, p is hydrostatic
pressure, max, pc are the maximum deviator stress and truncated hydrostatic stress respectively. Since multi-years sea ice is isotropic, the above equation can be written as [12].
, 2
2
0 1 2
0f p J J a a p a p (2)
where f p J
, 2
is the yield function, and J2 is the second deviator invariant, a0,a1,a2 areconstants, J2 can be expressed in terms of the stress component as:
2
2
2
2 2 2
2 x y y z z x 6 xy yz zx / 6
J
(3)
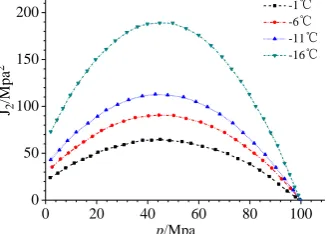
The arctic temperature can reach -20℃~-30℃ in winter and the yield function parameters a0,a1,
2
a are significantly affected by temperature. The yield curve at different temperatures is shown in Figure 1 [11], from which the temperature-dependent yield function f T( ) can be obtained.
0 20 40 60 80 100
0 50 100 150 200
J2
/M
p
a
2
p/Mpa
-1℃
-6℃ -11℃
[image:2.595.218.382.322.439.2]-16℃
Figure 1. Yield curve at different temperatures.
Based on the above conclusions, an ideal elastic-plastic ice material model based on Tsai-Wu yield criterion ( f J( 2, , )p T ) is put forward considering the influence of temperature. The
constitutive model satisfies the isotropic generalized Hooke's law in the elastic phase:
2 ,
2 ,
2 ,
x x v xy xy
y y v yz yz
z z v xz xz
G G
G G
G G
(4)
Where v x y z, GE/ 2 1
is the shear modulus of elasticity, E is the elastic modulus, is poisson's ratio, j is shear strain, j 2 j
jxy yz zx, ,
, is the lame constant.In the plastic phase, the plastic strain increment is:
p f
d d
(5)
Using plastic flow law, as the yield function, so the above formula can be written as:
1 3
2
Tsai Wu
e p
ij ij ij ij
ij
f
d d d d dp d
G E
(6)
Where dij is the stress increment, ij is the Kronecker symbol.
When eqp >f or p pcut, the element fails, where eqp is the equivalent plastic strain, f is
the failure strain, f 0
p p T/ 2( ) 0.6
2.pcut is the cut off stress, set to 2MPa, 0 is the initial failure strain, set to 0.01.Stress Update Algorithm
For rate-independent plasticity, the commonly used constitutive integral algorithm has explicit algorithm, implicit algorithm and semi-implicit algorithm. In this paper, the semi-implicit algorithm is used. The integral expression can be expressed as:
n 1 n
n 1 1
n 1 1
n 1 1 1
n 1 1 1
=
=
=
= : ( )
= ( ) 0
p p
n n n
n n n
p
n n
n n
r
q q h
C
f f q
(7)
Wheren1can be written as:
1 1 1
1
1
1
1 1
1 1 1
: ( )
: ( )
: ( ) : :
( : ) :
:
:
p p
n n n n
p p
n n n
p p
n n n
p
n n
trial p
n n
trial
n n n
C
C
C C C
C C
C
C r
(8)
In the formula, 1
trial n
is test stress for elastic prediction, and n1C r: n1 is plastic correction.
Ice Material Verification
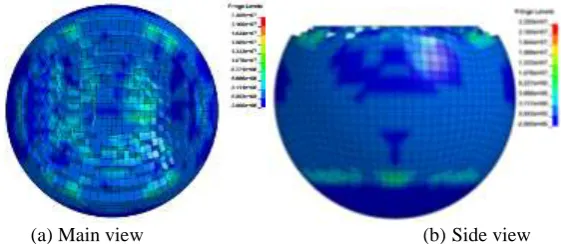
[image:3.595.157.438.495.617.2](a) Main view (b) Side view
Figure 2. 0.5s when the deformation of the ball.
0.0 0.2 0.4 0.6 0.8 0
5 10 15
Force
/MN
Time/s
0.00 0.25 0.50 0.75 1.00 0
50 100 150
Pr
es
sure
/MPa
Area/m2
Pressure value
ISO
Molikpaq Design Timco
Figure 3. Crash force - time curve. Figure 4. Pressure area curve.
The crushing force and pressure-area curve is shown in Figure 3 and Figure 4. It can be seen that the force shows typical non-linear characteristics, at the very beginning, the contact area of the ball changes quickly, the contact force increases significantly, with the crushing process goes on, the area change rate decreases, the overall change in force tends to be flat. From Figure 4, we can see that the general trend of the pressure-area curve is the same as the ISO standard, generally. The value of the pressure-area curve is relatively smaller and has a certain error when the contact area is small, and tends to be closer thereafter, the value is slightly smaller than the standard and is in the acceptable range.
Figure 5 and Figure 6 show the failure stress and strain curve of the element under different temperatures. It can be seen that as the temperature decreases, the yield stress increases, the material becomes harder, while the failure strain decreases, the material becomes brittle. This is in line with the actual situation.
-30 -25 -20 -15 -10 -5 0 10
15 20 25 30 35
Stress
/M
Pa
Temperature/℃
-30 -25 -20 -15 -10 -5 0 0.150
0.165 0.180 0.195 0.210
Strai
n
[image:4.595.112.490.72.232.2] [image:4.595.315.493.411.549.2]Temperature/℃
Figure 5. Stress-temperature curve. Figure 6. Strain-temperature curve.
Finite Element Simulation Analysis
Typical Scenario
The typical scenario of floating ice-side impact is shown in Figure 7. The shape of the contact surface is ridge, the initial impact velocity is 8m/s and the impact position is located at the second deck position. Using the ordinary structural steel, the material parameters of steel and ice are shown in Table 1, the stress-strain curve of steel is shown in Figure 8.
Table 1. Material parameters.
Material Density / 3
Kg m Elastic Modulus /Pa Poisson's ratio Yield stress /MPa Failure response
Steel 7850 2.06e11 0.3 285 0.3
[image:4.595.102.277.412.548.2]
0.0 0.2 0.4 0.6 0.8 1.0 0
150 300 450 600
St
res
s/
M
Pa
Strain
Figure 7. Operating conditions diagram. Figure 8. Stress-strain curve.
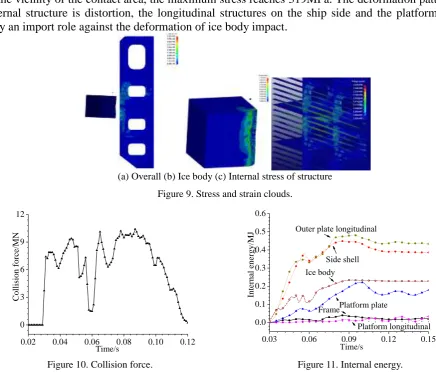
In the typical scenario, the damage and deformation diagram of ice body and the side structure are shown in Figure 9, where the serrated deformation of the ice body, accompanied by fragments generation can be seen. The ice fragments are distributed along the contact area and are more serious at the central position. Side deformation occurred but not ruptured, the stress concentration in the vicinity of the contact area, the maximum stress reaches 319MPa. The deformation pattern of internal structure is distortion, the longitudinal structures on the ship side and the platform plate play an import role against the deformation of ice body impact.
[image:5.595.141.451.69.220.2](a) Overall (b) Ice body (c) Internal stress of structure
Figure 9. Stress and strain clouds.
0.02 0.04 0.06 0.08 0.10 0.12
0 3 6 9 12
Co
ll
isi
o
n
f
o
rce
/M
N
Time/s
0.03 0.06 0.09 0.12 0.15 0.0
0.1 0.2 0.3 0.4 0.5 0.6
Platform plate Frame
Platform longitudinal
Ice body Side shell
Int
erna
l en
ergy
/MJ
Time/s
[image:5.595.72.509.300.676.2]Outer plate longitudinal
Figure 10. Collision force. Figure 11. Internal energy.
The collision force is shown in Figure 10. It can be seen that the entire collision process lasts 0.12s, the impact force shows typical nonlinear characteristics, accompanied by multiple peaks, with a minimum value at 0.06s due to the relatively flat contact surface and small contact area, as well as the orderly rows element arrangement, resulting in the simultaneous failure of a large number of elements and the collision force dramatic changes. As the collision progressed, the contact area becomes larger, the collision force returned to normal level.
longitudinal absorb a large proportion of energy. While the energy absorption of the frames and the platform longitudinal is small and is negligible.
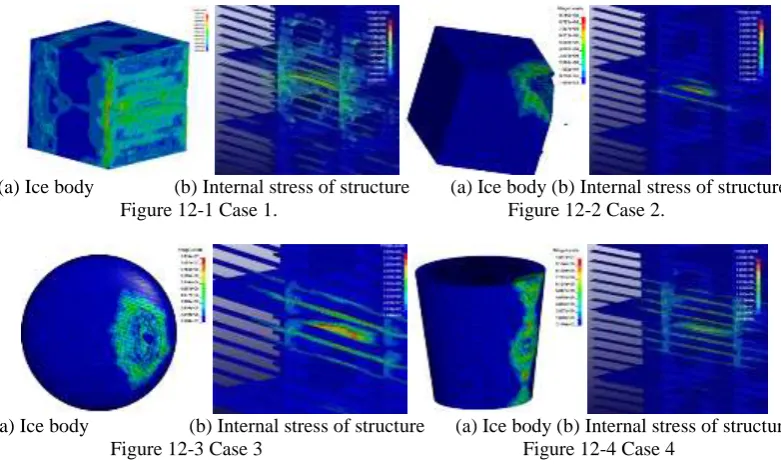
Different Shapes of Ice Body
The shape of the ice bodies is diverse, but for the contact area, it can be divided into ridge, spheres and planes etc. In this paper, we select the cubic ice body's surface, edges as well as sphere and cone marked as case1~case4 to study. Figure 12 shows the damage and deformation of ice body and side structure.
[image:6.595.101.492.177.412.2](a) Ice body (b) Internal stress of structure (a) Ice body (b) Internal stress of structure Figure 12-1 Case 1. Figure 12-2 Case 2.
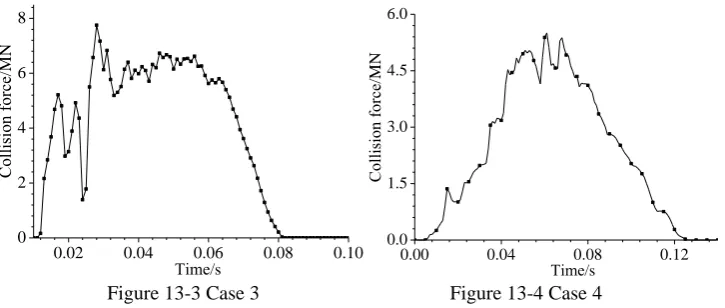
(a) Ice body (b) Internal stress of structure (a) Ice body (b) Internal stress of structure Figure 12-3 Case 3 Figure 12-4 Case 4
Figure 12. Different conditions of stress and strain cloud.
It can be seen that the deformation of ice bodies and structures are significantly different under different contact surfaces. Compared with the typical scene, when the contact surface is spherical, the ice body has broken, the stress distribution is more concentrated and the deformation of side structure is more serious. While when the contact surface is flat, both the ice body and the structure experience a small deformation, the range of stress distribution is obviously extended. Different ice bodies' sharp parts have broken in the collision process, at the same time, it can be seen that there is no broken on the sides but still some deformation will occur.
The collision force under different contact surfaces is shown in Figure 13, it can be seen that the trend and the peak value of contact force under different contact surfaces are different. When the contact surface is plane (case 1), the maximum force value has a significant increase compared with other cases, and the duration time is significantly shortened. When the contact area is a cube corner (case 2), the peak force is the smallest but the duration time is the longest.
0.01 0.02 0.03 0.04 0.05 0.06 0.07 0
10 20 30 40 50
Co
ll
isi
on
f
orce
/M
N
Time/s
0.00 0.06 0.12 0.18 0
1 2 3 4
Co
lli
sio
n f
orce
/M
N
Time/s
[image:6.595.78.502.565.751.2]0.02 0.04 0.06 0.08 0.10 0
2 4 6 8
Co
lli
sio
n f
orce
/M
N
Time/s 0.00 0.04 0.08 0.12
0.0 1.5 3.0 4.5 6.0
Co
lli
sio
n f
orce
/M
N
Time/s
[image:7.595.120.483.71.225.2]Figure 13-3 Case 3 Figure 13-4 Case 4
Figure 13. Collision force.
Different Temperature
Figure 14 and Figure 15 show the peak collision force and the internal energy of the main components at different temperatures. It can be seen that the peak force slightly decreases as the temperature decreases, this is because the ice body element is more likely to fail at low temperature even though the strength and hardness of ice increases with the decrease of temperature. From figure 15 we can see that the energy absorption at different temperatures are basically the same, especially the energy absorption ratio. With the decrease of temperature, the total energy absorbed by the structure increases, indicating that the more kinetic energy turns into the energy of the structure, at the same time, the outer plate longitudinal and the side shell are the main component resist the deformation.
-20 -15 -10 -5 0 5
6 7 8
Peak
f
o
rce
/M
N
Temperature/℃
-20 -15 -10 -5 0 0.0
0.1 0.2 0.3 0.4 0.5 0.6 0.7
Platform longitudinal Frame Platform plate
Ice body Side shell
Int
erna
l en
ergy
/MJ
Temperature/℃
[image:7.595.105.497.395.536.2]Outer plate longitudinal
Figure 14. Peak force. Figure 15. Internal energy.
Conclusion
In this paper, a LS-DYNA material subroutine was used considering the effect of temperature. The typical scenario is established and the collision parameters are studied. The main conclusions are as follows:
(1) The constitutive material model developed in this paper shows the characteristics of ice load well. The pressure-area curve is consistent with the ISO standard and other experimental results. The temperature has a direct effect on the material properties, as temperature decreases, the material becomes harder and more brittle.
(2) For ship-floating ice collision, the hull plate will not be broken but the collision will still cause the outer surface permanent deformation. Therefore it still needs a certain degree of strengthening.
Reference
[1] Zheng L, Zhang Z H, Li Q, et al. Recent 30 years Arctic sea ice anomalous trend [J]. Polar Research, 2009, 21(4):344-352. (in Chinese)
[2] Peyton H R. Ice And Marine Structures: Pt. 1, The Magnitude Of Ice Forces Involved In Design [J]. Ocean Industry, 1968, 3.
[3] Dempsey J P, Shen H H. IUTAM Symposium on Scaling Laws in Ice Mechanics and Ice Dynamics [M]. Springer Netherlands, 2001.
[4] Jordaan I J. Mechanics of ice-structure interaction [J]. Engineering Fracture Mechanics, 2001, 68(17–18):1923-1960.
[5] Tatinclaux J C, Alekseyev J, Enkvist E, et al. Comparative model tests in ice of a Canadian coast guard R-class icebreaker[J]. Society of Naval Architects and Marine Engineers-Transactions, 1989, 97.
[6] P. Valanto. The Resistance of Ship [J] SNAME Transactions, 2001. 109:53-58.
[7] Frederking R. Rate effect on ice impact forces [J]. Report, 2011.
[8] Gagnon R E, Derradji-Aouat A. First results of numerical simulations of bergy bit collisions with the CCGS Terry Fox icebreaker [J]. Aouat, 2006.
[9] Ji S Y, Yue Q J. Viscoelasto-plastic constitutive model of sea ice in the Bohai Sea [J]. Water Science Progress, 2002, 13(5):599-604. (in Chinese)
[10] Gagnon R E, Gammon P H. Triaxial experiments on iceberg and glacier ice [J]. Journal of Glaciology, 1995, 41(139):528-540.
[11] Derradji-Aouat A. A unified failure envelope for isotropic fresh water ice and iceberg ice[C]// 2000.