COPING: Children of Prisoners, Interventions and Mitigations to Strengthen Mental Health.
Perspectives of Children, Parents and Carers – Survey Analysis Results
Original Citation
Manby, Martin and Jones, Adele (2011) COPING: Children of Prisoners, Interventions and
Mitigations to Strengthen Mental Health. Perspectives of Children, Parents and Carers – Survey
Analysis Results. Research Report. University of Huddersfield.
This version is available at http://eprints.hud.ac.uk/id/eprint/22476/
The University Repository is a digital collection of the research output of the
University, available on Open Access. Copyright and Moral Rights for the items
on this site are retained by the individual author and/or other copyright owners.
Users may access full items free of charge; copies of full text items generally
can be reproduced, displayed or performed and given to third parties in any
format or medium for personal research or study, educational or notforprofit
purposes without prior permission or charge, provided:
•
The authors, title and full bibliographic details is credited in any copy;
•
A hyperlink and/or URL is included for the original metadata page; and
•
The content is not changed in any way.
For more information, including our policy and submission procedure, please
contact the Repository Team at: [email protected].
1
D1.1
Survey Analysis Results – 200 Surveys
Nature:
Report
Dissemination Level:
Public
Owner
Name:
COPING
Lead Beneficiary:
University of Huddersfield
Phone:
00 44 (0)1484 473237
E-mail:
Context
Author(s):
Work Package:
WP1
Task:
Complete Report
Document Status
Version:
00.01
Last modified:
01.09.11
Status:
Final
Approved by:
Date Approved:
2
Table of Contents
page
1. Introduction ... 3
2. Methodology ... 4
Results
3. United Kingdom
... 6
4. Germany
... 11
5. Romania
... 16
6. Sweden
... 20
7. Conclusions ... 26
References ... 27
Appendix 1 UK tables
Appendix 2 Germany tables
Appendix 3 Romania tables
3
1. Introduction
This document comprises the final reports (D1.1 Survey Analysis Results – 200 Surveys) on work package 1 (WP1) - Identification of suitable cohorts of children – in Germany, Romania, Sweden and
the UK. (In the interest of brevity the term ‘child’ is used in this report to refer to both children and young people i.e. persons under the age of 18 years.) The purpose of this report is to provide an overview of the manner in which the research has progressed and the key findings emerging from the study.
The objectives of WP1 were to:
‘a) assess the mental health characteristics of the children of prisoners and b) identify a cohort of children of prisoners in the four countries for the qualitative interview process of WP2’ (Document of Work, p. 34).
WP1 took the form of a questionnaire-based survey among the children of prisoners and their non-imprisoned parents/carers. It was originally envisaged that WP1 would comprise administration of the Goodman Strengths and Difficulties Questionnaire (Goodman, 1997) and the Rosenberg Self-Esteem Scale (Rosenberg, 1989) to children aged 11-16 years, and the collection of more general information from these children and their non-imprisoned parents/carers. This more general information was to cover: the characteristics of the imprisoned parents/carers; risk and protective factors in the lives of the children; and resilience amongst these children.
It was decided, during the planning stage of WP1, that the information collected in this phase of the research should be more wide-ranging and ambitious than was originally envisaged. This was to ensure that WP1 was as valuable as possible – in terms of the amount of data it generated – but also to ensure that sufficient analysis could be carried out of the various causes, effects and mitigating factors that might exist in the lives of children of prisoners. The categories under which information is being collected are outlined below (under Methodology).
There were a small number of other quite substantial changes to the original methodology. These changes and the reasons for them are as follows:
The age range of the children taking part in WP1 was extended from 11-16 years to 7-17 years. The primary reason for this was to enable the COPING project to comment upon the mental health of a considerably larger section of the child population.
A deliberate effort was made to recruit, into the survey, children who were in state care. The reason for this was that it was felt that this group might have particularly acute issues in terms of parental/carer imprisonment but might otherwise be missed if we used only the standard recruitment policy (described below).
The target number of children taking part in the survey (in each country) was raised from 200 to 250. This was on the advice of the EC reviewers who had assessed the research proposal – their belief being that this would increase the statistical power of the study.
4
Despite these challenges, the COPING team, have between them, gathered a substantial body of data on the mental health and the more general well-being of children, in four EU states, who have a parent/carer in prison. There are some similarities between the situation of these children in each of the four countries but also important differences. We are confident that the results of the COPING research can and will be used to raise awareness of these children’s situation but also to improve policy and practice in the four countries concerned but also across the EU as a whole.
Originally, COPING was required to produce four separate deliverables for the final report stage of WP1 (D1.2, 1.4, 1.6 and 1.8). We have since been asked to produce a single document, containing all of these deliverables. This report comprises, therefore, separate reports from each country. Each of these country specific reports contains an outline of the exact methodology that was used, followed by an overview of the major findings from that country. All of the tables and figures used in this report have been placed in appendices. This is to avoid the main body of the report being overly long.
2. Methodology
In the interests of brevity, this section of the report provides a general outline of the methodology that was used across the whole of the COPING project but particularly in the UK (who were the work package leaders for this stage of the research). The German, Romanian and Swedish reports contain further details on the particular methodology used in their country and the way in which it has diverged from this general plan.
2.1 Sample
The original intention had been to select a purposive sample of children but one that was stratified according to the following criteria: children’s gender; and the gender and ethnicity of the imprisoned parent/carers. In terms of children’s gender, we have recruited a fairly even balance of boys and girls. We did, however, have to strive to manipulate our choice of prisons to ensure an appropriate mix of imprisoned parents/carers in terms of ethnicity and even more so in respect of gender.
Other than the above, though, we have relied quite heavily upon convenience sampling to recruit children and their non-imprisoned parents/carers. This is largely because of the practical difficulties we have encountered in recruiting sufficient numbers of individuals into the survey. These difficulties will be discussed more fully in subsequent publications. The method by which the sample was recruited will be taken into account in subsequent analysis of the data.
2.2 Instrument
The structure of the child and the non-imprisoned parent/carer questionnaires is shown in Figure 1, with individual topics listed in the order in which they appeared in the questionnaires (see Appendix 1). As is clear from Figure 1, the child, and even more so the parent/carer questionnaires, were, in terms of topics covered, quite substantial and wide-ranging.
2.3 Procedure
Most of the children and their non-imprisoned parents/carers were recruited via approaches made, first, to the non-imprisoned parent/carer when they were visiting the imprisoned parent/carer in prison. These approaches were made in prison visiting centres. If a parent/carer was willing for his/her child to take part in the survey, then an approach was made to the child. Children and parents/carers sometimes completed their questionnaires while they waited to visit the imprisoned parent/carer. Questionnaires were, though, completed and returned under a quite wide range of circumstances. These included:
5
Children and parents/carers taking questionnaires home with them and then returning them,completed, through the post.
Children and parents/carers attending the offices of the key voluntary organisation in this research (POPS) and completing questionnaires in that setting.
Fieldworkers, especially those from the University, visiting children and their parents/carers in their homes and administering questionnaires in that setting.
Fieldworkers approaching prisoners directly (in face-to-face meetings in prison) to ask them whether they thought their children and the children’s non-imprisoned parent/carer might take part in the research.
Prison staff making the above request of prisoners.
In the latter stages of the research, we approached additional voluntary organisations, working with prisoners’ families, and asked them to identify families to take part in the survey and/or administer the questionnaire.
The fieldwork for WP1 began in October 2010 and finished at the end of August 2011.
2.4 Analysis
6
3. UK
Results
At the time this report was being prepared, around the middle of August 2011, 445 questionnaires had been completed, 251 from children and 194 from parents/carers. The overlap between these questionnaires, in terms of whether they came from the same or different families, is shown in Table 1 (see Appendix 1). Questionnaires were completed by both the child(ren) and the parent/carer in more than two-thirds (68.6%) of families. There were, though, a notable minority of families (26.5%) where just the child(ren) completed questionnaires
The subsequent analysis is based upon the questionnaires that have been inputted into the SPSS database thus far: 229 child questionnaires and 174 parent/carer questionnaires.
Child questionnaire
Socio-demographic characteristics
3.1 Gender
The sample comprised almost equal proportions of males (51.1%) and females (48.9%) (Table 2).
3.2 Age
There was a fairly even spread of children in terms of their ages (Table 3a). The mean age of all children in the sample was 11.58 years (standard deviation (SD) 2.94 years) (n=228), although the mean age of the females was marginally higher than the mean age of the females (11.84 years compared to 11.59 years) (n=234) (Table 3b).
3.3 Ethnicity
With regards to ethnicity, 87.6% of children were White, 4.9% Asian and 3.1% Black, with 4.4% being of mixed ethnic origin (Table 4). Also provided in Table 4 are the relative proportions of the various ethnic groups in the UK population, as a whole, as measured in the 2001 census (Office of National Statistics, 2011). The UK COPING sample contains a slightly higher proportion of children from Black and Minority Ethnic (BME) groups than are present in the UK general population (12.4% and 8.0% respectively).
3.4 Specific well-being issues
Children were asked whether they had ‘a long-term disability, illness, medical condition or special need’. These conditions are, for the purposes of this report, collected together under the generic term ‘specific well-being issues’. A fairly notable minority of the children (14.2%), reported that they had at least one such specific well-being issue (Table 5). (The four major types of condition we asked about will be reported upon separately in our planned publications.)
Aspects of parental/carer imprisonment
3.5 Contact with imprisoned parent/carer
7
3.6 Effects of parental/carer imprisonment
When asked whether their parent/carer being in prison had had any bad effect for them, 110 children (48.5%) reported that it had, 74 (32.6%) that it had not with 43 (18.9%) indicated that they were not sure (Table 7a).
Of the 205 children who answered the question, 142 (69.3%) reported that the imprisonment of their parent/carer had not any good effect for them, compared to 10.2% (n=21) of children who believed it had (Table 7b). The remainder of children (n=42, 20.5%) were unsure whether parental imprisonment had had any positive consequences.
3.7 Receipt of help regarding parental/carer imprisonment
69.8% of children in the sample indicated that they had received some form of help in relation to their parent/carer being in prison (Table 8). Future analysis will explore who provided this help (for example, family members, statutory agencies or non-governmental organisations) and in relation to what areas of the child’s life (for instance, leisure activities, emotions and behaviour).
Mental health and well-being
3.8 Strengths and difficulties
The self-report Goodman (1997) Strengths and Difficulties Questionnaire (SDQ) is a behavioural screening instrument which elicits children and young peoples’ perceptions of their conduct, concentration, emotions and social relationships. The SDQ comprises 25 items in total with five items loading onto each of the five subscales: Emotional Symptoms; Conduct Problems; Hyperactivity; Peer Problems; and a Prosocial Scale. Scores on all five subscales range from 0-10. A higher score on the first four subscales indicates greater difficulties in that area. The Prosocial Scale measures the extent to which children are providing socially desirable answers with higher scores indicating greater social desirability.
The self-report SDQ is designed for use with children ‘aged around 11-16’ years, of whom there were 125 in our sample. Mean subscale scores for the current sample, followed by SDs in brackets, were:
Emotional Symptoms 2.32 (2.14); Conduct Problems 2.32 (1.80); Hyperactivity 3.98 (2.38); Peer Problems 1.86 (1.65); and the Prosocial Scale 7.50 (1.97) (Table 9a). Eventually, subscales scores will be compared with normative data in order to assess the level of difficulties experienced by children with a parent/carer against children in the general population.
The Total Difficulties Score is calculated by summing all of the subscales except the Prosocial Scale. Potential scores range from 0-40 with a higher score indicating greater difficulties overall. Children in the current sample produced a mean Total Difficulties score of 10.47 (5.92) (Table 9a).
The Total Difficulties score can be compared to normative population ranges to provide an indication of the likelihood that the child or young person will display mental health problems. Individuals with a score falling in the ‘normal’ range are unlikely to display mental health problems, those in the ‘borderline’ range have a slightly raised risk of experiencing mental health problems, whilst scores in the ‘abnormal’ range indicate substantial likelihood of mental health problems. 80.8% (n=101) of children’s scores in our sample fell in the ‘normal’ range, 10.4% (n=13) in the ‘borderline’ range and 8.8% (n=11) in the ‘abnormal’ range (Table 9b). Approximately one-fifth (19.2%) of the sample could be said to be at some heightened risk of experiencing mental health problems.
3.9 Self-esteem
8
potential scores, suggesting relatively high self-esteem, although these data will eventually need to be compared with normative population data.
The children’s SES scores were broken down into three broadly equal groups based upon the raw SES score (Table 10). Just over one-half (56%) of all the children were in the highest group (scores 30-40), with only 6 children (2.7%) in the lowest group (scores 10-19). Over four in ten children (41.3%), though, did record intermediate SES scores (20-29).
3.10 Quality of life
The KIDSCREEN self-report instrument elicits children and young peoples’ ratings of their health and well-being. The KIDSCREEN-27 instrument comprises 27 items which load onto five dimensions. The number of items on each dimension varies and a higher score indicates more positive health and well-being. The mean score for each dimension was as follows: Physical Well-being 20.03 (SD 3.90),
Psychological Well-being 28.66 (SD 4.65), Autonomy and Parent Relation 28.19 (SD 5.86), Social Support and Peers 17.03 (SD 3.33) and School Environment 15.05 (SD 4.02) (Table 11a). Raw scores will be compared with normative data to explore children of prisoners’ subjective health and well-being in relation to that of the general population.
The children’s five health-related quality of life scores were broken down into a number of broadly equal groups based upon raw KIDSCREEN scores (Table 11b). In general, large majorities of children were in each of the highest groups of KIDSCREEN scores. For example, 79.5% of children were in the top one-third of scores for the quality of life in terms of Social Support & Peers. There was one area where children appeared to score relatively less well, with 10.0% of children being in the lowest of the three groups for quality of life in respect of School Environment.
Non-imprisoned parent/carer questionnaire
Non-imprisoned parent/carer
3.11 Relationship to child
The large majority (78.6%) of the non-imprisoned parents/carers taking part in the survey were the children’s birth parents (Table 12a). The remaining parents/carers comprised much smaller proportions from other groups, including grandparents (10.4%) and step-parents (5.2%).
The largest single group of non-imprisoned parents/carers comprised the children’s birth mothers, accounting for almost three-quarters approximately (72.9%) of all parents/carer respondents (Table 12b). The next largest group of respondents consisted of birth fathers but these made up only 5.3% of all non-imprisoned parents/carers.
3.12 Quality of life
The World Health Organisation Quality of Life Scale (Brief version, WHOQOL-26) was administered to non-imprisoned parents/carers to obtain self-reported perceptions of their own quality of life. The WHOQOL consists of 26 items, with higher scores indicating more positive health and well-being. The first two items regarding Overall Perception of Quality of Life and Overall Perception of Quality of Health are examined separately. Potential scores range from 1-5 and the current sample produced a mean of 3.54 for overall quality of life and 3.62 for overall quality of health (SD 0.90 and 1.06 respectively) (Table 13a). The remaining 24 items load onto four domains which are multiplied by four to make them comparable to the full WHOQOL-100. Mean domain scores, with SDs in brackets, were as follows: Physical Health 15.22 (3.26); Psychological Well-being 14.01 (3.04); Social Relationships
9
The quality of life of the non-imprisoned parents/carers, as measured on all of the dimensions listed in Table 13b, was generally good. For example, over one-half (58.6%) of this group scored 4 or 5 (out of a maximum of 5) on Overall perception of quality of life. There was some variation with. For instance, non-imprisoned parent/carers appeared to score relatively poorly in terms of Social Relationships, with more than a quarter of this group (28.7%) being in the lowest two of the four bandings on this measure.
Imprisoned parent/carer
3.13 Relationship to child
The large majority (72.8%) of the imprisoned parents/carers were the children’s birth parents (Table 14a). The only other group of any appreciable size was step-parents making up just over one-tenth (12.7%) of all imprisoned parents/carers.
Just over one-half of all imprisoned parents/carers (56.8%) were the children’s birth fathers (Table 14b). The next largest group were birth mothers (16.6%). The only other group of any notable size were step-fathers accounting for 13.0% of all imprisoned parents/carers.
3.14 Gender
The large majority of imprisoned parents/carers (83.5%) were male (Table 15). Although only a relatively small minority of the imprisoned parents/carers were female (16.5%), the proportion is considerably higher than that of females in the UK prison population overall (4.9%) (Ministry of Justice, 2011).
3.15 Time spent in prison
Non-imprisoned parents/carers were asked to report on the amount of time the imprisoned parent/carer had spent in prison, to date, combining any period on remand with any period since being sentenced. Imprisoned parents/carers (n=168) had spent an average of 25.14 months (SD 32.24 months) in custody so far on their current sentence or period of remand. The minimum and maximum periods of imprisonment among these parents/carers was 1 and 180 months (15 years) respectively.
3.16 Current reason for imprisonment
Drugs offences (34.4%) and physical assault (18.9%) were the most frequently reported reasons for imprisonment, by far, accounting for more than one-half (68.85) of all charges against imprisoned parents/carer (Table 16).
Child
3.17 Contact with imprisoned parent/carer
98.3% of parents/carers indicated that their child had some form of contact with the imprisoned parent/carer. This could include visits, telephone calls or letters (Table 17). This figure is very close to the 94.7% figure for children who reported that they had contact with their imprisoned parent/carer.
3.18 Effects of parental/carer imprisonment
10
71.3% of parents/carers reported that the imprisonment of a parent/carer had not produced any good
effects for their child, compared to 14.4% that thought it had (Table 18b). The remaining parents/carers (14.4%) were unsure whether parental imprisonment had had any positive consequences. When compared to children’s own responses, it can be seen that there was little overall difference between children’s and parent/carer’s reports of positive consequences.
3.19 Needs
Non-imprisoned parents/carers were asked to indicate whether in the last three months their child had required help in one of 34 areas broadly relating to social contact and free time, school or work, parental imprisonment, psychological health, physical health, housing, self care, money and communication (Table 19). Parents/carers reported relatively high levels of need in a number of specific areas. These included: spending time with family (47.9% needed help); visiting imprisoned parents/carers (47.2%); following rules at school or work (44.1%); and general psychological problems (22.1%).
3.20 Strengths and difficulties
The parent/carer Strengths and Difficulties Questionnaire (SDQ) was used to elicit parent/carers’
perceptions of their child’s conduct, concentration, emotions and social relationships. The instrument and scoring is identical to that of the self-report scale. Given that the self-report SDQ is not suitable for children aged under 11, the informant SDQ can be used as a substitute. The informant SDQ can also be used to complement the self-report SDQ for children aged 11+. Mean scores for the current sample, with standard deviations in brackets, are as follows: Emotional Symptoms 2.52 (2.28);
Conduct Problems 2.36 (1.92); Hyperactivity 3.94 (2.40); Peer Problems 2.24 (1.76); and the
Prosocial Scale 7.69 (2.09) (Table 20a). Eventually subscales scores will be related to normative data to enable comparisons to be made between non-imprisoned parent/carers and parents/carers in the general population in terms of their respective ratings of their children’s strengths and difficulties.
As with the self-report item, the Total Difficulties Score can be compared to normative population ranges to provide an indication of the likelihood that the child or young person will display mental health problems. 64.7% of parents scored their child in the normal ‘range’ indicating mental health problems are unlikely, 16.8% in the ‘borderline’ range suggesting moderate likelihood of problems, and 18.5% - almost one in five - in the ‘abnormal’ range indicating substantial likelihood of problems (Table 20b).
3.21 Quality of life
The informant KIDSCREEN-27 instrument provides an indication of the parent/carers perception of their child’s health and well-being. The instrument and scoring is identical to that of the self-report scale. The mean score for each dimension, with SD in brackets, was as follows: Physical Well-being
20.44 (SD 3.74); Psychological Well-being 27.47 (SD 4.88); Autonomy & Parent Relation 27.30 (SD 5.44); Social Support & Peers 15.35 (SD 3.74); and School Environment 14.98 (SD 3.93) (Table 21a). Raw scores will be compared with normative data to explore the perceptions of parent/carers’ of children who have a parent/carer in prison in relation to the general population.
11
4. Germany
4.1 Introduction
This report provides an overview about previous activities during work package 1 (WP1) and of key findings emerging from the research of WP1.
The partnership in Germany comprised the NGO Treffpunkt e.V. - TREFF - based in Nuremburg (Bavaria) and the Technical University of Dresden – TUD - (Saxony). The fieldwork administration is carried out by TREFF, with TUD being responsible for the data management, analyses and the evaluation.
TREFF cooperated with prisons throughout Bavaria to identify potential participants. TREFF provided the prisons with posters and information cards to publicise and explain the research. The posters were displayed in the visitor waiting rooms, in the rooms reserved for visits and in the prison itself.
TREFF was present on visiting days in the prisons to recruit the non-imprisoned parent and hopefully the child also. If the child was not present at visiting time, TREFF gave the questionnaire to the parent/carer to take them home. TREFF also tried to acquire participants with the help of family workshops and father-child groups in the prison.
TREFF provided counselling centres throughout Germany with posters, information cards and questionnaires, and also talked to staff in these centres about strategies for recruiting children and parents.
TREFF inserted a call-up with a request to support COPING in the newsletter of the Federal Association for delinquents. This newsletter reaches many counselling centres in Germany.
TREFF participated in a local radio show, which explicitly addresses prisoners and their families. This radio show airs in prison, so that family and friends can send letters and email and have their greetings and wishes read out. TREFF started a call-up with a request to contact TREFF and to participate in Coping.
TREFF has launched a call-up with a request on it's own website, which is appealing directly to members asking them to participate. In order to reduce inhibitions and to guarantee anonymity TREFF provided the questionnaire as download on it's website.
TREFF has launched call-ups with requests on different relevant websites adressing families of prisoners.
TREFF, being a counselling centre itself, also recruited participants from its own database.
TUD conducted the data analysis for this report.
4.2 Methodology
Surveys of 143 children in Germany with an imprisoned parent were investigated, using the German versions of the KIDSCREEN-27 (Child Version, The KIDSCREEN Group, 2004), the Strength and Difficulties Questionnaire (SDQ), and the Rosenberg Self-Esteem Scale (SES, Ferring & Filipp 1996, v. Collani & Herzberg, 2003 rev.) to ascertain their coping strategies and mental health problems.
The non-imprisoned parents/carers were asked to rate their child using the Kindscreen-27 (Parent Version) and the Strenghts and Difficulties Questionnaire (SDQ, Goodman 1997, parent version), and to rate themselves using The World Health Organization Quality of Life (WHOQOL)-BREF.
12
relationship to the incarcerated parent/carer, school, family relationships, prison visits, imprisonment, effects of imprisonment on the child, special needs, help received and satisfaction with help, and children’s views of their future.
The data were subject to preliminary analysis by means of frequency analyses, and calculations of means and standard deviations (SD).
4.3 Results
Child questionnaire
Socio-demographic characteristics
4.3.1 Gender
The sample of 143 children compromised an almost equal proportion of males and females (Table 1) (see Appendix 2).
4.3.2 Age
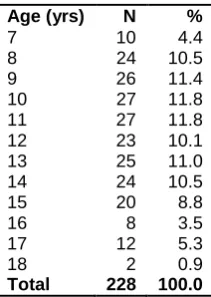
There was a fairly even spread of children in terms of their ages (Table 2a). The mean age of all children in the sample was 11.13 years (SD 3.14, range 7-20 years), the mean age did not differ between male and female children (11.10 years vs. 11.13 years) (Table 2b).
4.3.3 Ethnicity, nationality or country of birth
In Germany the children were not asked about their ethnicity, but regarding rather their nationality. The large majority of children were German (88.1%) but there were a range of other nationalities represented in the survey (Table 3).
4.3.4 Specific well-being issues
Children were asked whether they had a specific long-term disability or medical condition. The majority of approximately 80% reported, that they have no such known well-being issue (Table 4).
Aspects of parental/carer imprisonment
4.3.5 Contact with imprisoned parent/carer
The large majority of children (93.5%) have contact, such as visits or letters, with their imprisoned parent/carer (Table 5).
4.3.6 Effects of parental imprisonment
When asked, whether the imprisonment had had any bad effects for them, more than half of children (54%) reported that it had (Table 6a). For 67.2% children the imprisonment had not had any good effects for them (Table 6b). But on the other hand, 17.5% of the children indicated, that the imprisonment in fact affected their lives in a positive way.
4.3.7 Help regarding parental/carer imprisonment
13
Mental health and well-being
4.3.8 SDQ Strength and Difficulties Questionnaire
The Total Difficulties Score is calculated by summing all of the subscales except the Prosocial Scale. Potential scores range from 0-40 with a higher score indicating greater difficulties overall. Children in the current sample produced a mean Total Difficulties score of 12.46 (SD 5.80, range 1-31) (Table 8a).
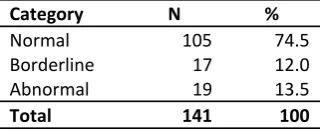
The Total Difficulties score can be compared to normative population ranges to provide an indication of the likelihood that the child or young person will display mental health problems. Individuals with a score falling in the ‘normal’ range are unlikely to display mental health problems, those in the ‘borderline’ range have a slightly raised score and are more likely to experience mental health problems, whilst scores in the ‘abnormal’ range indicate substantial likelihood of mental health problems. 74.5% of children’s scores in our sample fell in the ‘normal’ range, 12.0% in the ‘borderline’ range and 13.5% in the ‘abnormal’ range (Table 8a). A quarter of the German sample (25.5%) could be said to be at some heightened risk of experiencing mental health problems.
4.3.9 Self-Esteem Scale (SES)
The mean SES score of all children in the sample was 31.86 (SD 5.34, range 17-40, N=138). In male children it was 32.50 (SD 5.26, range 18-40, n=70) and in female children it was 31.09 (SD 5.43, range 17-40, n=66). Table 9 shows the frequencies for the SES Score distribution.
4.3.10 KIDSCREEN questionnaires (quality of life)
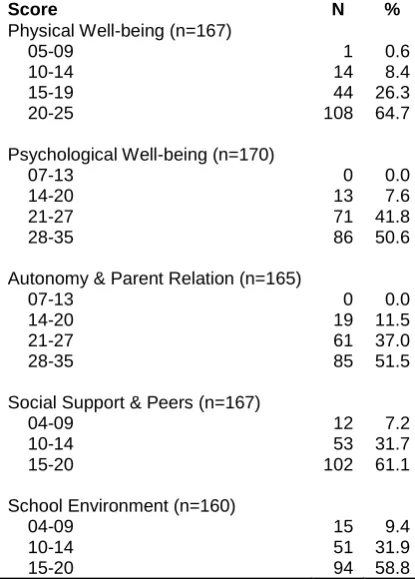
KIDSCREEN measures a variety of dimensions of quality of life. As is shown in Table 10a, the children rated themselves quite highly on most measures. The children’s five health-related quality of life scores were broken down into a number of broadly equal groups based upon based upon raw
KIDSCREEN scores (Table 10b). In general, large majorities of children were in each of the highest groups of KIDSCREEN scores. For example, considerably two-thirds of the children (66.4%) was in the top one-third of scores for the quality of life in terms of Social Support & Peers.
Non-imprisoned parent/carer questionnaire
4.3.11 Non-imprisoned parent/carer's relationship to child
Almost all of the non-imprisoned parent/carers (91.3%) were the birth parents of the children (Table 11a). The large majority of non-imprisoned parents/carers were the children’s birth mothers (Table 11b).
4.3.12 WHO overall Quality of Life score
The non-imprisoned parents/carers were asked to report on their perceptions of their own life quality using the World Health Organisation Quality of Life Scale (WHOQOL-26). The WHOQOL consists of 26 items, with higher scores indicating more positive health and well-being. Potential scores range from 1-5 and the current sample produced a mean of 3.18 for overall quality of life and a mean of 3.05 for overall quality of health (Table 12a).
The imprisoned parents/carers WHOQOL raw scores are grouped into a number of broadly equal groups (Table 12b). As is evident from Table 12b, many parents/carers were in the higher ranked groups. For example more than one quarter of all parents/carers (27.1%) were in the top band for
14
Imprisoned parent/carer
4.3.13 Imprisoned parent/carer's relationship to child
The large majority (76.8%) of the imprisoned parents/carers were the children’s birth parents (Table 13a). The majority (69.6%) of the children had their birth fathers in prison (Table 13b). The next largest group were stepfathers (13.0%).
4.3.14 Gender of imprisoned parent/carer
In Germany almost all imprisoned parents/carers (91%) from the sample of 143 children, were male (Table 14).
4.3.15 Total sentence/period on remand (current criminal charge)
The average length of imprisonment served by parents/carers was 26.2 months, with an average of 21 months remaining (Table 15).
4.3.16 Current reason for imprisonment
The parents/carers were imprisoned for a variety of charges but the most common of these was drugs offences (32%) followed by fraud (31%) (Table 16).
Child
4.3.17 Child's contact with imprisoned parent/carer
According to the non-imprisoned parents/carers, the large majority of children (92.8%) had some form of contact with their imprisoned parents/carers (Table 17).
4.3.18 Effects on child of parental/carer imprisonment
The parents/carers were asked, whether the imprisonment had had any bad or good effects for the children. Table 18a indicates, that the majority of parents/carers reported a negative effect on the childs welfare (75%). Table 18b shows, that most of the parents/carers (64%) did not identify any good effects of the parental/carer imprisonment.
4.3.19 Child's needs
Parents/carers were asked to indicate whether in the last three months their child had required help in one of 34 areas broadly relating to social contact and free time, school or work, parental imprisonment, psychological health, physical health, housing, self care, money and communication. The areas in which children have needed help are shown in Table 19.
4.3.20 Strengths and difficulties
The parent/carer Strengths and Difficulties Questionnaire (SDQ) was used to elicit parent/carers perceptions of their child’s conduct, concentration, emotions and social relationships. The instrument and scoring is identical to that of the self-report scale. Mean scores for the current sample, with standard deviations in brackets, are given in Table 20.
15
4.3.21 Quality of life - Kidscreen scores
The informant KIDSCREEN-27 instrument provides an indication of the parent/carers perception of their child’s health and well-being. The instrument and scoring is identical to that of the self-report scale. The mean score for each dimension are given in Table 21a. Non-imprisoned parents/carers generally rated the children’s well-being quite highly as the banding of the children’s raw scores on different health and well-being dimension (Table 21b).
4.4 Summary
Since the start of the project (2010) the preparation of the survey, especially the preparation of the questionnaire, has taken nearly one year. The final questionnaires were released in M10. Before TREFF could start with the survey, the questionnaires had been translated into German and retranslated into English. In Germany the final questionnaires could be printed by the end of M11. By the end of M11 TREFF started with the distribution of questionnaires.
As TREFF could start in M11 with its acquisition strategies, it quickly became clear that the survey had to be spread throughout Germany, as in Bavaria TREFF couldn't obtain 250 children questionnaires. Additional counselling centres were contacted. TREFF originally had only seven months for the dissemination of questionnaires including evaluation, although the original timetable provided 9 months for this part. TREFF supported an extension to M20.
Finally 295 parent/carer questionnaires and 416 child questionnaires were in circulation. 143 child and 98 parent questionnaires are returned to this day. A total of 99 families participated in the survey. We have a return of 34.4% for children questionnaires and 33.2% for parent questionnaires.
16
5. Romania
5.1 Methodology
5.1.2 Sample
The COPING Romanian research targeted children with imprisoned parents aged 7 to 17 years old and their carers in 6 counties: Iasi, Botosani, Vaslui, Bacau, Neamt, and Suceava. The surveys were mirrored and designed to be applied to both the carer (non imprisoned) and the child of an imprisoned parent. The back translation did not lead to any removal of items included in the surveys nor to its conceptual alteration.
The initial sample was of 170 child/carer out of which 7 child/carer refused to take part in the research and other 3 children and 3 carers were excluded from the survey analysis due to non consistent responses and/or no information provided in the SDQ. At the time of
5.1.3 Procedure
The recruitment of estimated sample was made in two stages:
Through prisons: penitentiaries in the target area disseminated information regarding COPING within the prison population and invited prisoners to take part in the research. With their written consent, imprisoned parents offered information regarding their children: age, sex of the child, address, contact person outside the prison (other parent/carer), and – if applicable – telephone number. This information was included in a database that was provided to ASA. A total number of 243 prisoners offered information on 361 children aged 7 to 17 years old.
Through State Care Services: requests were made to State Social Services in the targeted area (counties of Iasi, Botosani, Vaslui, Bacau, Neamt, and Suceava). As result of this approach, at the time of reporting, 209 children/carer questionnaires have been collected.
The fieldwork was envisaged in Romania with the participation of MA students from the University of Alexandru Ioan Cuza. For this purpose, 22 students were selected and participated in a training on October 29th 2010. The training included introductions on the following topics: COPING presentation, child development stages, COPING research approaches, and organizatorical matters.
During November 3rd – December 10th, 2010 the surveys were applied to 170 children. 6 carers changed their mind in participating in the research. The surveys were applied in 6 counties in Romania: Iasi, Botosani, Vaslui, Bacau, Neamt, and Suceava.
5.2 Results
17
Child questionnaire
Socio-demographic characteristics
5.2.1 Gender
The gender distribution of respondents - 58% male and 42% female - is slightly balanced in favour of boys in relation to national statistics (52% male and 48% female) (Table 2).
5.2.2 Age
The average age of children in the sample is 10.64 years (Table 3). The score is lower than the national average (12 years). Moreover, the sample mode is 7 years, while the nationwide mode is 17 years. One possible explanation for this is the relatively low age of the prisoners, which will have had an effect upon their children's age.
5.2.3 Ethnicity
83% of children in the sample said they are white (Table 4). They would typically refer to themselves as Romanians. 17% of children indicated that they had another ethnicity. Most of these said they were Rroma [sic].
5.2.4 Specific well being issues
8.6% of children who answered the questionnaire said they suffered from various disabilities, illness, medical condition, or special needs (Table 5).
Aspects of parental/carer imprisonment
5.2.5 Contact with imprisoned parent
A significant proportion (84%) of children in the sample said they had contact with their parent/carer in prison whether this was in the form of, for example, telephone, letters or visits (Table 6).
5.2.6 Effects of parental/carer imprisonment
Just over on-half of all the children surveyed said that their parent/carer’s incarceration had not had a negative effect on them, approximately 10% were not sure about the effects and almost 40% of children said the incarceration had a negative effect on them (Table 7a).
Despite the fact that 52.2% of children said the incarceration of a parent had no negative effects on them, only 15.6% of them believe that incarceration has had positive effects, whilst 6.7% were not sure and 77.6% reporting the absence of positive effects (Table 7b).
5.2.7 Received help with regards to parental/carer imprisonment
A significant proportion of children, approximately 60%, said they had received various types of assistance (Table 8). On the other hand, the 40% of children who have not received any help constitutes an alarming figure, indicating the neglect of this group in Romania.
Mental health and well being
18
The Total Difficulties Score is calculated by summing all of the subscales except Prosocial Scale.
Children in the analyzed sample produced a mean Total Difficulties score of 11.68 (5.72) (Table 9a). Based on child-reported SDQ scores, we have built three categories: normal (74%) with range between 0 – 15 pt., borderline (17%) with range between 16 – 19 pt. and abnormal (9%) with range between 20 – 40 pt. The scores must be treated with caution given that the Romanian normalization of SDQ has highlighted a weaker reliability in group of children under 11 years old and the sample average age is just 10.64 (Table 9b)
5.2.9 Self esteem
We have calculated the Rosenberg SES, which ranges between 0 and 30 points, and have grouped these scores into three major categories: Low Esteem (range between 0 – 9 pt.), Medium Self-Esteem (range between 10 – 19 pt.) and High Self-Self-Esteem (range between 20 – 30 pt.). Children’s SES appeared, generally, to be quite low. Only one child (0.7%) scored in the High Self Esteem group, 62% of children scored in Medium Self-Esteem category and 37% in the Low Self-Esteem (Table 10).
Non-imprisoned parent/carer questionnaire
Non-imprisoned parent/carer
5.2.10 Relationship to child
In most cases in this study the non-imprisoned parent/carers were the child’s birth parent (68.7%) or their biological grandparent (17.2%) (Table 11).
Imprisoned parent/carer
5.2.11 Relationship to child
Virtually all of the imprisoned parents/carers (94.5%) were the children’s birth parents (Table 12). A further 3.1% were the children’s stepmother or stepfather.
5.2.12 Gender of the imprisoned parent/carer
The large majority of the imprisoned parent/carers (92%) were male, with a small minority being females (8%) (Table 13). Correlating this variable with the above variables we can conclude that in most of the cases the biological father is incarcerated and the child is taken care of by the biological mother or, in fewer cases, by grandparents.
5.2.13 Time spent in prison
The average period for which parent/carers had been in prison was 4.26 years and the average period for which they would remain in prison is 5.26 years (Table 14).
5.2.14 Current reason for imprisonment
The most common types of crimes for which a parent was incarcerated refer to handling stolen goods or theft (11.6%), physical assault (not domestic violence) (10.7%) and taking and driving away (car theft) (10.7%) (Table 15).
Child
19
83% of parents/carers in the sample said the children had some form of contact with their imprisoned parent/carer in prison. The percentage is almost the same as that reported on the child questionnaire (Table 16).
5.2.16 Effects of parental/carer imprisonment
The effects of incarceration of the child's parents on the child are judged quite differently by the parent/carer compared to the child. 47.9% of the parents/carers in the sample consider that imprisonment had bad effects whilst only 37% of children in the sample consider that the imprisonment have bad effects (Table 17a).
The large majority of non-imprisoned parents/carers believed that incarceration of the child’s parent/carer had not had any good effect for the child (79.6%) (Table 17b). Almost 15% of parents/carers felt that incarceration of the parent/carer had had a good effect for the child.
5.2.17 The child’s needs
The needs that the children were reported as having, by their non-imprisoned parent/carer, are shown in Table 18. The Table shows the broad categories of need that were covered in the questionnaire, the total number of times parent/carers identified any one of the range of needs in any of these categories and the average ‘needs score’ that children had (Each time a child was identified as having a specific need, this was given a value of ‘1’. All of these scores within a given category were added up and divided by the number of children to produce an average need score for that category.) The most common needs that children had were in the areas of housing (average need score 0.6), social contacts and free time (0.51) and self-care (0.51). The overall total needs score is in the first half of the interval (0.39), but we appreciate the level as being quite high.
5.2.18 Strengths and difficulties
Table 19a shows the mean SDQ scores for the children, as judged by their non-imprisoned parents/carers. The results indicate a range of outcomes. For example, the children score relatively badly in terms of Emotional Symptoms (4.22) but much better in terms of Conduct Problems (2.33). The children did though score relatively highly on the Prosocial Scale (8.23).
20
6. Sweden
6.1 Procedure
WP1 comprised a questionnaire-based survey among the children of prisoners and their non-imprisoned parents/carers. Most of these children were recruited via the NGO Bryggan, which is an organisation, providing support to children of prisoners, based in several cities in Sweden. Bryggan’s offices in four cities - Stockholm, Karlstad, Norrköping and Malmö - have been involved in recruitment. Children and non-imprisoned parents/carers were asked to participate when visiting the Bryggan Centres. If the child was 15 years or older approaches were made directly to the child, otherwise the non-imprisoned parent/carer was asked first before approaches were made to the child. The participants most often completed the questionnaire during the visit at Bryggan but some also chose to take them home and return them, completed, on their next visit or by post. Participants were also recruited via prisons and most commonly via imprisoned parents/carers who provided contact information to their families (after consent from the families) in order for us to be able to contact them and ask them to participate. Children and parents/carers recruited through the imprisoned parent/carer most commonly completed the questionnaires at home before sending them back to KI or Bryggan. Posters and information letters were sent to prisons, before recruiting, in order to inform parents/carers in prisons about the study. Due to lack of time and room during visiting hours, and since Swedish prisons do not have visiting centres, it has been difficult to come in contact with children and non-imprisoned parents directly at prisons. Only one questionnaire was completed in prison.
6.2. Results
At the time the interim report was produced a total of 69 questionnaires had been inputted into SPSS: 38 child questionnaires and 31 parent questionnaires. In 31 cases both the parent and child had completed a questionnaire and in 7 cases just the child.
Child questionnaire
Socio-demographic characteristics
6.2.1 Gender
The sample of 38 children comprised a slightly higher proportion of females (Table 1) (see Appendix 4).
6.2.2 Age
There was a fairly even spread of children in terms of their ages (Table 2a). The mean age of all children in the sample was 11.50 years (SD 3.33 years). The mean age did not differ so much between males and females (11.76 years for males and 11.29 years for females years) (Table 2b).
6.2.3 Ethnicity and county of birth
Questions on ethnicity were not asked in the Swedish questionnaire. Regarding country of birth, the majority of children (92.1%) were born in Sweden.
21
Children were asked whether they had ‘a long-term disability, illness, medical condition or special need’. These conditions are, for the purposes of this report, collected together under the generic term ‘specific well-being issues’. Only 8% reported that they had at least one such specific well-being issue (Table 3). (The four major types of condition we asked about, will be reported upon separately in future reports.)
Aspects of parental/carer imprisonment
6.2.5 Contact with imprisoned parent/carer
Almost all of the children had contact with their imprisoned parents/carers. Of the 38 children, 37 of them (97%) of them had some sort of contact, whether this was in the form of, for example, visits, telephone calls or letters (Table 4).
6.2.6 Effects of parental/carer imprisonment
When asked whether their parent/carer being in prison had had any bad effect for them, 21 (55%) children reported that it had, 11 (29%) that it had not and 6 (16%) indicated that they were ‘not sure’ (Table 5a).
58% of children reported that the imprisonment of their parent/carer had not produced any good
effects for them, compared to 24% of children who believed it had (Table 5b). The remainder of children were unsure whether parental imprisonment had had any positive consequences.
6.2.7 Receipt of help regarding parental/carer imprisonment
92% of children in the sample indicated that they had received some form of help in relation to their parent/carer being in prison (Table 6). Future analysis will explore who provided this help (for example, family members, statutory agencies and third sector organisations) and in relation to what areas of the child’s life (for instance, leisure activities, emotions and behaviour).
Mental health and well-being
6.2.8 Strengths and difficulties
The self-report Goodman (1997) Strengths and Difficulties Questionnaire (SDQ) is a behavioural screening instrument which elicits children and young peoples’ perceptions of their conduct, concentration, emotions and social relationships. The SDQ comprises 25 items in total with five items loading onto each of the five subscales: Emotional Symptoms; Conduct Problems; Hyperactivity; Peer Problems; and the Prosocial Scale. Scores on all five subscales range from 0-10. A higher score on the first four subscales indicates greater difficulties in that area. The Prosocial Scale measures the extent to which children are providing socially desirable answers with higher scores indicating greater social desirability.
The self-report SDQ is designed for use with children ‘aged around 11-16’ years, of whom there were 16 in our sample. Mean subscale scores, for the current sample, followed by SDs in brackets, were:
Emotional Symptoms 3.63 (1.95); Conduct Problems 2.42 (2.48); Hyperactivity 4.89 (3.26); Peer Problems 1.89 (1.29); and the Prosocial Scale 8.63 (1.21) (Table 7a). Eventually, subscales scores will be compared with normative data to explore the level of difficulties experienced by children with a parent/carer in prison compared to those experienced by the general population.
22
The Total Difficulties score can be compared to normative population1 ranges to provide an indication of the likelihood that the child or young person will display mental health problems. Individuals with a score falling in the ‘normal’ range are unlikely to display mental health problems, those in the ‘borderline’ range have a slightly raised risk of experiencing mental health problems, whilst scores in the ‘abnormal’ range indicate substantial likelihood of mental health problems. 57.9 % of children’s scores in our sample fell in the ‘normal’ range, 26.3 % in the ‘borderline’ range and 15.8% in the ‘abnormal’ range (Table 7b). More than one-third (42.1%) of the sample could be said to be at some heightened risk of experiencing mental health problems.
6.2.9 Self-esteem
The self-report Rosenberg (1989) Self-Esteem Scale (SES) provides an indication of children and young peoples’ perceived levels of self-esteem. The scale consists of ten items which are summed to produce an overall scale score ranging from 10-40 with higher scores indicating higher levels of self-esteem. Children in this sample had a mean score of 31.39 (SD 4.79) (Table 8). falling in the upper third of potential scores, suggesting relatively high self-esteem, although this will eventually be compared with normative population data.
The children’s SES scores were broken down into three broadly equal groups based upon based upon the raw SES score. Almost two-thirds of the children were in the highest group (scores 30-40), with no child the lowest group (scores 10-19). 30% of the children, though, did record intermediate SES scores.
6.2.10 Quality of life
The KIDSCREEN self-report instrument elicits children and young peoples’ rating of their health and
well-being. The KIDSCREEN-27 instrument comprises of 27 items which load onto five dimensions. The number of items on each dimension varies and a higher score indicates more positive health and well-being. The mean score for each dimension is presented in Table 9a. Raw scores will be compared with normative data to explore children of prisoners’ subjective health and wellbeing in relation to that of the general population.
The children’s five health-related quality of life scores were broken down into a number of broadly equal groups based upon based upon raw KIDSCREEN scores (Table 9b). In general, large majorities of children were in each of the highest groups of KIDSCREEN scores. For example, 89.5 % of the children were in the top one-third of scores for the quality of life in terms of Social Support & Peers. There was one area where children appeared to score rather less well, with 39.5% of children being in the two lower of three groups for quality of life in respect of School Environment.
Non-imprisoned parent/carer questionnaire
The following results are based on 31 parent/carer questionnaires (7 of the 31 children participating did not have a parent/carer filling in a questionnaire, hence the lower number of parent/carer questionnaires).
Non-imprisoned parent/carers
6.2.11 Relationship to child
Almost all the non-imprisoned parents/carers taking part in the survey were the children’s birth parents (Table 10a). Only two of the parent/carers had any other type of relationship to the child (one grandparent and one ‘other’).
1 Categorisation is here based on UK norms. For future analysis Swedish normative data will be used to
23
The majority of non-imprisoned parents/carers comprised the children’s birth mothers, accounting for more than 95% of respondents (Table 10b). The next largest group of respondents consisted of birth fathers but these made up only 8.3% of all non-imprisoned parents/carers.
6.2.12 Quality of life
The brief World Health Organisation Quality of Life Scale (brief version, WHOQOL-26) was administered to non-imprisoned parents/carers to obtain self-reported perceptions of their own quality of life. The WHOQOL consists of 26 items, with higher scores indicating more positive health and well-being. The first two items regarding Overall Perception of Quality of Life and Overall Perception of Quality of Health are examined separately. Potential scores range from 1-5 and the current sample produced a mean of 3.67 for overall quality of life and 3.35 for overall quality of health (SD 0.91 and 1.11 respectively) (Table 11a). The remaining 24 items load onto four domains which are multiplied by four to make them comparable to the full WHOQOL-100. Mean domain scores, with SD in brackets, were as follows: Physical Health 14.27 (3.60); Psychological Well-being 13.72 (2.23); Social Relationships 14.53 (3.50); and Environment 13.45 (3.23). All items can be summed to produce a Total Scale Score, which for the current sample had a mean of 89.19 and SD of 16.63. Eventually, sample scores will be related to normative data to enable comparisons to be made between non-imprisoned parents/carers and the general population in terms of their respective subjective quality of life measures.
The quality of life of the non-imprisoned parents/carers, as measured on all of the dimensions listed in Table 11b, was generally good to very good. For example, about one-half (51.6%) of this group scored 4 or 5 (out of a maximum of 5) on Overall perception of quality of life. Non-imprisoned parent/carers appeared to score fairly poorly in terms of Physical Health with one-fourth (25.8%) being in the second lowest of the four bandings on this measure. Regarding Psychological well-being,
a majority (61.3%) of respondents were in the middle of the three bandings on this measure.
Imprisoned parent/carers
6.2.13 Relationship to child
The large majority (83.9%) of the imprisoned parents/carers relationship were the children’s birth parents (Table 12a). The remaining parents/carers were stepparents.
A majority (74 %) of the imprisoned parent/carers were the children’s birth fathers (Table 12b). The other two groups were birth mothers (9.7%) and stepfathers (16.1%) parents/carers.
6.2.14 Gender
The large majority of imprisoned parents/carers (90.3%) from the sample of 31 children, were male (Table 13). Although, only a relatively small minority were females (9.7%), this was considerably higher than the proportion of females in the Swedish prison population overall (5.4% 2 ) (Kriminalvården, 2011).
6.2.15 Time spent in prison
Non-imprisoned parents/carers were asked to report on the amount of time the imprisoned parent/carer had spent in prison, to date, combining any period on remand with any period since being sentenced. Imprisoned parents/carers had spent an average of 24.03 months (standard deviation 28.9 months) in custody so far on their current sentence or period of remand.
2
24
Child
6.2.16 Contact with imprisoned parent/carer
All of the parents/carers indicated that their child had some form of contact with the imprisoned parent/carer (Table 14), which might include visits, telephone calls and letters. This correspond closely to the figure 97% for the children who reported that they had contact with their parent in prison (only one child reported no contact)
6.2.17 Effects of parental/carer imprisonment
When parents/carers were asked whether the imprisonment of a parent/carer had had any bad effects for their child, a majority (82.8%) indicated that it had (Table 15a). Compared to the children’s responses, there was a considerable difference between children’s and parent/carer’s reports of negative consequences (55% of the children reported bad effects).
35.7% of parents/carers reported that the imprisonment of a parent/carer had produced good effects for their child, compared to 53.6% that thought it had not (Table 15b). The remaining parents/carers (10.7%) were unsure whether parental imprisonment had had any positive consequences. When compared to children’s own responses, there was some difference between children’s and parent/carer’s reports of positive consequences (24 % of the children reported good effects).
6.2.18 Needs
Parents/carers were asked to indicate whether in the last three months their child had required help in one of 34 areas broadly relating to social contact and free time, school or work, parental imprisonment, psychological health, physical health, housing, self care, money and communication. Table 16 shows the answers in each area.
6.2.19 Strengths and difficulties
The parent/carer Strengths and Difficulties Questionnaire (SDQ) was used to elicit parent/carers perceptions of their child’s conduct, concentration, emotions and social relationships. The instrument and scoring is identical to that of the self-report scale. Given that the self-report SDQ is not suitable for children aged under 11 years, the informant SDQ can be used as a substitute. The informant SDQ can also be used to complement the self-report SDQ for children aged 11+. Mean scores for the current sample, with standard deviations in brackets, are as follows: Emotional Symptoms 2.77 (1.86);
Conduct Problems 2.23 (1.94); Hyperactivity 4.48 (2.80); Peer Problems 2.16 (1.71); and the
Prosocial Scale 7.87 (1.89) (Table 17a). Eventually, subscales scores will be related to normative data to allow comparisons between non-imprisoned parent/carers and parents/carers in the general population in terms of their respective ratings of their children’s strengths and difficulties.
As with the self-report instrument, the Total Difficulties Score can be compared to normative population ranges to provide an indication of the likelihood that the child or young person will display mental health problems. 58.1% of parents scored their child in the normal ‘range’ indicating mental health problems are unlikely, 19.4 % in the ‘borderline’ range suggesting moderate likelihood of problems, and 22.6% in the ‘abnormal’ range indicating substantial likelihood of problems (Table 17b).3 Comparison with the self-report version, suggests that the parents perceive more difficulties for their children than the children themselves. However, the results from the self-report version, Table 7b, are based upon only children 11 years and older, so this comparison should be treated with caution.)
3 Categorisation is here based on UK norms. For future analysis Swedish normative data will be used to
25
6.2.20 Quality of life
The informant KIDSCREEN-27 instrument provides an indication of the parent/carers perception of their child’s health and well-being. The instrument and scoring is identical to that of the self-report scale. The mean score for each dimension, with SD in brackets, was as follows: Psychological Well-being 18.14 (SD 3.19); Psychological Well-being 25.81 (SD 43.91); Autonomy & Parent Relation
25.16 (SD 3.49); Social Support & Peers 15.30 (SD 3.08); and School Environment 14.71 (SD 2.73) (Table 18a). Raw scores will be compared with normative data to explore the perceptions of parent/carers’ of children who have a parent/carer in prison in relation to the general population.
26
7. Conclusion
There is, in general, a fair degree of comparability between the sample of children (and their parents/carers) in the four countries. For example, each country has a balance of girls and boys taking part in the survey; their mean ages are within one year of each other; and most have an ethnicity, citizenship/nationality or country of birth that is the same as the majority of people in the country in which they live. (Each country has, though, been able to recruit a proportion of children who are exception to this rule and this may enable some important analyses to be undertaken in relation to this variable.
The samples from the four countries are also broadly similar to one another in terms of a number of major variables relating to the non-imprisoned parents/carers. For example, the large majority of parents/carers in each country are the children’s birth parents and most of these are birth mothers. The WHO QOL scores of these parents/carers tend to be within a narrow range.
The large majority of imprisoned parents/carers are male. They also tend to have served very similar lengths of sentence. The sole – and a possibly important exception - to this is in Romania where the average sentence served so far was considerably higher than in nay of the three other countries.
As explained in the Introduction, the survey was designed to provide a more detailed and extensive picture of these children’s lives than was originally anticipated. This has highlighted some important but also contrasting findings between countries. A prime example of this is the number of children who reported that they had ‘a long-term disability, illness, medical condition or special need’, what we have referred to in this report by the generic term ‘specific well-being issue.’
A sizeable minority of children in each country were found to be in the abnormal range of the SDQ based upon their parent/carer rating. This indicates that a chid has a ‘substantial likelihood of mental health problems’. There were, though, major differences between countries.
There were also some considerable and important differences in relations to the imprisoned parents/carers, for example, the charges they faced.
In conclusion, then, it can be seem that there is broad comparability between the samples in the four countries but that, at the same time, the research has highlighted important differences between these countries. The reasons for these differences and their implications in terms of other findings will be assessed in the more detailed publications that are planned for this project.
27
References
Goodman R (1997) The Strengths and Difficulties Questionnaire: A Research Note. Journal of Child Psychology and Psychiatry, 38, 581-586.
Ministry of Justice (2011) National Offender Management Service. HM Prisons Population Bulletin Weekly 20th May. London: Ministry of Justice
Rosenberg, M. (1989) Society and the Adolescent Self-Image. Revised edition. Middletown, CT: Wesleyan University Press.
The KIDSCREEN Group Europe. (2006). The KIDSCREEN Questionnaires - Quality of ife Questionnaires for Children and Adolescents. Handbook. Lengerich: Pabst Science Publishers.
WHO (2004) The World Health Organization Quality of Life (WHOQOL) – BREF. Geneva: WHO
Office of National Statistics (2011) Population Size http://www.statistics.gov.uk/cci/nugget.asp?id=455
28