Involvement of the fission yeast
GATA transcription factor Gaf1 in
TOR-dependent stress and nutrient
responses
Olivia Hillson
A thesis submitted in partial fulfilment of the requirements of the University of East London for the degree of Masters o f Research
School of Health Sport and Bioscience
I
Abstract
The Target of Rapamycin (TOR) pathway is responsible for the growth and metabolic control of a cell, in response to nutrients and stress. This pathway, functioning through distinct protein complexes known as TORCs (TORC1 and TORC2 in yeasts and humans), is highly evolutionarily conserved. This allows for fission yeast, S. pombe, to serve as a model for humans in this study. Understanding genetic control of the TOR pathway is considered to have the potential to present pharmacological and dietary interventions for ageing and age-related diseases such as Alzheimer’s and diabetes. In this study, the highly conserved GATA transcription factor Gaf1, orthologue of GATA6 in humans, is investigated for its role in TOR by studying phenotypical and transcriptional differences between wild type and gaf1∆ cells with and without TOR inhibition. The work makes use of microfermentation experiments to determine changes in growth kinetics as well as microarray data to understand gene expression changes that might underpin these phenotypes. The results highlight the need for further investigation in this area by suggesting a complex interplay between TORC1 and TORC2 and implicating Gaf1 in both spatial and temporal aspects of cell growth. The results support recent findings of Gaf1 involvement in ncRNA expression and tRNA binding, but suggest a more complicated
II
Acknowledgements
Firstly, an overwhelming amount of thanks goes to my Director of Studies, Babis. He has been a never-ending source of encouragement, expert advice and support, without which I would never be where I am today. He has shown me that I am capable of much more than I thought, and I hope this thesis is testament to that. My time in the UEL labs during this research has not always been smooth sailing and I would like to thank my fellow PGRs for always being there to offer advice and support especially Suam Gonzalez. Extra-special thanks goes to my ‘lab mum’ Martina Neville for always being on my side and never letting me open the Virkon bucket without a mask on (my future lungs will thank you, too). I would also like to thank Prof. J Bähler and his lab at University College London, particularly Mimi Hoti, for their friendly welcome during my use of their facilities for this research.
I would like to thank all of my family and friends for their ongoing support and constant care. There will never be enough thanks for my Mum and Dad for always believing in me, funding this degree, and learning to care about yeast. I couldn’t be here without them in all manner of ways. Special mention to my household for putting up with me when the work was making me more
sociopathic than usual, particularly Emily for being a constant source of rational support and always making me tea even though I never make it for anyone else. I would like to send very special thanks to Yolanta Beinarovica for being the best kind of friend, reading everything I write and believing I was a good scientist when I couldn’t manage it myself.
III
Table of Figures
IV Both strains show increased lag phase and slower exponential phase growth rate when treated with Torin1. The treated wt strain has an increased lag phase and slower exponential growth rate than the treated gaf1∆ strain suggesting gaf1∆ resistance to Torin1. ... 24 Figure 9: A) Biomass graph from BioLection showing wild type control (red), gaf1∆ control (blue), wild type + Torin1 15mM (green), gaf1∆ + Torin1 15mM (yellow), wild type + Torin15mM and arginine (purple) and gaf1∆ + Torin 15mM and arginine (orange) (B) Bar graph to show changes in lag phase length for gaf1∆, wild type, tco89∆ and tor1∆ cells when treated with Torin 10mM, Torin 15mM and Torin 15mM + arginine. All strains except gaf1∆ showed a rescue of the increased lag phase with arginine. ... 25 Figure 10: Biomass graph from BioLection showing arginine rescue of
“Signature Torin1 Biomass Decrease” in both wild type and gaf1∆ strains: wild type and Torin1 10mM (red), gaf1∆ Torin1 10mM (blue), wild type Torin1 10mM and arginine (green) and gaf1∆ Torin1 10mM and arginine (yellow). ... 26 Figure 11: A)Biomass graph from BioLection showing increasing lag phase and (B) pH graph from BioLection showing increasing pH in wild type cells control (red), Torin1 2uM (blue), Torin1 2uM + arginine 4mM (yellow), Torin1 2uM + arginine 12mM (green), Torin1 2uM +arginine 16mM (purple), Torin1 2uM + arginine 20mM (orange). As the concentration of arginine increases, the pH increases and the lag phase increases. ... 27 Figure 12: Biomass graph from BioLection (A) wild type, (B) gaf1∆, (C) tor1∆ and (D) tco89∆ control (red) caffeine 10mM and rapamycin 100ng/ml (blue). gaf1∆ cells are seen to be more resistant to caffeine and rapamycin inhibition than the wild type, tor1∆ and tco89∆ strains but all strains show decreased growth with caffeine and rapamycin treatment. ... 28 Figure 13: Box and whisker plots of wild type cell size measurements at
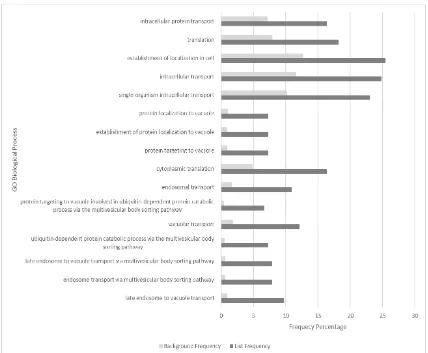
V happen due to technical reasons during hybridisations (white and green panels with red dots on the left). ... 34 Figure 15: Venn diagrams to show overlap in (A) downregulation of genes in gaf1∆ and wild Type cells treated with caffeine and rapamycin or Torin1 (B) upregulation of genes in gaf1∆ and wild type cells treated with caffeine and rapamycin or Torin1 (C) up and downregulation of genes in gaf1∆ cells treated with caffeine and rapamycin or Torin1. Created using Gene Venn (Nagarajan, 2006). ... 35 Figure 16: Bar graph to show GO enrichment percentage list frequency of
>twofold change from background frequency on gene lists of (A) genes
exclusively downregulated in wt treated with Torin1 and (B) genes exclusively downregulated in gaf1∆ treated with Torin1. Significantly more processes seem to be downregulated in the wt strain than the gaf1∆ strain which supports the hypothesis of gaf1∆strain’s reduced response to Torin1 treatment. ... 37 Figure 17: Bar graph to show GO enrichment percentage list frequency of
>twofold change from background frequency on gene lists of (A) genes downregulated exclusively in wt treated with caf/rap and overlap
downregulation in wt treated with caf/rap and wt treated with Torin1 and (B) genes downregulated exclusively in gaf1∆ treated with caf/rap and overlap downregulation in gaf1∆ treated with caf/rap and gaf1∆ treated with Torin1. There is a more similar number and range of processes seen between the wt and gaf1∆ strain downregulation in response to treatment with caffeine and rapamycin than seen in response to Torin1 treatment. ... 39 Figure 18 (previous page): Bar graph to show GO enrichment on gene lists of (A) genes exclusively upregulated in wt treated with Torin1 (all GO biological processes shown) and (B) genes exclusively upregulated in gaf1∆ treated with Torin1 (GO biological processes with percentage list frequency of >twofold change from background frequency shown). Many more processes are seen to be upregulated by the gaf1∆ strain than the wt strain during the Torin1
treatment. This supports the hypothesis of reduced downregulation in response to Torin1 treatment in the gaf1∆ strain. ... 41 Figure 19: Bar graph to show GO enrichment percentage list frequency of
VII
Abbreviations
Gaf1 – Protein transcription factor Gaf1
gaf1 – Gene encoding transcription factor Gaf1
gaf1∆ - S.pombe strain with gaf1 deletion
wt – Wild type strain 972h-
TOR – Target of Rapamycin cellular pathway
TOR1 – Protein kinase integral to TORC2 in fission yeast TOR2 – Protein kinase integral to TORC1 in fission yeast
TORC1 – One of the two distinct protein complexes in TOR in fission yeast TORC2 – One of the two distinct protein complexes in TOR in fission yeast YES – Nutrient rich media for fission yeast
EMM2 – Minimal nutrient media for fission yeast
Caf/rap – Combinational treatment with caffeine and rapamycin to inhibit TOR KAN – resistance gene to the antibiotic G418 (geneticin)
NAT – resistance gene to the antibiotic nourseothricin clonNAT – the antibiotic nourseothricin
DEPC water – diethyl pyrocarbonate water used to inactivate RNAse enzymes GO – Gene ontology
VIII
Contents
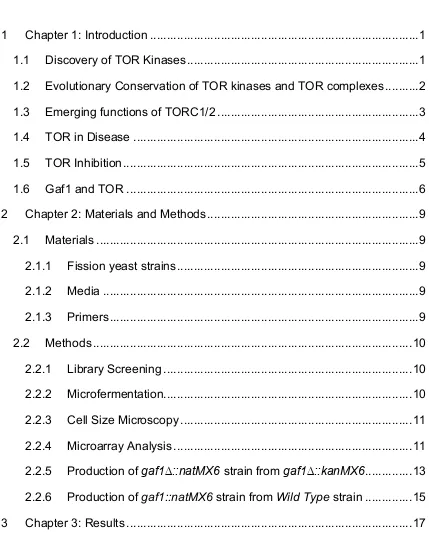
[image:9.595.112.541.229.764.2]Abstract ... I Acknowledgements ... II Table of Figures ... III Abbreviations ... VII Contents ... VIII
1 Chapter 1: Introduction ... 1
1.1 Discovery of TOR Kinases ... 1
1.2 Evolutionary Conservation of TOR kinases and TOR complexes ... 2
1.3 Emerging functions of TORC1/2 ... 3
1.4 TOR in Disease ... 4
1.5 TOR Inhibition ... 5
1.6 Gaf1 and TOR ... 6
2 Chapter 2: Materials and Methods ... 9
2.1 Materials ... 9
2.1.1 Fission yeast strains ... 9
2.1.2 Media ... 9
2.1.3 Primers ... 9
2.2 Methods ... 10
2.2.1 Library Screening ... 10
2.2.2 Microfermentation ... 10
2.2.3 Cell Size Microscopy ... 11
2.2.4 Microarray Analysis ... 11
2.2.5 Production of gaf1∆::natMX6 strain from gaf1∆::kanMX6 ... 13
2.2.6 Production of gaf1::natMX6 strain from Wild Type strain ... 15
IX
3.1 A Genome-wide screen for mutants resistant to Torin1 ... 17
3.2 Growth kinetics analysis of gaf1∆ mutant using microfermentation ... 23
3.3 Examining Spatial Aspects of TOR inhibition using Cell Size Microscopy ... 30
3.4 Gene expression analysis of wt and gaf1∆ cells using microarrays ... 33
3.5 Production of Strain for Synthetic Genetic Arrays ... 44
4 Chapter 4: Discussion ... 46
1
1 Chapter 1: Introduction
The Target of Rapamycin (TOR) pathway serves as a regulator of cellular metabolism and growth with regards to cell proliferation and survival (Laplante and Sabatini, 2009). To this effect, TOR inhibition leads to growth inhibition and lifespan extension in diverse experimental systems (Rallis et al., 2013). As the TOR pathway is highly conserved from yeast to man, research using genetically tractable organisms such as Schizosaccharomyces pombe (fission yeast) are useful and relevant models for mammalian and human TOR signalling
pathways, and have the capacity to offer insights on physiological mechanisms and disease. In humans, there is a single TOR kinase while in fission yeast there are two, TOR1 and TOR2. The two TOR kinases exist within two
structurally and functionally distinct protein complexes known as TOR complex 1 (TORC1) and TOR complex 2 (TORC2) (Loewith and Hall, 2011). TORC1 positively regulates growth and supresses cellular responses to nitrogen stress in the presence of a preferred nitrogen source while TORC2 is less well defined and is implicated in cell survival and proliferation, DNA metabolism and damage (Rallis et al., 2013). The following paragraphs introduce the TOR pathway in metabolism, growth and disease and the relationships of the GATA transcription factor Gaf1 with the pathway.
1.1 Discovery of TOR Kinases
TOR was initially discovered, as its name suggests, as the target pathway for the drug rapamycin. Rapamycin was first isolated from the bacterium
Streptomyces hygroscorpicus by Suren Sehgal in 1972 and identified as an antifungal (Vezina et al., 1975). Upon further analysis rapamycin showed potential as an immunosuppressive drug and gained FDA approval for this purpose (Blenis, 2017). Initial discovery of the TOR pathway came much later in the early 1990s by several methods. Initially a genetic screen for
2 homologues more commonly referred to as the targets of Rapamycin, were not fully characterised until 1993 and 1994 when TOR2 was identified as a target of rapamycin (Kunz et al., 1993) and TOR1/2 were found to be structurally and functionally similar but non-identical (Helliwell et al., 1994).
1.2 Evolutionary Conservation of TOR kinases and TOR
complexes
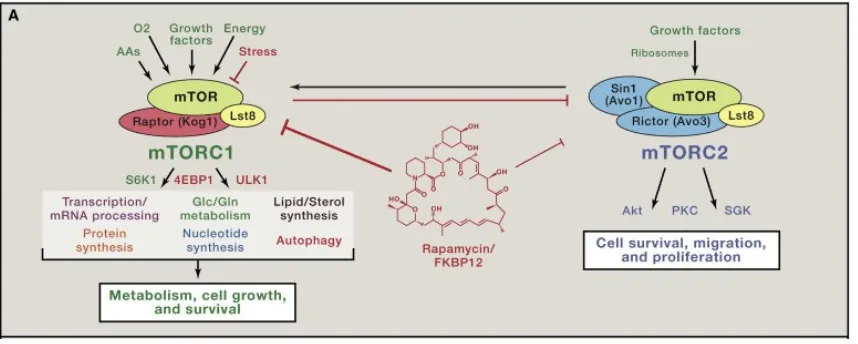
[image:12.595.114.543.480.652.2]The importance of these characterisations can only be fully appreciated when viewed within the context of the conservation of TOR from yeast to man. Rather than the two homologues found in yeast (Shertz et al., 2010), in humans TOR exists as only one kinase known as mechanistic TOR or mTOR (Laplante and Sabatini, 2009). The isolation of mTOR came in 1994 and marked the first evidence that yeast could be used as a viable model organism for TOR in humans. mTOR was initially identified as the FKBP-rapamycin-associated-protein (FRAP) (Brown et al., 1994) but was referred to as mTOR after it was found to be an orthologue to the yeast TOR homologues (Abraham, 1998). The existence of mTOR prompted research which established that mTOR functions as in yeast within two highly conserved protein complexes termed mTORC1 and mTORC2 as shown in figure 1 (Blenis, 2017) .
3 In all known TOR incarnations, the targets of rapamycin, TOR kinases combine with other proteins to create TORC1 and TORC2 as exemplified by figures 1 and 2. The distinction between TOR1/2 and TORC1/2 is an important one when understanding the finer details of the pathway.
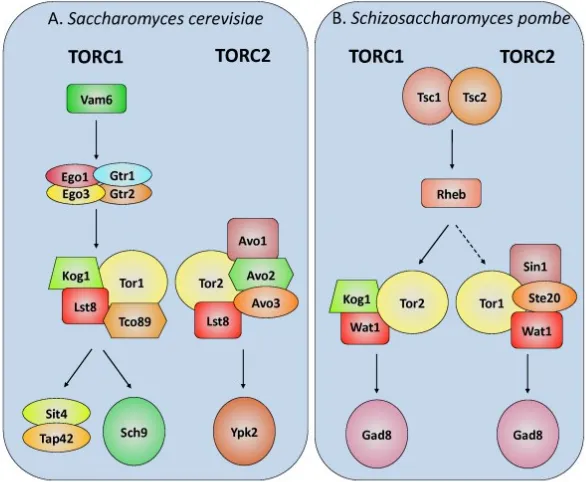
Figure 2: TORC1/2 in S.cerevisiae and S.pombe where functional homologues between the species are shown by matching shape and colour. In S.cerevisiae the TOR kinases are involved in the opposite TOR complexes than in S.pombe. (Shertz et al., 2010)
The two complexes were believed to be distinct due to research suggesting distinct functions and different subcellular localisations (Loewith and Hall, 2011) however more recent studies have suggested a much more complex interplay between them (Gonzalez and Rallis, 2017) with functions traditionally linked to TORC1 being mediated by TORC2 and vice versa.
1.3 Emerging functions of TORC1/2
4 exceptions to these assumed roles continued to emerge, until they became too numerous to ignore. Recently there has been an acceptance that this
separation of complex function is too constricting for the reality of TOR’s nature (Gonzalez and Rallis, 2017). Some such exceptions to assumed roles are: the involvement of TORC1 in the actin cytoskeleton (Aronova et al., 2007) and the involvement of TORC2 in the timing of cell division in fission yeast (Gonzalez and Rallis, 2017).
To investigate these emerging roles of each complex individually, mutant strains can be produced where either TORC1 or TORC2 is no longer functional. For TORC2 the kinase itself, TOR1, can be removed by disruption or deletion of the tor1 gene. In respect to TORC1, TOR2 is an essential gene and disruption or deletion of this gene does not yield viable cells (Weisman and Choder, 2001). This means that TORC1 needs to be functionally disrupted by deletion of another TORC1 component gene such as tco89 (Nishida and Silver, 2012).
1.4 TOR in Disease
TOR inhibition has been implicated in human disease since before it was even defined, with the use of Rapamycin and FK506 as immunosuppressant drugs (Blenis, 2017). More recently TOR has been of interest in cancer research, mTOR has been shown to be involved in multiple cancers and dysregulation of TOR has been implicated in familial cancer syndromes (Beauchamp and Platanias, 2013). TORC1/2 inhibition has been shown to decrease the survival of some triple negative breast cancer (TNBC) cells in vitro and in vivo, but some subsets of cancer cell, such as cancer stem cells, (CSCs) are resistant to this leading to interest into this resistance mechanism as a drug target (Bhola et al., 2016).
5 accumulated misfolded proteins, a common pathology among these diseases. Rapamycin has been utilised in some trials to use this as a treatment target (Dazert and Hall, 2011). This research is particularly encouraging as it presents an overarching approach for a few diseases that doesn’t require further
knowledge of the poorly understood mechanisms which cause them. However, it does reinforce how widespread the negative implications of TOR
dysregulation could be. The conservation of TOR from yeast to man, and its direct implications on a plethora of diseases, opens the door to research into TOR as a drug target using diverse approaches and models.
1.5 TOR Inhibition
mTOR’s existence in two protein complexes results in interesting effects during inhibition by rapamycin. The two complexes, mTORC1 and mTORC2, are differently affected by rapamycin treatment with mTORC1 inhibition occurring immediately and mTORC2 inhibition occurring only after prolonged treatment with the drug (Schreiber et al., 2015). The two mTOR complexes are not only structurally different from one another, they also have distinct differences in their downstream functions. mTORC1 is associated with the control of anabolic and catabolic processes in response to nutrient availability (Johnson et al., 2013) and is much better understood than mTORC2, but it is believed that both could potentially affect healthy lifespan and ageing. This makes rapamycin an interesting potential drug as it could be used to affect mTORC1 alone or both mTORC1 and mTORC2.
As TOR’s name suggests, rapamycin and its analogues or ‘rapalogs’ were the first inhibitors of the pathway/kinase to be used. They have long been
6 developed to have more favourable pharmacological kinetics and specificity, and provide an opportunity for intellectual property which can be advantageous to the drug development industry (Xie et al., 2016).
Increasing research into the success of mTOR inhibition led to not only the synthesis of rapalogs but also the synthesis of other, potentially more effective, mTOR inhibitors. Developed by AstraZeneca, the ATP-competitive mTOR inhibitors Torin1 (Thoreen et al., 2009) and subsequent Torin2 (Liu et al., 2013), are two such examples. These drugs, can inhibit both mTORC1 and mTORC2 through the direct inhibition of the mTOR kinase (Xie et al., 2016). Torin1 has been used in a few settings to demonstrate anti-ageing properties. In 2015, Torin1 was shown to be more potent than rapamycin when inhibiting senescent morphology in human cells suggesting that these processes may rely on
rapamycin insensitive components of TOR and presenting the drug potential of this class of mTOR inhibitors (Leontieva and Blagosklonny, 2016, Leontieva et al., 2015) . Very recently, dietary introduction of Torin1 has been shown to increase lifespan in Drosophila melanogaster without reducing fertility (Mason et al., 2018) showing potential for this drug to increase lifespan without reducing life quality.
1.6 Gaf1 and TOR
Much of the research into TOR itself is now focussed on using diverse genetic approaches. This presents further understanding of TOR and identifies targets for its control. Gaf1 is a GATA transcription factor, of 91.78 kDa in size, involved in the TOR pathway in fission yeast. It has been shown to be evolutionarily conserved with a known orthologue in humans, GATA6 (PomBase). GATA6 is a zinc finger domain containing, highly conserved GATA transcription factor
(Suzuki et al., 1996) with known homologues in both mice and rats (HUGO Gene Nomenclature Committee).
7
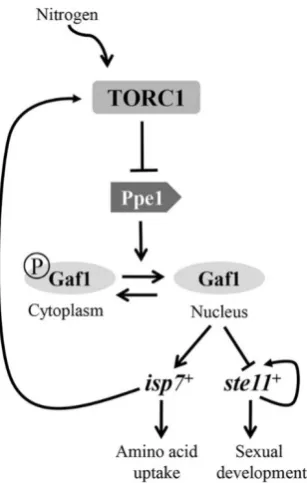
Figure 3: TORC1 negative regulation of Gaf1 localisation. TORC1 inhibits the dephosphorylation of Gaf1 causing it to remain in the cytoplasm. When the cell encounters nitrogen stress Gaf1 is dephosphorylated and enters the nucleus where it positively stimulates isp7 which in turn stimulates TORC1. (Laor et al., 2015)
The gene isp7 encodes for the oxygenase Isp7 which controls amino acid uptake by regulating the transcription of amino acid permeases. In response to nitrogen stress Gaf1 is no longer inhibited by TORC1 and isp7 is upregulated, allowing amino acid uptake to remain the same (Laor et al., 2014). The ste11 gene codes for the transcription factor Ste11 responsible for positively
regulating genes required for the initiation of meiosis. ste11Δ mutants have been shown to be completely defective in mating and sporulation whereas the overexpression of ste11 leads to sexual reproduction, even in stress conditions (Kim et al., 2012). This suggests that Gaf1 is responsible for the decrease in sexual reproduction during nitrogen stress.
TOR-8 dependent transcriptional regulation has been limited. Early data from
microarray analyses and ChiP-seq indicate that Gaf1 mediates transcriptional effects downstream of TOR related to metabolism, cellular growth and ageing (Rallis unpublished data-personal communication).
The aim of the present research is to understand the functions of Gaf1 in TOR-related signalling and cellular events. with regards to specific involvement in TORC1/2 by cellular growth and transcriptome analysis upon TOR inhibition. The work makes use of the differences in inhibition between caffeine and rapamycin and Torin1, and spatial and temporal growth measures to enrich knowledge of TORC1/2 involvement. Developing a deeper understanding of these cellular processes could have far-reaching, knock on effects to
9
2 Chapter 2: Materials and Methods
2.1 Materials
[image:19.595.108.545.168.279.2]2.1.1 Fission yeast strains
Table 1: Table of fission yeast strains and strain names used in thesis text
Name used in text Strain name
Wild type (wt) 972h-
gaf1∆ gaf1Δ::kanMX6 h- tco89∆ tco89::kanMX6 h+
tor1∆ tor1::kanMX6 h+
2.1.2 Media
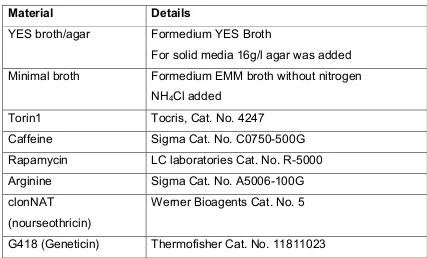
Table 2: Details of media, stressors and antibiotics
Material Details
YES broth/agar Formedium YES Broth
For solid media 16g/l agar was added Minimal broth Formedium EMM broth without nitrogen
NH4Cl added
Torin1 Tocris, Cat. No. 4247
Caffeine Sigma Cat. No. C0750-500G
Rapamycin LC laboratories Cat. No. R-5000
Arginine Sigma Cat. No. A5006-100G
clonNAT
(nourseothricin)
Werner Bioagents Cat. No. 5
G418 (Geneticin) Thermofisher Cat. No. 11811023
2.1.3 Primers
Primers were designed using Pombe PCR Primer Programs from Bahler Lab Resources (BählerLab) and ordered from Eurofins (EurofinsGenomics, 2019).
Description Sequence
[image:19.595.111.538.351.609.2]10 Gaf1 deletion
forward
5’ATTTCATTCGTTTATTTTTTGTTTCGGTTTTTTATT CGGAAACTTCCCTTTTTCTTTCTTATCCACATTTCAAG CTGGCTCGGATCCCCGGGTTAATTAA3'
Gaf1 deletion reverse
5’TGCACACGTAAGCCTCTTGCTCATACAATTAATCGA CTTTTCCGACAAGAAAAAAATTCAAGTCGAAAATATA CTATCTAGAATTCGAGCTCGTTTAAAC3’
2.2 Methods
2.2.1 Library Screening
The Bioneer fission yeast library version 5 (Bioneer, 2010) was grown on YES agar at 32˚C and 10uM Torin1 YES agar plates were prepared. The library was spotted onto Torin1 agar plates using a Singer ROTOR machine and incubated at 32˚C for four days. Plates were photographed and processed into gridded images using the R package Gitter (Wagih and Parts, 2014) for computational comparison of colony size. The list of mutants with a colony size ratio of >3 and <100 was used for gene ontology analysis using AnGeLi (BählerLab, 2015) online software. GO biological processes which showed a greater than twofold change from the background frequency were used for analysis. The online PInt protein prediction tool (BählerLab) was used to predict proteins interacting with Gaf1 and these proteins were then compared to the list of resistant genes to identify future targets for research.
2.2.2 Microfermentation
11 2.2.3 Cell Size Microscopy
A wild type YES culture was grown overnight at 32˚C to OD600=0.2 and split into two. One culture was then treated with 20nM Torin1. Untreated and treated cells were then stained with calcuofluor and septated cell lengths of 50 cells at each timepoint were calculated using Volocity Program. Quantitative statistical analysis of cell length data was performed using prism (GraphPadSoftware, 2018). Turkey’s multiple comparisons test was chosen for statistical analysis to compare the mean of all timepoints to all others.
2.2.4 Microarray Analysis
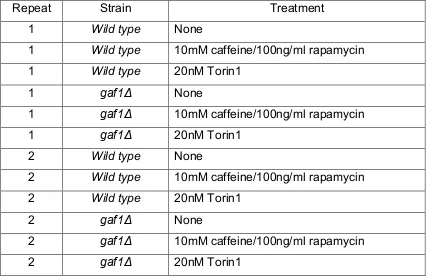
Microarrays were carried out using YES wt and gaf1Δ cell cultures grown to OD600= 0.5 and each of these replicated and treated with 10mM
[image:21.595.113.547.399.677.2]caffeine/100ng/ml rapamycin or 20nM Torin1 for 1 hour. The twelve cultures used in the microarrays are shown in the table below:
Table 3: Details of cultures used in microarray experiment
Repeat Strain Treatment
1 Wild type None
1 Wild type 10mM caffeine/100ng/ml rapamycin 1 Wild type 20nM Torin1
1 gaf1Δ None
1 gaf1Δ 10mM caffeine/100ng/ml rapamycin
1 gaf1Δ 20nM Torin1
2 Wild type None
2 Wild type 10mM caffeine/100ng/ml rapamycin 2 Wild type 20nM Torin1
2 gaf1Δ None
2 gaf1Δ 10mM caffeine/100ng/ml rapamycin
2 gaf1Δ 20nM Torin1
12 70˚C. Cells were thawed on ice and pellets were resuspended in 1ml of DEPC water, spun for 10 seconds at 5000rpm and the supernatant was discarded. 750µl of TES was used to resuspend each pellet and 750µl of acidic phenol-chloroform (Sigma P-1944) was added, the tubes were vortexed and incubated at 65˚C in a heat block. Samples were incubated for 1 hour with vortexing for 10 seconds every 10 minutes. Samples were placed on ice for 1 minute, vortexed for 20 seconds and then centrifuged for 15 minutes at 20,000rcf, 4˚C. 2ml Qiagen phase-lock tubes were pre-spun for 10 seconds and 700µl of
chloroform:isoamyl alcohol (24:1) (Sigma C-0549) was added to each tube. 700ul of the water phase from the samples was added to the phase-lock tubes and they were mixed thoroughly by inverting. They were then centrifuged for 5 minutes at 20,000rcf, 4˚C. 2ml Eppendorf tubes were prepared for each sample containing 1.5ml of 100% EtOH and 50µl of 3M NaAc pH 5.2. 500µl of the water-phase from each sample was transferred into these. The samples were vortexed for 10 seconds and stored at -20˚C overnight to precipitate.
Samples were centrifuged for 10 minutes at 20,000 rcf at room temperature and the supernatant was discarded. 500µl of 70%EtOH (4˚C, made with DEPC water) was added and the samples were spun for a further 1 minute with the same tube orientation. The supernatant was discarded, and the pellets were spun for a further 5 seconds and any remaining supernatant was removed before the pellets were air dried for 5 minutes at room temperature. 100µl of DEPC water was added to resuspend the pellet (by pipetting and 10 sec vortex) and the samples were incubated at 65˚C for 1 minute. RNA concentration was measured using a Nanodrop and volumes corrected to use 100µg of RNA for purification. 3 volumes of 100% EtOH was added to excess RNA sample these were stored at -70˚C. Purification was carried out using RNeasy mini spin columns (Qiagen) as per the manufacturer’s instructions and the columns were eluted twice with RNase-free water. The final RNA concentration was measured by Nanodrop and these concentrations were then adjusted to 2µg/µl.
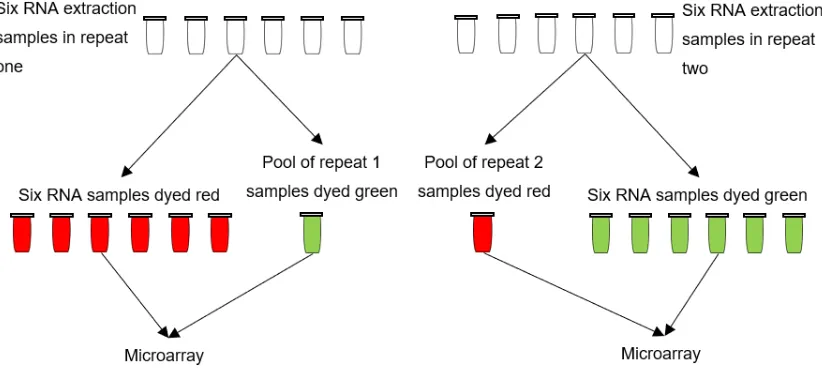
13
Figure 4: Diagram to show process of pool and dye swap strategy for RNA samples used in microarray analysis experiment.
Agilent 8 × 15K custom-made S.pombe expression microarrays were used, and hybridizations and subsequent washes performed according to the
manufacturer’s protocols. The obtained data were scanned and extracted using GenePix, processed using R scripts for quality control and normalization, and analyzed using GeneSpring GX3 (Agilent Technologies UK Ltd, Wokingham, UK). Two independent biological repeats with a dye swap were performed. Online bioinformatics tools and R scripts were used to analyse gene lists and GO enrichment was performed using the AnGeLi bioinformatics tool available online (BählerLab, 2015).
2.2.5 Production of gaf1∆::natMX6 strain from gaf1∆::kanMX6
DNA for transformation was prepared by PCR of a plasmid containing NAT Gaf1 knockout construct using the primers stated below:
MX4/6cassUP: 5′‐GACATGGAGGCCCAGAATAC‐3′ MX4/6cassDwn: 5′‐TGGATGGCGGCGTTAGTATC‐3′
14 gaf1∆::kanMX6 strain yeast were grown overnight in EMM media to OD 0.2-0.5. These cultures were then centrifuged and the cells washed with sterile water once before being resuspended in 1ml of sterile water. The cells were then centrifuged again and washed in 1ml LiAc-TE, centrifuged a final time and resuspended in 100ul of LiAc-TE. 5ul of DNA was added to the 100ul of cells and this was incubated on the bench for 10 minutes. 260ul of LiAc-TE-40%PEG was then added and the cells were incubated at 30˚C in a shaking incubator for 60 minutes. After the incubation 43ul of prewarmed DMSO was added and the cells were heat shocked for 5 minutes at 43˚C. Cells were then centrifuged, washed with sterile water and then resuspended in 750ul of sterile water for plating on three YES agar plates. Once these plates were grown at 30˚C for ~24-48hours they were replica plated on to YES clonNAT plates for selection. Any transformants were streak plated on to YES G418 and YES clonNAT plates to check for the absence of a KAN resistance gene and the presence of a NAT resistance gene.
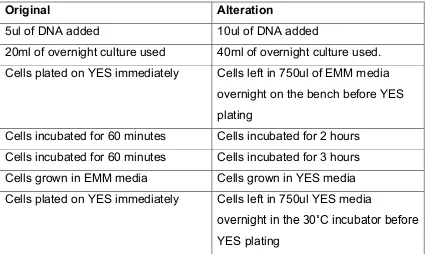
[image:24.595.114.540.472.726.2]After the above method proved unsuccessful several alterations were made to the methodology one by one to improve transformation efficacy. Adaptations tested are shown in the table below:
Table 4: Details of method alterations
Original Alteration
5ul of DNA added 10ul of DNA added
20ml of overnight culture used 40ml of overnight culture used. Cells plated on YES immediately Cells left in 750ul of EMM media
overnight on the bench before YES plating
Cells incubated for 60 minutes Cells incubated for 2 hours Cells incubated for 60 minutes Cells incubated for 3 hours Cells grown in EMM media Cells grown in YES media Cells plated on YES immediately Cells left in 750ul YES media
15 Cells plated on YES immediately then
replica plated onto YES clonNAT agar
Cells left in 750ul YES media
overnight in the 30˚C incubator before plating directly onto YES clonNAT agar
Cells plated on YES immediately then replica plated onto YES clonNAT agar
Cells left in 10ml YES media overnight in in the 30˚C incubator before gently spinning down, removal of excess media and plating directly onto YES clonNAT agar.
Cells incubated for 60 minutes in 30˚C shaking incubator
Cells incubated for 60 minutes in 30˚C stationary incubator
Older DNA synthesised by PCR New DNA synthesised using PCR PCR product used directly without
clean-up
PCR product cleaned up using QUIAGEN PCR Clean Up Kit
2.2.6 Production of gaf1::natMX6 strain from Wild Type strain DNA for transformation was produced by PCR from a plasmid containing NATMX6 cassette flanked by gaf1 homology regions. The PCR product containing the antibiotic resistance/deletion cassette was generated using the primers stated below:
Gaf1DF: 5’- ATT TCA TTC GTT TAT TTT TTG TTT CGG TTT TTT ATT CGG AAA CTT CCC TTT TTC TTT CTT ATC CAC ATT TCA AGC TGG CTC GGA TCC CCG GGT TAA TTA A- 3'
Gaf1DR: 5’- TGC ACA CGT AAG CCT CTT GCT CAT ACA ATT AAT CGA CTT TTC CGA CAA GAA AAA AAT TCA AGT CGA AAA TAT ACT ATC TAG AAT TCG AGC TCG TTT AAA C- 3’
PCR product DNA fragments were separated by gel electrophoresis on 1% agarose gels for one hour and visualised using SYBR-Safe.
17
3 Chapter 3: Results
The techniques and approaches used in this investigation were specially chosen to develop a well-rounded view of Gaf1 involvement in TOR in fission yeast from both a phenotypical and transcriptomic standpoint. A genome wide screen for Torin1 resistance was used to demonstrate the gaf1∆ phenotype and identify mutants with a similar phenotype. Growth kinetics analysis was used along with cell size microscopy to further develop understanding and identify features of this phenotype of long life in TOR inhibition. Transcriptomics in the form of microarrays identified some potential expression changes responsible for the phenotypes observed in the previous experiments.
3.1 A Genome-wide screen for mutants resistant to Torin1
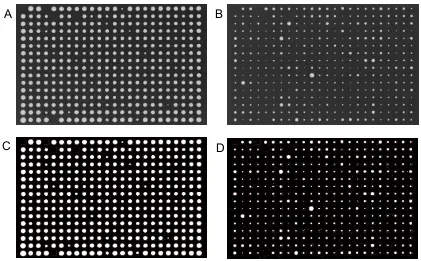
A genome-wide Torin1-resistance screen using the version 5 Bioneer fission yeast deletion library covering 3,400 haploid deletion mutants with a 95.3% genome coverage (Bioneer, 2010) was performed to identify deletion mutants resistant to Torin1 growth inhibition. gaf1 was one of the strains identified to be resistant. Mutants showed differences in growth between control YES plates and Torin1 YES 10uM Torin1 plates (figure 5A and 5B). Plates were
photographed and then colonies were quantified using the Gitter software (Wagih and Parts, 2014). An example of the photographed plates is shown in figure 5A and 5B and the processed quantified images in figure 5C and 5D. Firstly all colonies were normalised with the median of each plate to correct for differential growth between plates. The size ratio between the control and Torin1 plate colony size was then taken for each knockout strain to generate a ratio. From these ratios a gene list is created including all knockout mutants where the colony size ratio is >3 and <100 to be used for gene ontology (GO) enrichment; these arbitrary cut-offs are used to reduce the influence of outliers in the screen data on the GO analysis.
18 of the resistant mutants are related to the endosome, vacuole and vesicular transport.
This study’s Torin1 resistant knockout gene of interest, gaf1, has been shown to be resistant to Torin1 in previous screens (Lie et al., 2018) and was also shown here to be resistant with a library screen ratio of 8.79. PInt protein interaction analysis for Gaf1 is shown in figure 6. Here, line thickness denotes the
confidence of the prediction and known interactions in S.cerevisiae are shown in red. Two genes were found to be both in the PInt predictions and as Torin1 resistant with a colony size ratio of >3 and <100. These can be found
highlighted in yellow in figure 7 and detailed in table 5 along with GO biological processes for these genes.
19
Figure 5: Example of image processing step for library screen data. Images A-D show the first control and Torin1 plates: (A) photograph of plate ‘Control 1-4’ (B) photograph of plate ‘Torin1 1-4’ (C) quantified image of plate ‘Control 1-4’ (D)
quantified image of plate ‘Torin1 1-4’. This image processing is repeated for the remaining control and Torin1 library plates before quantification using the R package Gitter (Wagih and Parts, 2014) to produce a table of strains and colony size ratios.
A B
20
21
22
Table 5: Genes identified by both the Torin1 library screen and the PInt
Interaction prediction for gaf1. PInt Interaction prediction tool uses two machine learning algorithms, Support Vector Machine (SVM) and Random Forest (RF). Using the two combined returns fewer but more confident predictions
(BählerLab).
Gene ID Gene
name
Library screen ratio
SVM Score
RF Score
GO Biological process
SPAC16E8.01 shd1 3.389796882 0.783875 0.612 Actin cytoskeleton organisation and vesicle mediated transport.
SPBC3B8.02 php5 3.055288347 0.873156 0.702 Regulation of transcription by RNA polymerase II.
23
3.2
Growth kinetics analysis of gaf1∆ mutant using
microfermentation
Once gaf1∆ had been identified as resistant to Torin1 by both the previous published library screen (Lie et al., 2018) and the screen carried out in this work, a more comprehensive analysis of cellular growth changes was required. The library screen implicated Gaf1 in TOR signalling so microfermentation was used to further investigate any differences in growth kinetics as well as quantify the growth of gaf1∆ in the presence of Torin1.
Microfermentation analysis and quantification of lag phase using a modified R script based on the grofit package (Kschischo, 2010) (figure 9B) of wild type and gaf1∆ strains showed that gaf1∆ has a shorter lag phase compared to wild-type when treated with 15mM of Torin1, while the untreated cultures displayed identical growth kinetics and reached stationary phase simultaneously (Figure 8). To further investigate the behaviour of wild-type and gaf1∆ cells we
undertook experiments in which Torin1-treated cultures were supplemented with arginine, a TOR stimulator (Yuan et al., 2015). Addition of arginine to the cultures could lead to counteraction and reversion of the effects of Torin1 inhibition. Wild type cells showed a decrease (rescued) lag phase where gaf1∆ cells did not. tor1∆ and tco89∆ (tco89∆ being a core component of fission yeast TORC1) cells were also tested, and both showed rescued lag phases with the addition of arginine (figure 9).
All Torin1 treated cultures displayed a signature decrease in biomass
24
Figure 8: Biomass graph from BioLection showing wild type control (red), gaf1∆
25
Figure 9: A) Biomass graph from BioLection showing wild type control (red),
gaf1∆ control (blue), wild type + Torin1 15mM (green), gaf1∆ + Torin1 15mM
(yellow), wild type + Torin15mM and arginine (purple) and gaf1∆ + Torin 15mM
and arginine (orange) (B) Bar graph to show changes in lag phase length for
gaf1∆, wild type, tco89∆ and tor1∆ cells when treated with Torin 10mM, Torin
[image:35.595.124.497.80.526.2]26
Figure 10: Biomass graph from BioLection showing arginine rescue of
27
28
Figure 12: Biomass graph from BioLection (A) wild type, (B) gaf1∆, (C) tor1∆
29 Alternatively to Torin1, combined caffeine and rapamycin treatment can be used to inhibit TOR in fission yeast. 10mM caffeine and 10ng/ml rapamycin treatment of wild type, gaf1∆, tor1∆ and tco89∆ cells inhibited growth in all cases,
increasing lag phase in all cases and decreasing overall cell density in wild type, tor1∆ and tco89∆. In wild type, gaf1∆ and tco89∆ strains a signature decrease appeared on the treated cultures immediately following exponential growth (figure 12). Nevertheless, as in the case of Torin1, gaf1∆ seems to be more resistant to caffeine/rapamycin combinational treatment compared to wild type cells. This is in accordance to previous results and genome wide screens with this drug combination(Rallis et al., 2014).
30
3.3 Examining Spatial Aspects of TOR inhibition using Cell
Size Microscopy
After collecting data on temporal aspects of cell growth we turned to
investigating spatial aspects of cell growth. Both spatial and temporal aspects of cell growth have strong links to TOR control (Gonzalez and Rallis, 2017). We performed a time-course of Torin1 inhibition with or without arginine
supplementation, coupled with microscopy and measurement of cell size changes, to record spatial downstream effects of pan-TOR inhibition. Cell size data collected over a 60-minute period shows that wild type cells treated with Torin1 decrease in size from an average of 15.2 micrometres to an average of 13.8 micrometres over this time frame whereas cells treated with both Torin1 and arginine show no significant decrease in size from the original size at time zero with an average size of 15.1 micrometres after 60 minutes (figure 13 and table 6). Statistical analysis of this data using ANOVA and Turkey’s multiple comparisons test in Prism (table 6) showed cells treated with Torin1 to be statistically significantly smaller than time zero to <99th percentile
and statistically significantly smaller than those treated with Torin1 and arginine to <95th percentile. It showed no statistically significant difference in cell size
between the time zero cells and those treated with Torin1 and arginine. Cell size was also shown to be statistically significant to <99th percentile between
31
32
Table 6: p-values for Turkey’s multiple comparisons test of cell size data
showing p-value for each comparison and if there is a significant difference between them. The p-values show significant differences in cell size between cells treated with only Torin1 and those treated with Torin1 and arginine at both time points.
COMPARISON P VALUE SIGNIFICANT?
TIME ZERO - 15MIN TORIN1 0.0227 YES
TIME ZERO - 60MIN TORIN1 <0.0001 YES
TIME ZERO - 15MIN TORIN1+ARGININE 0.9221 NO
TIME ZERO - 60MIN TORIN1+ARGININE 0.9912 NO
15MIN TORIN1 - 60MIN TORIN1 0.0013 YES
15MIN TORIN1+ARGININE - 60MIN TORIN1+ARGININE
0.9958 NO
15MIN TORIN1 - 15MIN TORIN1+ARGININE 0.1829 YES
60MIN TORIN1 - 60MIN TORIN1+ARGININE <0.0001 YES
Subsequent analyses (not part of this MRes) of gaf1 cells with Torin1 and arginine treatments as described above indicate that arginine can ‘rescue’ the Torin1-induced cell size decrease in the gaf1 mutant background as also seen in figure 10.
Given that Gaf1 is a transcription factor these temporal and spatial changes in cell growth can be further investigated in relation to Gaf1 by gene expression analysis. The growth changes seen could be due to gene expression
33
3.4
Gene expression analysis of wt and gaf1∆ cells using
microarrays
A two-colour microarray experiment using custom made arrays (Agilent) was conducted in two biological repeats with a dye swap, to account for dye bias. Sample pools were used as reference to allow all genotypes and treatments to be directly comparable. Pooled samples were labelled with the opposite dye and used as a background comparison to all individual samples. This process was repeated with a dye swap for the duplicate samples and pool (figure 4). Duplicates were averaged and normalised before up and down regulated gene lists were produced by GenSpring. An example of the Lowess normalised data, limma and marray packages and in-house R scripts is shown in figure 14. The approach with pools and dye swaps is common in such experiments and has been successfully used in the past in numerous fission yeast studies (Rallis et al., 2013, Rallis et al., 2014).
Normalised data were inserted into the Genespring program where differentially expressed genes were extracted using standard approaches within the
34
35
Figure 15: Venn diagrams to show overlap in (A) downregulation of genes in
gaf1∆ and wild Type cells treated with caffeine and rapamycin or Torin1 (B) upregulation of genes in gaf1∆ and wild type cells treated with caffeine and
rapamycin or Torin1 (C) up and downregulation of genes in gaf1∆ cells treated
36 Figure 15 A is a Venn diagram representation of downregulated genes showing 44 genes to be exclusively downregulated in Torin1 treatment of gaf1∆, 100 genes less than those exclusive to the wild type strain treated with Torin1. The number of upregulated genes (as shown in figure 15B) were much more similar for these two categories but there were still less in the gaf1∆ category with 61 as opposed to 85 genes. Figure 15C shows only a single gene overlap between the up and down regulated genes in the case of both the caffeine and
rapamycin and Torin1 treatments.
37
Figure 16: Bar graph to show GO enrichment percentage list frequency of >twofold change from background frequency on gene lists of (A) genes
exclusively downregulated in wt treated with Torin1 and (B) genes exclusively
downregulated in gaf1∆ treated with Torin1. Significantly more processes seem to be downregulated in the wt strain than the gaf1∆ strain which supports the hypothesis of gaf1∆strain’s reduced response to Torin1 treatment.
A
38 GO enrichment results which were at least a twofold change from the
background frequency percentage are shown in the bar charts in figure 16. It shows an overlap in downregulation between wild type and gaf1∆ cells with regards to genes involved in translation, cytoplasmic translation,
ribonucleoprotein complex biogenesis and ribosome biogenesis. Disproportionate downregulation in genes involved in formation of the cytoplasmic translation initiation complex and ‘de novo’ protein folding are shown to be exclusive to gaf1∆ cells (figure16B), while that of those involved in the processing and metabolic processes of ribosomal RNA and non-coding RNA are shown to be exclusive to wild type cells (figure16A).
Gene lists were then produced in the same way of all genes either exclusive to caffeine and rapamycin treatment or found in both caffeine and rapamycin treatment and Torin1 treatment for both gaf1∆ and wild type cells. GO enrichment performed on these two lists where the list frequency showed at least a twofold change from the background frequency can be found in figure 17. Notably, rRNA and ncRNA processing and metabolic processing are seen to be strongly downregulated in both the wild type and gaf1∆ cells.
39
Figure 17: Bar graph to show GO enrichment percentage list frequency of >twofold change from background frequency on gene lists of (A) genes downregulated exclusively in wt treated with caf/rap and overlap
downregulation in wt treated with caf/rap and wt treated with Torin1 and (B)
genes downregulated exclusively in gaf1∆ treated with caf/rap and overlap
downregulation in gaf1∆ treated with caf/rap and gaf1∆ treated with Torin1.
There is a more similar number and range of processes seen between the wt and gaf1∆ strain downregulation in response to treatment with caffeine and rapamycin than seen in response to Torin1 treatment.
A
40 A
41
Figure 18 (previous page): Bar graph to show GO enrichment on gene lists of (A) genes exclusively upregulated in wt treated with Torin1 (all GO biological
processes shown) and (B) genes exclusively upregulated in gaf1∆ treated with Torin1 (GO biological processes with percentage list frequency of >twofold change from background frequency shown). Many more processes are seen to be upregulated by the gaf1∆ strain than the wt strain during the Torin1
treatment. This supports the hypothesis of reduced downregulation in response to Torin1 treatment in the gaf1∆ strain.
42
43 Figure 19 shows the GO enrichment for the list of genes upregulated
exclusively by wild type cells treated with caffeine and rapamycin and upregulated in wild type cells both when they are treated with caffeine and rapamycin and when they are treated with Torin1. In this dataset,
organonitrogen metabolic and catabolic processes are seen to be
disproportionately more common in the gene list than the background. The GO enrichment analysis of the list of genes found to be upregulated in gaf1∆ cells treated with caffeine and rapamycin and found to be upregulated in both gaf1∆ cells treated with caffeine and rapamycin or treated with Torin1 produced no GO Biological Process hits with more than a twofold change from the
background frequency.
44
3.5 Production of Strain for Synthetic Genetic Arrays
The initial goal of the project was to identify genes that might sensitise gaf1 to Torin1 using Synthetic Genetic Array (SGA) screening. This type of experiment would have produced a dataset of an undefined interactome of gaf1 and a Torin1 dependent interactome highlighting genes which enhance or abolish the Torin1-resistant phenotype of gaf1∆ cells.
SGA analysis is a technique where a mutant of interest (query strain), in this case gaf1∆, is mated to the entire Bioneer fission yeast deletion library (Bioneer 2010). The resulting double knockout colony sizes are used as a proxy to show if the genes have a genetic interaction and if this is positive or negative. During mating an integral step is to select for cells containing both knockout constructs, this is achieved by growth on relevant selective media. The gaf1∆ strain used in this study contained a kanamycin (G418) resistance gene, which is also the gene in the Bioneer deletion library. For this reason, a gaf1∆ strain with a
different selection marker would be needed for selection of double mutants after mating.
45
Figure 20: 1% agarose gel electrophoresis of PCR product (1.45kb) visualised using SYBR-Safe for (A) h-gaf1∆::kanMX6 to h-gaf1∆::natMX6 transformation
(B) wild type to h-gaf1∆::natMX6 transformation. Fragment bands are indicated between 1kb and 1.5kb ladder fragments by the grey arrow.
A
B
1kb
1kb 1.5kb
46
4 Chapter 4: Discussion
Deletion of gaf1, coding for a GATA transcriptional regulator results in cells that are resistant to Torin1 growth inhibition. Mutants resistant to Torin1 are related to vesicle transport (figure 6), a process also identified by a previous published screen (Lie et al., 2018). However, to date, gaf1 has not been involved with this biological process. Nevertheless, the Gaf1 orthologue in budding yeast, Gat1, has been shown to be to be strongly connected with vacuole and vesicle
transport (Fayyadkazan et al., 2014, Kingsbury and Cardenas, 2016). To better understand the underlying mechanism of the resistance of gaf1∆ to Torin1, the mutants found resistant in our screen were cross-referenced with predicted protein interactions with gaf1 (figure 7). Two genes were identified as both resistant to Torin1 inhibition and as predicted to physically interact with Gaf1 protein (table 5). The gene with the strongest confidence in prediction, php5, is involved in regulation of transcription via RNA polymerase II. This function is closely related to a gaf1 function: RNA polymerase II proximal promoter sequence-specific DNA binding (Pombase). The other gene identified, shd1 (cytoskeletal protein binding protein Sla1 family), codes for a protein involved in vesicle-mediated transport and this could present a potential way that gaf1∆ resistance is also vesical transport mediated. Interestingly shd1 has been shown to be long lived in a previous caffeine and rapamycin screen (Rallis et al., 2014) implicating it in TORC1 signalling. Intracellular trafficking and endocytosis have been found to contribute to necrotic neurodegeneration (Troulinaki and Tavernarakis, 2012) and therefore shd1-mediated lifespan extension would be a gene of interest for future ageing studies. Both php5 and shd1 would be genes of interest in a future synthetic genetic array experiment to investigate their interaction with gaf1.
The use of a library screen is very useful as a tool to quickly identify, in genomic scale, genes which are particularly resistant to or sensitised by certain
47 reproducible. As a next step it is important to establish a gene of interest’s Torin1 resistance by other methods to verify the library screen results. This can be done in several ways such as using stress spot plate experiments,
chronological lifespan assays or microfermentation. As well as this, screens can be compared to previous published library screens to help establish their
reliability. The results of this screen showed a strong similarity with the results from the published screen in not only identified gene hits but also GO metabolic processes (Lie et al., 2018).
Spotting serial dilutions of mutant cultures on plates are a similar experiment to the library screen and can produce only limited data as, due to their qualitative nature, they are unable to provide insight into the growth curve of the cells; therefore, they are more appropriate for use as a quick validation method than an actual experimental measurement for which a quantitative method is
preferable. For this study microfermentation, which provides quantitative growth aspects was preferable to lifespan assays as the data is produced much more quickly and therefore many more conditions could be studied in a relatively limited time frame. In addition, the effect of Torin1 on the chronological lifespan of fission yeast is an integrated part of another study within the lab and is not the focus of this thesis.
Figure 8 shows that gaf1∆ cells are resistant to Torin1 inhibition compared to wild type cells with regards to lag phase. This confirms the resistance shown in the library screen and clearly shows that the difference in growth kinetics can be potentially explained by the decreased lag phase. Figure 8 also highlighted a signature decrease in biomass in response to Torin1 in both gaf1∆ and wild type cultures. To rescue the effects of Torin1 inhibition, arginine, a potent TOR stimulator (Yuan et al., 2015), was added to the cultures. This notably rescued the lag phase in wild type but not gaf1∆ cells; however, it rescued the signature decrease in biomass in both (figure 9). The same microfermentation experiment included tor1∆ and tco89∆ (a functional deletion mutant of a fission yeast
TORC1 core component) and both cultures here also showed lag phase rescue with the addition of arginine. This suggests that potentially the arginine lag phase rescue effect is a Gaf1-dependent process related to Gaf1’s role in
48 To find the optimum arginine concentration for lag phase rescue in wild type a microfermentation experiment was set up to include a range of arginine
concentrations. Figure 11A shows that increasing levels of arginine results in increasing lag phases rather than the rescue that had previously been seen. To identify the cause of this, pH was also measured in an identical experimental setup and the rapidly increasing pH shown in figure 11B correlates exactly with the biomass with the pH levelling and the biomass effect ending at ~10-16 hours respectively. This led to the conclusion that while arginine can rescue Torin1-induced lag phase extension, when increasing arginine concentration increases the pH of the culture too much this effect is overridden by the effect of more alkaline conditions. This means that a more effective arginine treatment could be created by pH correcting media plus arginine in future experiments. Interestingly, the rescue of the signature decrease in biomass appears
independent of the pH changes and is unlikely to have been caused by them since Torin1 treatment itself increases pH from the control but less so than low concentrations of arginine. Figure 10 shows that the Torin1-dependent
decrease in biomass seen in both wt and gaf1∆ can be rescued by addition of arginine to the culture. This decrease in biomass was hypothesised to be caused by a reduction in cell size, supported by the data in figure 13. Here it is shown that, at both time points, the addition of Torin1 significantly reduced cell size from time zero however the addition of Torin1 and arginine did not, clearly showing that arginine does rescue a cell size reduction in Torin1 treatment. Potentially this reduction in cell size could be due to temporal aspects of the cell cycle alteration causing the cells to divide earlier or spatial aspects of cell
growth such as metabolic dependent cell size in response to treatment by Torin1 (Gonzalez and Rallis, 2017, Rallis et al., 2013). gaf1∆ cells show the same signature as the wild type cells, so it can be theorised that this is also due to a reduction in cell size. The data suggests that lag phase rescue in response to arginine treatment is Gaf1 and pH dependent whereas the cell size rescue is Gaf1 and pH independent.
49 (Laor et al., 2015). In gaf1∆ cells the loss of downstream Gaf1 functions are believed to be the cause of Torin1 resistance so it is an interesting point for further research that the deletion of Gaf1 and its downstream targets have no effect on the signature biomass decrease potentially caused by cell size reduction but does affect temporal aspects such as cellular lifespan and lag phase.
In this study, the biomass decrease is a feature seen in Torin1 TOR inhibition but not caffeine and rapamycin TOR inhibition. It is known that caffeine and rapamycin inhibition of TORC1 causes cell size reduction by advancing mitotic onset (Gonzalez and Rallis, 2017, Rallis et al., 2013). With this in mind, while previous literature shows that cell size can be TORC1 dependent (Rallis et al., 2013), the biomass decrease was not seen in the caffeine and rapamycin results through microfermentation analysis, suggesting that further study
surrounding the mechanism would be needed to fully determine the involvement of TORC1/TORC2 in this phenomenon. Figure 12 shows an unexplained
decrease in biomass in caffeine and rapamycin treatment at ~20 hours not present on the controls in gaf1∆, wt and tco89∆ but not tor1∆, the functional knockout of TORC2. There is a potential for further study of cell size at this point as it is known that prolonged treatment with rapamycin causes TORC2 inhibition. Correlating cell size microscopy data could potentially suggest that this response could be TORC2 mediated as well as the already known TORC1 involvement (Rallis et al., 2013). The theory that the Torin1 dependent decrease in cell size could be TORC2 dependent would explain how it could be Gaf1 independent as Gaf1 is directly dephosphorylated by TORC1 inhibition but it’s involvement with TORC2 is currently undefined and may be less direct.
Gene expression analysis was performed using a custom microarray platform. This technique was chosen over alternatives because microarrays were already an established pipeline within the lab and the technique was less expensive than other options, such as RNA-Seq. Microarray analysis is an established and reliable method of expression analysis, however there are limitations;
microarrays are not an open platform such as RNA-Seq meaning that the technique is restricted by the pre-chosen number of gene probes included within the array. Microarrays are also affected by cross or non-specific
50 of microarrays, a statistical assumption is made that most genes show no
change. This means that some small expression changes may not be detected if they are hidden by this assumption.
Microarray analysis was used to study the expression differences between wild type and gaf1∆ fission yeast treated with Torin1 as well as with a combination of caffeine and rapamycin. These results are likely to be valid due to the dye swap used to eliminate dye bias and the fact that untreated and fast growing gaf1∆ and wild type cells showed no difference in expression (data not shown). This indicates that expression changes seen are likely to be due solely to the cell’s response to treatment.
Microarray data was processed to produce gene lists of up and downregulated genes for each parameter and these lists were initially compared using Venn diagrams shown in figure 15. Here there are 100 more genes exclusively downregulated in wild type cells in response to Torin1 treatment than in gaf1∆ cells in response to Torin1 treatment (figure 15A) with more similar results seen for upregulation (figure 15B). Figure 15C showed virtually no overlap between upregulated and downregulated genes in the gaf1∆ samples further evidencing the validity of the microarray results. This initial Venn diagram analysis
demonstrated the heavy involvement of Gaf1 in regulating genes downstream of TOR and the need to further analyse these gene lists to identify
Gaf1-dependent cellular functions. To do this gene ontology enrichment analysis was performed using the AnGeLi online bioinformatics tool.
51 could be to accumulate amino acids within the cell without metabolising them in response to TOR inhibition which is naturally caused by lack of nutrient
availability.
Figure 16B highlights that genes involved in the formation of the cytoplasmic initiation complex and de novo protein folding are disproportionately present in the gaf1∆ Torin1 downregulated genes list. This suggests that these two processes are either directly or indirectly upregulated by Gaf1 or that their downregulation is prevented by Gaf1 in wild type cells. This data is consistent with the current knowledge that Gaf1 stimulates amino acid uptake during TOR inhibition (Laor et al., 2014) thought to be part of a process which allows Gaf1 to immediately compensate for TOR inhibition in a cell. In this way, Gaf1 could also be responsible for stimulating other cell processes necessary for survival such as the translation and protein synthesis involvement seen here. Genes involved in the regulation of cellular processes and regulation of biological processes are seen to be disproportionately absent from the wild type downregulation shown in figure 16A, supporting this hypothesis that Torin1 treatment leads to Gaf1 dependent stimulation of cellular processes to compensate for TOR inhibition.
The distinct reduction in downregulated genes in response to Torin1 inhibition in gaf1∆ cells, compared to wild type cells could account for gaf1∆ resistance to Torin1 in terms of growth. Gaf1-dependent downregulation of rRNA and ncRNA processing and metabolic process included ten genes directly involved with tRNAs, supporting current ChiIP-seq data that Gaf1 can directly regulate tRNA expression, following TOR inhibition (Rodriguez-Lopez, Gonzalez et al.,
52 The GO enrichment in figure 18 shows that in wild type cells, treated with
Torin1, upregulation of macromolecule metabolism and catabolism was
disproportionately absent, while upregulation of metabolism and catabolism was disproportionately present in gaf1∆ cells, treated with Torin1. This supports the idea that Gaf1 is implicated in organonitrogen metabolism, namely that of amino acids and nucleotides. Inhibition of TOR should lead to a reduction in metabolic processes (Laplante and Sabatini, 2012) as seen in the wild type cells treated with Torin1 however the upregulation of these processes seen in the gaf1∆ cells treated with Torin1 suggests that Gaf1 is integral to the suppression of some metabolic processes during TOR inhibition.
Figure 19 shows the GO enrichment for the list of genes upregulated exclusively in wild type cells treated with caffeine and rapamycin and those upregulated both when wild type cells are treated with caffeine and rapamycin or Torin1. Here we see upregulation of organonitrogen metabolic processes but a lack of upregulation for several other metabolic processes. Interestingly the list for upregulated genes in gaf1∆ cells when treated with caffeine and rapamycin and upregulated when treated with either caffeine/rapamycin or Torin1 produced no GO enrichment hits so it cannot be used as a comparison. However, in the Torin1 inhibition of gaf1∆ cells we see that upregulation of organonitrogen processes but not of other metabolic and catabolic processes suggesting there may be little to no change between the wild type and gaf1∆ in this respect. It is known that GATA transcription factors in budding yeast, including the Gaf1 orthologue Gat1 are involved in nitrogen catabolite
repression sensitive gene expression control (Cooper, 2002) and recent ChIP-seq data (Rallis, personal communication) suggests Gaf1 regulates
organonitrogen compound genes and potentially plays a role in nitrogen
53 required a gaf1∆ strain with a selective marker different from the library
knockouts to allow for double mutant selection after mating.
To construct this strain a transformation using a natMX6 cassette was
attempted multiple times with 12 method adaptations, however, even after fresh DNA was produced by PCR (figure 20A), no successful colonies were obtained. On two occasions a cell line resistant to both G418 and clonNAT was generated suggesting that the fragment had inserted itself into a different locus. For this reason, the cassette was amplified from the plasmid again using new primers for generating an independent gaf1∆ knockout directly from wild type cells (figure 20B) which has larger homology regions. Using this approach we
generated much more DNA for transformations, however no transformants were obtained. Due to time constraints on the MRes project it was impossible to continue attempts to produce the strain necessary and therefore also
impossible to carry out the planned SGAs. Given more time adaptations to the methodology for the wild type knockout would have been made until the
transformation was successful. Alternatively, a CRISPR/Cas9 approach could have been used to create the strain as it would likely have been successful however time constraints did not allow this approach.
54
5 References
ABRAHAM, R. T. 1998. Mammalian target of rapamycin: immunosuppressive drugs uncover a novel pathway of cytokine receptor signaling. Curr Opin Immunol, 10, 330-6.
ARONOVA, S., WEDAMAN, K., ANDERSON, S., YATES, J., 3RD & POWERS, T. 2007. Probing the membrane environment of the TOR kinases reveals functional interactions between TORC1, actin, and membrane trafficking in Saccharomyces cerevisiae. Mol Biol Cell, 18, 2779-94.
BÄHLERLAB. Resources [Online]. Available:
http://www.bahlerlab.info/resources/ [Accessed 2018]. BÄHLERLAB. 2015. AnGeLi [Online]. Available:
AnGeLihttp://bahlerweb.cs.ucl.ac.uk/cgi-bin/GLA/GLA_input [Accessed]. BEAUCHAMP, E. M. & PLATANIAS, L. C. 2013. The evolution of the TOR
pathway and its role in cancer. Oncogene, 32, 3923-32.
BHOLA, N. E., JANSEN, V. M., KOCH, J. P., LI, H., FORMISANO, L.,
WILLIAMS, J. A., GRANDIS, J. R. & ARTEAGA, C. L. 2016. Treatment of Triple-Negative Breast Cancer with TORC1/2 Inhibitors Sustains a Drug-Resistant and Notch-Dependent Cancer Stem Cell Population. Cancer Res, 76, 440-52.
BIONEER. 2010. S. pombe Deletion Mutant Library from Bioneer [Online]. Available:
https://us.bioneer.com/products/spombe/spombeoverview.aspx
[Accessed 29/10/2018 2018].
BLENIS, J. 2017. TOR, the Gateway to Cellular Metabolism, Cell Growth, and Disease. Cell, 171, 10-13.
BROWN, E. J., ALBERS, M. W., SHIN, T. B., ICHIKAWA, K., KEITH, C. T., LANE, W. S. & SCHREIBER, S. L. 1994. A mammalian protein targeted by G1-arresting rapamycin-receptor complex. Nature, 369, 756-8. COOPER, T. G. 2002. Transmitting the signal of excess nitrogen in
Saccharomyces cerevisiae from the Tor proteins to the GATA factors: connecting the dots. FEMS microbiology reviews, 26, 223-238.
DAZERT, E. & HALL, M. N. 2011. mTOR signaling in disease. Curr Opin Cell Biol, 23, 744-55.
EUROFINSGENOMICS. 2019. DNA & RNA oligonucleotides [Online]. Available:
https://www.eurofinsgenomics.eu/en/dna-rna-oligonucleotides.aspx [Accessed].
FAYYADKAZAN, M., TATE, J. J., VIERENDEELS, F., COOPER, T. G., DUBOIS, E. & GEORIS, I. 2014. Components of Golgi-to-vacuole
trafficking are required for nitrogen- and TORC1-responsive regulation of the yeast GATA factors. MicrobiologyOpen, 3, 271-287.
GONZALEZ, S. & RALLIS, C. 2017. The TOR Signaling Pathway in Spatial and Temporal Control of Cell Size and Growth. Front Cell Dev Biol, 5, 61. GRAPHPADSOFTWARE. 2018. Prism [Online]. Available:
https://www.graphpad.com/scientific-software/prism [Accessed].
HEITMAN, J., MOVVA, N. R. & HALL, M. N. 1991a. Targets for cell cycle arrest by the immunosuppressant rapamycin in yeast. Science, 253, 905-9. HEITMAN, J., MOVVA, N. R., HIESTAND, P. C. & HALL, M. N. 1991b. FK