2016 International Conference on Manufacturing Science and Information Engineering (ICMSIE 2016) ISBN: 978-1-60595-325-0
The Realization of the Millimeter Wave
Imaging System Based on Vector
Network Analyzer
XIUWEI YANG, CHENGYAN JIA and ZHONGLIN SUN
ABSTRACT
Using the vector network analyzer hand spread spectrum module, the attenuation characteristics of THz wave near the 75 GHZ to 110 GHZ(W), the characteristics or internal defects of the object can be imaged, through the reflected and transmitted treatment. The use of Matlab platform to study and analysis on a variety of imaging algorithm and the image processing, feature selection for object accurate imaging algorithm, realize high-resolution images show that efficient internal defect coal imaging information.
INTRODUCTION
In the electromagnetic wave band, the position of the millimeter wave is between microwave and sub-millimeter wave. Millimeter wave of low frequency attach to the microwave, the high frequency side is adjacent to the millimeter wave frequency, and infrared and optical band is close[1]. Millimeter wave has the characteristics of infrared and microwave, compared with the infrared and visible light waves, and has a longer wavelength, so its penetrating is better than that of infrared and visible light. In addition, millimeter wave has all-weather work ability. Compared with the microwave, millimeter wave has a higher frequency, so the millimeter wave imaging can get higher resolution. And compared with microwave, millimeter wave circuit is easier integration with smaller volume. In short, there are two prominent advantages: millimeter wave has a certain ability to penetrate smoke and clothing, the other is the millimeter wave has all-weather work ability[2-3]. Two millimeter wave characteristics above makes millimeter wave short-range imaging _______________________
Xiuwei Yang, Zhonglin Sun, Institute of Automation, Shandong Academy of Sciences, China. 250103
technology especially suitable for application in human security, medical diagnosis, military reconnaissance, etc [4]. Millimeter wave imaging can obtain the widespread application [5].
Coal as main energy in our country, has been dominant in the one-off energy consumption structure, It is the proportion of 60% ~ 70%. With the increasing of coal mining intensity, the deep mine mining, the deep of the growing problem of coal mine water disasters of mine mining, the personal casualties and economic losses is extremely heavy [6-7]. It is necessary to explore a new kind of high precision flood detection means, and the fracture is the main factor causing floods in the coal mine, so to develop a set of effective detection of underground coal mining fissure system is particularly urgent[8].
Using millimeter wave imaging methods of coal fracture detection has advantages that it doesn’t undermine coal structure. It can be the internal crack detection imaging, easy to use, safe. This paper built a set of millimeter wave imaging system. The coal fracture imaging analysis has laid a certain research foundation for instrument development[9].
SYSTEM STRUCTURES
VNA Sacnning table
Transmitter Module
Receiver Module
source source
Host computer
Figure 1. The millimeter imaging system.
object is carried out by scanning station. Figure 1 is the structure of the millimeter wave imaging system structure.
1.1 Transmitting and Receiving
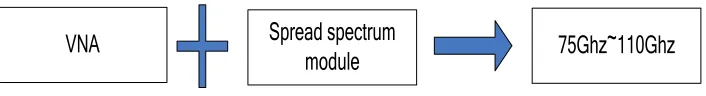
Agilent Co's vector network analyzer N5247 can output the signal between10Mhz to 67Ghz, in order to achieve the W band, we use electronic frequency doubling method to improve the output frequency to W frequency band [11]. As shown in Figure 2, the vector network analyzer provides the original signal to the DSSS module, after the DSSS module can launch W band electromagnetic wave signals; electromagnetic wave arrives the object and a measured object signal of electromagnetic wave is reflected back to the DSSS module, then the spread spectrum module of directional coupler and the reference channel signal separation are mixed with the local oscillator signal obtained intermediate frequency signal, the vector network analyzer will realize analysis and calculation.
1.2 Test Method
Millimeter wave imaging system needs to scan measurement object point by point, then the data of each point on the object form image by processing[12]. This scenario using scanning control system control scanning mobile object to scan measurement object point by point. Signal transmit to scan a certain position of the object, reflection signal or transmission signal is received. The receiver will be output reflection signal or transmission signal to the vector network analyzer, and then, scanning platform control system will control scanning platform moving a step to measure the next point on the object[13]. To realize measurement of each point on the object to be tested through the movement of the scanning platform, of which scanning platform step precision determines the precision of imaging and the resolution of the image.
75Ghz~110Ghz Spread spectrum
[image:3.612.122.475.517.565.2]module VNA
Figure 2. Implement of w-band electromagnetic wave.
IMAGING METHOD
Extracting data in a file and using the corresponding algorithm can form the image and display [14].
By millimeter wave imaging system to all the points on a data acquisition, data of each location will have a maximum and minimum, therefore, imaging in
maximum, minimum or peak-to-peak values can be used. Three imaging methods above can effectively reflect the dispersion and absorption characteristics of the object tested [15-16].
In this paper, taking coal as a sample, test the possible fractures in coal. In order to verify the three imaging methods for coal fracture which get images more clear and own smaller errors, the following will be to deal with three types of coal fracture analysis.
2.1 Sample Selection
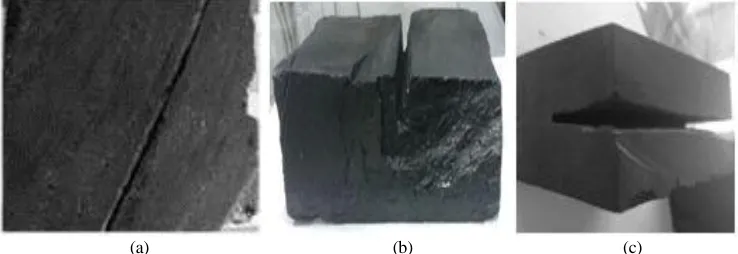
As shown in figure 3, the cracks of the coal sample a on the surface of coal is clearly visible; the cracks of the coal sample b are in the bottom tier; the cracks of the coal sample c are in the middle tier, which is a plane perpendicular to the direction of electromagnetic wave propagation. Install the three samples successively on the scan and scan imaging. Set the scanning step 0.5 mm, scanning area 40 mm * 40 mm, therefore, S parameters of 6561 points of data can be received.
(a) (b) (c)
Figure 3. (a) The coal with surface crack, (b) the coal with back crack, (c) the planar crack in the coal sample.
2.2 Data Collection
As shown in figure 4, it is collected S11 data into the image grey value of the
data you need,specific steps are as follows:
I:Records of each point on the w-band S11 data, at the same time record the
[image:4.612.114.483.388.515.2]II: All points of peak value: maximum minus the minimum for data reduction; Maximum peak: Max saved as data; minimum peak: min data is saved as a data;
III: From the data in the data to find the maximum frmmax, and minimum frmmin, map the maximum for the grey value 255, minimum value mapping for the grey value 0, according to the formula:
255 0 0
max min min
color frm frm data frm
(1)
Here, the data is above a certain point the step II selected values, which color is the grey value after that point mapping. The data in the data mapping by the gray value of each point:
255*( min)
max min
data frm
color frm frm
(2)
Calculation process is shown in figure 4:
S11 data
Extract the max, min and peak data
Extract the frmmax and frmmin of data
The data mapping for the grey value
End Start
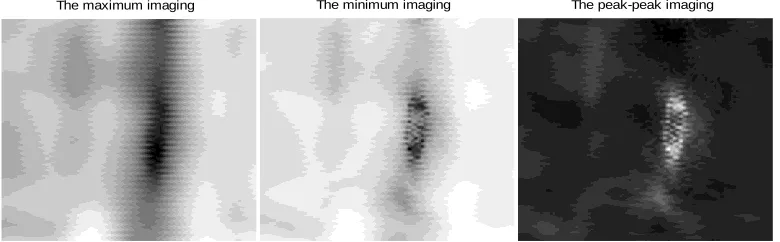
Figure 5. The imaging results of coal sample with surface crack by 3 types imaging ways.
2.3 The Plot
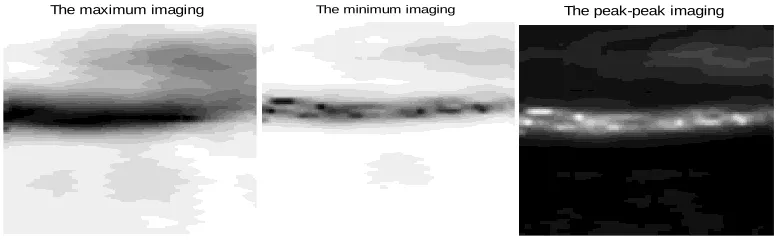
After mapping the grey value by Matlab drawing function to get the whole image. As shown in figure 4 is a sample under three imaging methods are like. As shown in figure 5 is the sample b under three imaging methods are like. In figure 8 samples under three imaging methods are like. Can get from this, the maximum imaging method of image obtained by fissure most clearly. The most suitable for using the method of maximum imaging for coal crack detection and imaging.
Figure 6. The imaging results of coal sample with back crack by 3 types imaging ways.
The maximum imaging The minimum imaging The peak-peak imaging
[image:6.612.100.490.411.532.2]Figure 7. The imaging results of coal sample with planar crack by 3 types imaging ways.
CONCLUSION
The millimeter wave imaging system in this paper, using the existing equipment and spread spectrum module, greatly reduce the cost of building system eventually achieved ideal effect. By measuring the coal fracture imaging analysis, the qualitative comparison of the three imaging methods, from the imaging result shows that the maximum value method to get the image of the clear, identify the most suitable for a variety of coal fracture, defect inspection for millimeter wave imaging in coal future research has certain significance.
ACKNOWLEDGEMENTS
This work has been financially supported byNational and international scientific
and technological cooperation projects (No. 2015DFA11200); and Key research and development program of Shandong Province (Project No. 2015GGX101030).
REFERENCES
1. Orlando A. R., Gallerano, G. P. 2009. “Terahertz radiation effects and biological application,” Journal of Infrared, Millimeter and Terahertz Waves”, 30(12):1308-1318.
2. Cao Zhixiang. 2012. “The study of near range active millimetre wave imaging system,” University of Electronic Science and Technology of China.
3. Dong Shuning,Hu Weiyue. 2007. “Basic characteristics and main controlling factors of coal mine water hazard in China,” Coal Geology & Exploration, 35( 5) :34-38.
4. Hu Weiyue, Tian Gan. 2010. “Mine water disaster type and prevention and control countermeasures in China,” Coal Science and Technology, 38( 1) :92 - 96.
5. Jia Chengyan, Chang Tianying, Fan Wei, et al. 2015. “Attenuation characteristics of Terahertz wave penetrating coals,” Journal of China Coal Society, 40(S1):298-302.
6. Kirichuk V. F., Tsymbal A. A.2010. “Use of terahertz electromagnetic waves for correcting hemostasis functions,” Biomedical Engineering, 44(1):11-14.
7. Perret E., Zerounian N., David S., Aniel F.2008. “Complex permittivity characterization of benzocyclobutene for terahertz applications,” Microelectronic Engineering, 85(11):2276-2281.
8. Gu Xinhai. 2008. “Principle of operation of network analyzer and its application to electrical measurements,” Electronic Engineer, 2008,34(7):15-18.
9. Zhang Na, Li Yuan, Jin Baolong. 2007. “Flexible application of network analyzer for measurement of frequency translating devices,” China Measurement Technology, 33(4). 10. Liu Jian. 2006. “The study of antenna near-field measurement system based on network
analyzer,” Chengdu: University of Electronic Science and Technology of China.
11. Wang Yifeng, Mao Jingxiang. 2008. “Analysis on development status of terahertz technology and application prospect,” Electro-Optic Technology Application, 23(1):1-5.
12. Xu Jingzhou, Zhang Xicheng.2007. “Technology and applications of Terahertz science,” Beijing: Beijing University Press.
13. Zhang Cunlin, Mu Kaijun.2010. “Terahertz Spectroscopy and Imaging,” Laser & Optoelectronics Progress, 47(2):1-14.
14. Zhang Yu, Zhang Jianlin, Jiang Changsheng. 2008. “Algorithm of scanning terahertz imaging on computer,” Computer Engineering and Applications, 44(11):234-236.
15. Xu Xia, Liu Haixia, Yin Yong.2013. “LabVIEW based control software for millimeter wave imaging system,” Modern Electronics Technique, 3:112-114.